-
Paper Information
- Paper Submission
-
Journal Information
- About This Journal
- Editorial Board
- Current Issue
- Archive
- Author Guidelines
- Contact Us
American Journal of Materials Science
p-ISSN: 2162-9382 e-ISSN: 2162-8424
2025; 15(1): 1-8
doi:10.5923/j.materials.20251501.01
Received: Jun. 7, 2025; Accepted: Jul. 2, 2025; Published: Jul. 25, 2025

Effects of Psidium guajava Extract on Optical and Structural Properties of Tin Oxide Nanoparticles
 Abstract
 Reference
 Full-Text PDF
 Full-text HTML
Bethwel Kiprotich, Peter Waithaka, Sylvia A. Opiyo, Sharon Kiprotich
Department of Physical and Biological Science, Murang’a University of Technology, Murang’a, Kenya
Correspondence to: Sharon Kiprotich, Department of Physical and Biological Science, Murang’a University of Technology, Murang’a, Kenya.
| Email: |  |
Copyright © 2025 The Author(s). Published by Scientific & Academic Publishing.
This work is licensed under the Creative Commons Attribution International License (CC BY).
http://creativecommons.org/licenses/by/4.0/

Nanotechnology has become the most promising area of research with its application in various fields of science such as solar cell. Metals and metal oxide nanoparticles (NPs) are mainly synthesized by chemical methods that have unintended effects such as environmental pollution, large energy consumption and potential health problems. In response to these challenges, green synthesis, which uses plant extracts instead of industrial chemical agents to reduce metal ions, has been developed. In this study, nanocrystalline tin oxide (SnO2) NPs were synthesized by green method using Psidium guajava extract as a capping agent. The synthesized NPs were characterized using X-ray diffractometer (XRD), Ultra-violet visible spectrometer (UV-Vis) and photoluminescence spectroscopy. The XRD analysis revealed that synthesized SnO2 nanoparticles have tetragonal rutile structure. Crystallite sizes were found to be 14.89 and 18.00 nm estimated by using Debye-Scherrer’s equation for capped and uncapped SnO2 NPs the capping agent respectively. Photoluminescence study of prepared SnO2 NPs excited at 260 nm showed emission peak at 472.67 nm for capped and 353.32, 378.09 394.21 and 472.67 nm uncapped SnO2.UV-Vis spectroscopy was used to determine the absorbance which was found to be 308 (capped) and 290 nm (uncapped) SnO2NPs. The band gap energy was estimated using Tauc's equation and found to be 3.98 and 3.21 eV for capped and uncapped SnO2 NPs respectively. Fourier transform infrared spectroscopy showed the stretching vibration of Sn-O at 749.23 and 746.44 cm-1 wavenumbers for capped and uncapped SnO2 respectively. This study successfully demonstrates the green synthesis of tin oxide (SnO2) nanoparticles using Psidium guajava extract as a capping agent. The characterization results confirm the formation of tetragonal rutile SnO2 nanoparticles with varying crystallite sizes and optical properties between capped and uncapped samples. Further studies should focus on optimizing reaction conditions, such as extract concentration, temperature, and reaction time, to improve nanoparticle quality and yield.
Keywords: Nanoparticles, Tin oxide, Band gap, Green Synthesis, Psidium guajava extract, Optical Properties
Cite this paper: Bethwel Kiprotich, Peter Waithaka, Sylvia A. Opiyo, Sharon Kiprotich, Effects of Psidium guajava Extract on Optical and Structural Properties of Tin Oxide Nanoparticles, American Journal of Materials Science, Vol. 15 No. 1, 2025, pp. 1-8. doi: 10.5923/j.materials.20251501.01.
Article Outline
1. Introduction
- Over recent years, nanoscience and nanotechnology are attracting and focusing more attention in many commercial applications. Particle size, shape and surface states are the predominant factors, which influences its properties such as optical, magnetic, electric and catalytic [1]. Due to small size, surface, interface and quantum effects, they have physical and chemical properties which are not found in bulk material. Recently, tremendous efforts in materials with reduced dimensions, in nanometre scale, have been developed for the fabrication of new miniaturized electronic devices and sensors [1], which work more efficiently and selectively as compared to the existing devices so far. Tin oxide SnO2 is one of the most promising photocatalyst due to its 3.6 eV band gap and its n-type crystal structure [2] SnO2 has found applications in gas sensors, transparent conducting electrode, transistor, solar cells, special coating for energy-conversion, low-emissivity windows, and nano electronic devices [3]. SnO2 has a key advantage over other materials such as TiO2 since it offers high electron mobility leading to faster photo generated electron transport [4]. Thus, a great deal of research work has been devoted to the method of synthesizing SnO2 particles of nano sizes in a controllable manner. Different methods have been used to synthesize the SnO2 nanoparticles such as sol-gel route [5], hydrothermal method [6], spray pyrolysis [7], chemical vapor deposition [8], thermal evaporation of oxide powder [6], and green-method [9]. Among these, synthesis by bio-based green synthesis approach has gained considerable interest [10].Physical and chemical methods are gradually being replaced by green synthesis methods [11] because of issues related to consumption of large amount of energy [12], release of toxic and harmful chemicals [13] and use of complex equipment and synthesis conditions [14]. Green synthesis provides advancement over chemical and physical methods as it is non-toxic [15], pollution free [11], environment friendly and economical [16]. Additionally, it is easy to scale up for large-scale synthesis and there is no need to use high pressure, energy, temperature and toxic chemicals [17], [18]. Green synthesis mainly uses microorganisms (fungal, bacteria, and algae) [19] or extracts from leaves, flowers, roots, peelings, fruits, and seeds of various plants [15,20-23]. Novel metal and metal oxide nanoparticles such as Ag, Au and Pt nanoparticles have been synthesized using plant extracts [21]. Plant extracts contain polyphenols and proteins [22] that can replace chemical reagents. Studies suggested that biomolecules phytochemicals present in plant extracts are polyphenolic flavonoids, alkaloids, phenolic acids, polyphenols, proteins, sugars, and terpenoids act as the capping and reducing agent towards tin cation [23]. During the synthesis stage, biomolecules prevent particle agglomeration, ensuring the dispersed formation of nanoparticles. This enhances the surface area-to-volume ratio [24]. Here in this paper, we have synthesized SnO2 NPs using guava (Psidium guajava) leaf extracts by a simple and economical synthesis method [16-18]. Guava leaf extracts have found to contain phenolic compounds, flavonoids, sesquiterpene alcohols and triterpenoid acids which possess antioxidant, antimicrobial as well as antitumor properties [25]. The biocompatible mechanism of SnO2 NPs formation is presumably initiated when the solution of the salt precursor is mixed with aqueous extract of leaves. The cation of tin dispenses in the solution and forms the complex with hydroxyl groups of biomolecules that is believed to be actively functionalized through chelation activity. The possible biomolecules that are likely to be taken into account in the mechanism are the polyphenolic biomolecules. The polyphenolic compounds contain adjacent hydroxyl groups in the aromatic ring which acts as both capping and stabilizing agents. SnO2 NPs is formed by this method through some major steps, including (i) reduction of Sn2+ to Sn0, (ii) the reducing effect of phenolic compounds (–OH) of extract to form Sn species, and (iii) thermal transformation of the Sn species into the SnO2 NPs [23]. The biomolecules keep their group from agglomeration among themselves, and finally, SnO2 NPs were furnished after the complex of the biomolecule-tin cation was calcined under thermal treatment. The proposed mechanism for the formation of SnO2 NPs is shown in Figure 1.
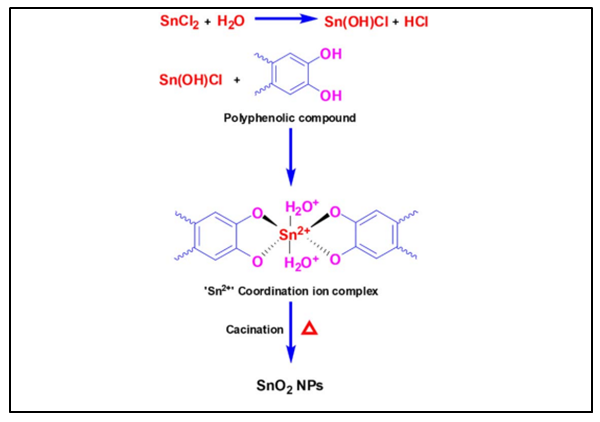 | Figure 1. Mechanism for formation of SnO2 NPs using psidium guajava leaf extract |
2. Material and Methods
2.1. Materials
- All chemicals used were of analytical grade and used as purchased without any alteration. They include: stannous chloride dihydrate (SnCl2.2H2O) (>98%), ethanol (C2H5OH) (>99.9%) guava leaves and deionized water. Deionized water was prepared in Murang’a University of Technology Research Laboratory.
2.2. Preparations Psidium guajava Leaf Extract
- Guava (Psidium quajava) leaves were collected from a farm in Murang’a County near Murang’a University of Technology, Kenya. The County is located in central Kenya at latitudes of 0° 34' S and 1° 7' S and longitudes 36° E and 37° 27' E. The samples were first cleaned using running tap water followed by deionized water to remove surface pollutants. The washed leaves were dried in an oven at 50°C for 5 hours before crushing using a blender. 4.0g of the sample was introduced to 100ml of deionized water and heated at temperature of 60°C for 30 minutes. After cooling to room temperature, the mixture was filtered using 1mm Whatmann filter paper (Figure 2) and stored in a refrigerator to be used as capping agent in the synthesis.
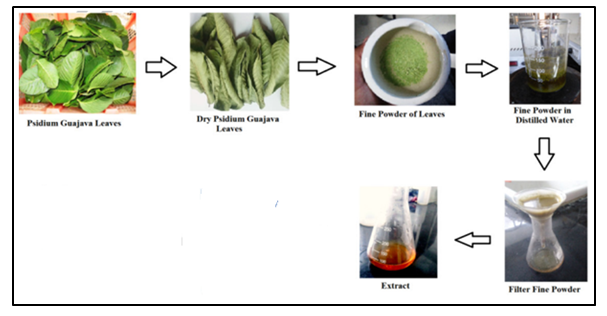 | Figure 2. Preparation of guava leaf extract |
2.3. Preparation of Tin Oxide Nanoparticles
- The nanoparticles were prepared following the method described by Kunar et al [9] with modifications. 1.35g of stannous chloride dihydrate was introduced in to a2 neck refluxing bottle containing30 ml of deionized water and stirred for 2 minutes at room temperature. 30 ml of Psidium guajava extract was added to the solution after ammonia hydroxide was added dropwise using a dropper to raise the pH to 9. The solution was refluxed at 60°C for 3 hours. Aging process was allowed for 24 hours then washed with ethanol and deionized water through decantation. After cleaning, drying was done using laboratory oven at 100°C for 2 hours and annealed at 500°C for 3 hours. The above procedure was repeated without using the Psidium guajava extract.
2.4. Characterization of Nanoparticles
- The as-prepared SnO2nanopowders were characterized by powder X-ray diffraction (XRD) model ARL EQUINOX 100 at 40kV, 0.9mA, with CuK𝛼 radiation of wavelength 1.5406 Å. Crystallographic parameters were calculated from the XRD pattern and origin software was used to construct and draw the graphs for analyses. Fourier transform infrared spectroscopy (FT-IR) Shimadzu model was used to determine the functional groups present in the nanoparticles. The photoluminescence measurements were carried using photoluminescence spectroscopy (PL) Infitek SPLF97 model at room temperature with 260 nm as the excitation wavelength. The optical properties of SnO2 nanoparticles were determined using Evolution One Plus Model Ultra Violet spectroscopy.
3. Results and Discussion
3.1. UV-Vis Analysis
- Figure 3 depicts the absorbance spectra of synthesized tin oxide with (capped) and without (uncapped) the capping agent in the range 150-800 nm. Absorption peak was observed at 308nm and 290nm for capped and uncapped samples respectively. The variation in the absorbance is due to the presence of various ingredients in the guava leaves which results in the formation of tin ions [26]. The absorption band is due to photoexcitation of the electrons from valence band (VB) to conduction band (CB) [27]. The absorption is different from that of bulk tin oxide whose value is 337 nm [5]. This is due to quantum confinement effect [28]. When nanoparticle size falls below this threshold, quantum confinement leads to energy level quantization and an increased bandgap. Govindasamy et al [29] reported an absorbance of 298 nm of tin oxide synthesized using Prosopis juliflora extract.
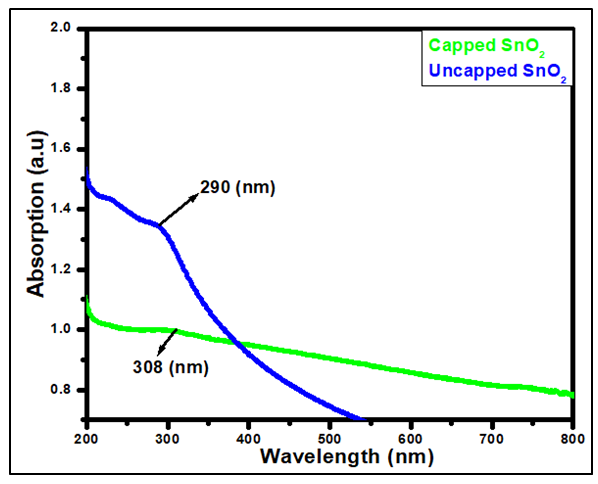 | Figure 3. Absorbance spectra of synthesized tin oxide with (capped) and without (uncapped) Psidium guajava extract |
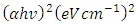 against photon energy (hv) (eV) (Figure 4). By extrapolating the linear portion of each curve (the rising edge) to the x-axis, the bandgap energy is estimated as the x-intercept. The optical bandgap energies of both capped and uncapped SnO2 were quantitatively determined by utilizing the Tauc’s plot equation (Equation 1) [30], which is an estimated technique for estimating semiconductors bandgap energy from its absorbance spectrum.
 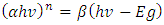 | (1) |
 is the optical absorption coefficient, h is the planks constant, v is the photon frequency, Eg is the bandgap,
  is the proportional constant, and n is the electronic transition. n can be 2 or
  for direct and indirect allowed transition respectively or can be
  or
or  for direct and indirect forbidden transition respectively. Deviations from the ideal crystal structure, growth imperfections, oxygen vacancies, and quantum effects in nanoparticles can alter the energy band structure and affect bandgap. From figure 4, the band gap energy of 3.98 and 3.21 eV was obtained for capped and uncapped SnO2 respectively. This suggests that the optical bandgap of SnO2 changes with respect to the synthesis method used [6]. Capped and uncapped SnO2NPs were found to have a higher and lower bandgap value compare to the bulk value (3.6 eV) [31] respectively. For capped sample, the difference is due to the electron quantum confinement effect [28].When nanoparticle size falls below this threshold, quantum confinement leads to energy level quantization and an increased bandgap. As a result, capped SnO2 nanoparticles exhibit larger band gap energy as compared to the bulk, similar report was observed by Binadi et al [26] and Kumat et al [9]. The variation is due to the changes in the morphologies, particle size and surface microstructure [32]. Nagirnyaket al [8] reported a blue shift in the bandgap for capped SnO2 using Prosopis juliflora and uncapped method. Capped SnO2 wider band gap gives it an advantage in photodetectors since it enables the absorption of UV photons without reducing sensitivity to lower-energy visible light [26]. For uncapped sample the band gap is lower than that of the bulk, similar report has been reported by Doyan et al [33], Nagirnyaket al [8] and Thankaianet al [34]. The deviation in energy gap values from the energy gap of bulk tin oxide is explained by a combination of the drop in surface charge distribution and the significant quantity of oxygen vacancies preserved in the material [34]. This is in contrast to the normal phenomenon of quantum confinement even though the size decreases. These findings concur with earlier research, and offer a deeper understanding of the electronic structure of the SnO2 NPs synthesized through different methods [8]. Additionally, the variation in the band gap energy of capped and uncapped is due to different synthesis method which can introduce different types and levels of defects, such as oxygen vacancies, which in turn affect the bandgap [35].
 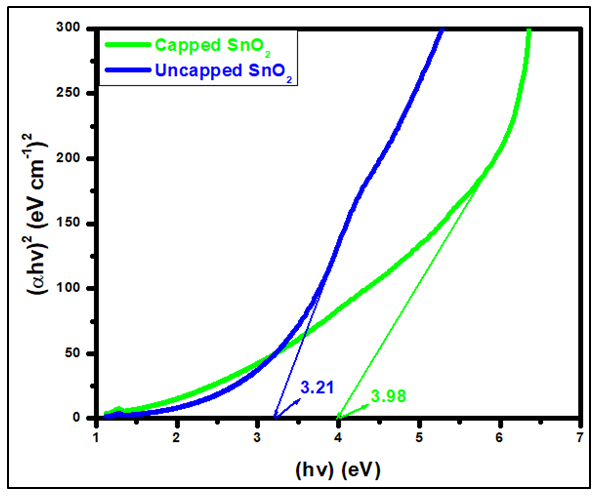 | Figure 4. Tauc‟s plot extrapolation of synthesized pure tin oxide with (capped)and without(without) Psidium guajava extract |
3.2. XRD Analysis
- Measurements were performed using an X-Ray Diffractometer (XRD) model ARL EQUINOX 100 in the range 20°-80°, which was operated at a voltage of 40 kV and current of 0.9 mA with a target Cu (1.54060 Å). Figure 5 displays XRD pattern at specific 2𝜃 values at 26.55, 34.04, 38.1551.99,54.96, 57.98,61.59,65.83 and 71.28 for capped SnO2 and 26.55, 34.03, 38.73, 51.91, 54.96, 57.98, 61.59, 65.48 and 71.28 for uncapped SnO2along the miller indices 110, 101, 200, 211, 220, 002, 310, 301, 202 and 321. Additional peak was observed at 46° was more intense in uncapped than for the capped SnO2 nanoparticles. The obtained XRD pattern indicates that the synthesized NPs possess a rutile structure with tetragonal unit cell and was further confirmed by the Joint Committee on Powder Diffraction Standards (JCPDS) card 00-041-1445.
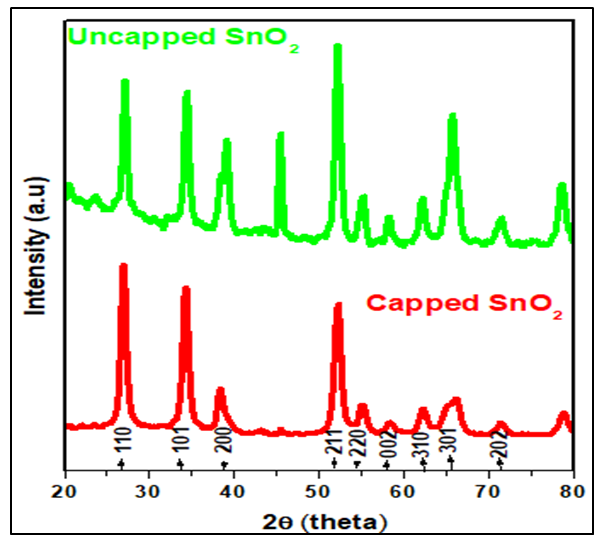 | Figure 5. XRD pattern of SnO2 synthesized with and without the capping agent |
 | (2) |
 | (3) |
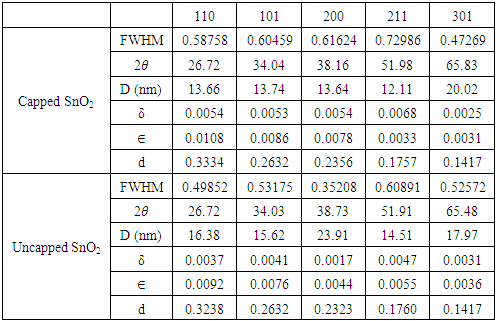
 is the dislocation density and D is the crystal size, 𝜆 is an X-Ray wavelength and 𝜃 is the Bragg‟s diffraction angle. Table 1 also shows the micro-strain (∈) values, which were computed using the equation,
 [39] where 𝜃 is the diffraction angle and 𝛽 is the full width at half maximum. From the table 1, it is observed that in the crystal size is inversely proportional to FWHM.
|
3.3. Photoluminescence Spectroscopy
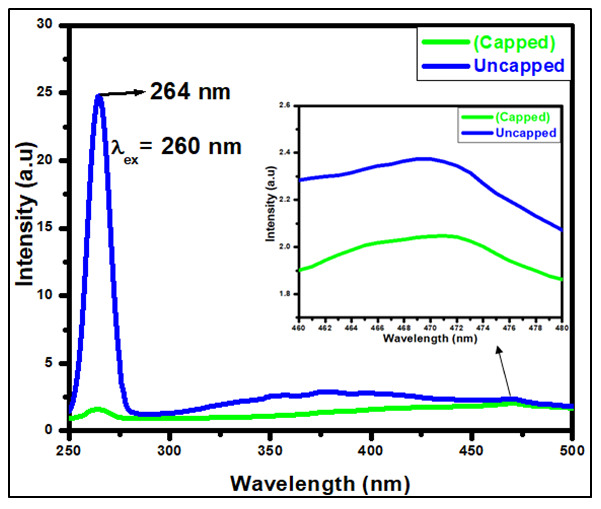
- Figure 6 depicts photoluminescence spectra of synthesized SnO2 NPs with and without the capping agent in the range 250-500 nm. The analysis was done at room temperature with an excitation wavelength of 260 nm. Tin oxide has been reported to have varying absorption wavelength at 275 nm [31], 300 nm [40], 325 nm [8]. The PL study is performed to determine the ability of the material to absorb photon energy and emit due to the oxygen vacancies, charge recombination and migration efficiency of the synthesized NPs. Excitation peak at 264 nm was observed for Psidium guajava capped and uncapped SnO2NPs with uncapped SnO2 having higher peak intensity than capped SnO2NPs. PL spectra show two types of emission: near band edge emission (NBE) in UV region and defect level emission (DLE) in the visible region. Three emission peaks are observed at 354.62, 378.74 and 468.21 nm for uncapped and 468.21 capped SnO2. The peaks around near UV region (354.62 and 378.74 nm) for uncapped sample belong to near band edge emission (NBE) which is formed due to the recombination of electrons in the conduction band and holes in the valence band [28] leading to the formation of positively charged holes and negatively charged electrons. The presence of free charge carriers decides the intensity of the photoluminescence peak [41]. In SnO2, oxygen vacancies are present in three different charge states: VO, V+1 and V+2, in which V0 is very weak shallow donor [31]. The origin of visible emission can be assigned to the recombination of electrons in the shallow levels with the photo excited holes in valence band. In metal oxide materials most of the defects belong to oxygen vacancy and interstitials of the material. Those oxygen vacancies are intrinsic defects and they can trap the electrons and act as an ionized vacancy. The ionized vacancies act as defect donors and form new energy level; they also have an impact in optical properties of the SnO2 photocatalyst. From the inset in figure 6, the peak at 468.21 nm belongs to Deep Level Emission (DLE) which is attributed due to the impurities and structural defect in the synthesized NPs [42]. These defects act as luminescent centres [43]. Similar investigation was also reported by Suthakaran et al [40].
 | Figure 6. PL spectra of SnO2 NPs with and without the capping agent in the range 250-500 nm |
3.4. FTIR Analysis
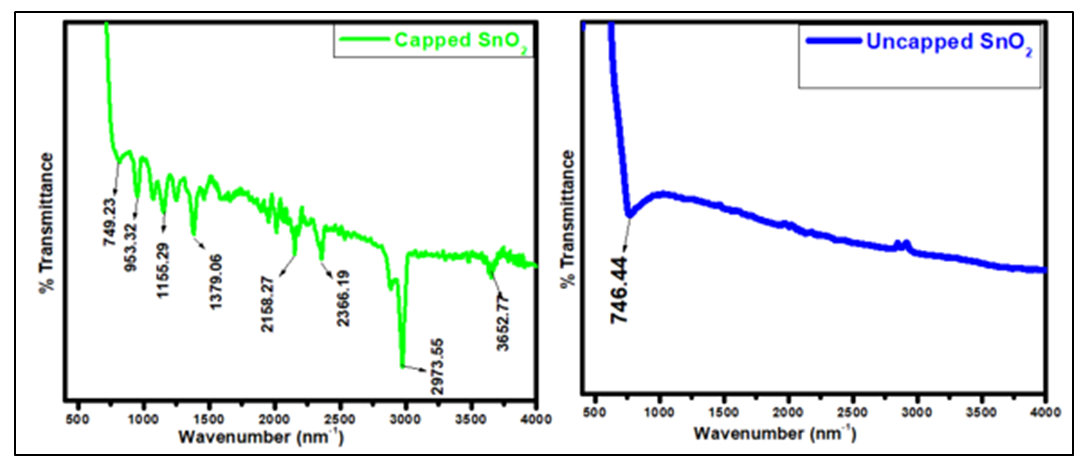
- Capped and uncapped SnO2 samples were characterized by FTIR spectroscopy Shimadzu model with 32 numbers of scans in order to identify the chemical bonding and functional group present. Figure 7 shows the FT-IR spectra of plant extract capped and uncapped SnO2. It was recorded in the range of 400-4000cm-1, and main bands were observed on both fingerprint and functional groups region for capped SnO2 and uncapped SnO2 shows a peak only at the finger print region. The observed peak at3652.77 cm-1for capped SnO2 is due to the stretching vibration of O-H bond [46] which is in the range reported by [47], the peak is due to OH groups and the adsorbed water bound at the SnO2 surface. The O-H peak observed in the capped SnO2 indicates that hydroxyl groups are present, likely due to the interaction between the guava phytochemicals and the tin oxide surface. The observed peak at 2973.55cm-1 is due to the C-H stretching which is associated with organic compounds from the guava leaves and the peak is more intense than other peaks in the spectra. Presence of C≡C was observed at 2158.37cm-1 while at 749.23 and 746.44cm-1 corresponds to Sn-O for capped and uncapped SnO2 respectively which confirms the formation of metal oxide [48]. The peak at 1155.29 cm-1 corresponds to C-O stretching. The set of peaks in the range of 1550 to 890 cm−1 is due to the vibration of hydroxyl tin bonds [49].
 | Figure 7. FTIR spectra of capped and uncapped SnO2 in the range 400-4000 cm-1 |
4. Conclusions
- In the present work SnO2 NPs were successfully synthesized via simple and low cost, eco-friendly green synthesis method using guava (Psidium Guajava) leaf extract. The average crystallite size calculated by using Debye-Scherer‟s equations was found to be 14.89 nm. The lattice strain of synthesized SnO2 NPs was found to be 0.0057 is higher than for uncapped SnO2 with 0.0053, hence capped SnO2 have a small size than uncapped SnO2. This research has demonstrated that Psidium guajava extract when used as capping agent engineer the material properties of SnO2 NPs. Psidium guajava can therefore be used as a substitute for commercial capping agents since it is readily available, inexpensive and environmentally friendly hence, reducing the use of chemical capping agents during the synthesis of NPs. The synthesized SnO2 NPs capped with Psidium guajava was therefore a success for possible applications in photovoltaics.
ACKNOWLEDGEMENTS
- Special thanks to BMBF, the German Ministry of Education and Research and UNESCO-TWAS for funding the work. The authors also wish to the thank Murang’a University of Technology for providing the synthesis and characterization equipment.
Conflict of Interests
- None.