-
Paper Information
- Paper Submission
-
Journal Information
- About This Journal
- Editorial Board
- Current Issue
- Archive
- Author Guidelines
- Contact Us
American Journal of Materials Science
p-ISSN: 2162-9382 e-ISSN: 2162-8424
2024; 14(2): 31-44
doi:10.5923/j.materials.20241402.02
Received: Oct. 18, 2024; Accepted: Nov. 6, 2024; Published: Nov. 12, 2024

Energy Band-gap Engineering for ZnO as a Photoanode of Dye Sensitized Solar Cells; An ab initio Study
 Abstract
 Reference
 Full-Text PDF
 Full-text HTML
Irungu M. Kahura1, Kiprotich Sharon1, Winfred M. Mulwa2
1Department of Physical and Biological Sciences, Murang’a University of Technology, Murang’a, Kenya
2Department of Physics, Egerton University, Egerton, Kenya
Correspondence to: Winfred M. Mulwa, Department of Physics, Egerton University, Egerton, Kenya.
| Email: |  |
Copyright © 2024 The Author(s). Published by Scientific & Academic Publishing.
This work is licensed under the Creative Commons Attribution International License (CC BY).
http://creativecommons.org/licenses/by/4.0/

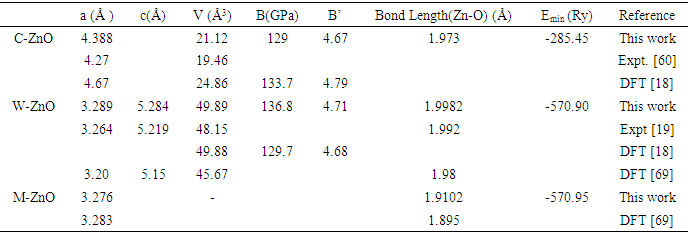
For optimal functionality of photovoltaic devices, it is imperative to utilize efficient compounds characterized by outstanding optoelectronic properties. The potentiality of compounds such as ZnO is not yet exhaustively exploited. In The present investigation, we execute the ab initio studies based on density functional theory (DFT) to explore the structural, elastic, mechanical, electronic, dynamical, transport and optical properties of three phases of ZnO. Ground state properties were determined in two distinct scenarios, that is, by application of standard DFT and use of the Green functional (GW) approximation. The calculated lattice constants of 4.388 Å for C-ZnO, 3.289 Å for Wurtzite (W)-ZnO and 3.276 Å for monolayer (M)-ZnO are in agreement with other DFT findings and experimental results obtained from literature. The investigated compounds were found to be mechanically and dynamically stable at ground state, ductile and anisotropic.The optical absorption coefficient curves prove that ZnO is transparent to many solar radiations as expected in photoanode of dye sensitized solar cells (DSSCs). All structures tested displayed direct band gap at gamma point of symmetry. The optical band gap was found to increase on average by 2.33 eV when GW approximation was taken into account. Basically, the inclusion of the Green’s function (G) and the screened Coulomb interaction (W) in DFT enhances the predictions of the energy band gap and optical properties. The O-2s, Zn-3d and O-2p orbitals were found to dominate the valence band while 0-2p and Zn-4s orbitals dominated the conduction band. Generally, ZnO was found to have low absorption ability and high transmittance in the visible spectrum and therefore making it suitable candidate for DSSCs application. The monolayer ZnO demonstrated the highest electrical conductivity as desired in DSSC’s.
Keywords: GW, Band gap, Dynamical properties, Optical properties, Photoanode, DSSCs
Cite this paper: Irungu M. Kahura, Kiprotich Sharon, Winfred M. Mulwa, Energy Band-gap Engineering for ZnO as a Photoanode of Dye Sensitized Solar Cells; An ab initio Study, American Journal of Materials Science, Vol. 14 No. 2, 2024, pp. 31-44. doi: 10.5923/j.materials.20241402.02.
Article Outline
1. Introduction
- In the last few years, there has been a growing fascination with dye-sensitized solar cells (DSSCs) among researchers and industry professionals as a next generation sustainable and eco-friendly energy resource, due to the exhaustion of finite fossil fuel [1,2]. In addition, DSSCs provide a cost-efficient substitution to the current commercial solar cells due to their flexibility, high efficiency and excellent transparency. DSSCs are devised with several components including photoanode (working electrode), electrolyte, dye sensitizer and counter electrode (Cathode). The Photoanode serves a pivotal function as a matrix for dye adsorption as well as conducting photo emitted electrons to the external load circuit. Consequently, DSSC’s are designed by use of wide bandgap semiconductive compounds such as TiO2, SnO2, Nb2O5, ZnO and many others as photoanode for state-of-the-art results [3,4]. Among these, TiO2 based DSSC have widely been studied and a maximum efficiency of 14% has been reported [5]. However, ZnO exhibit better potential candidature as a DSSC working electrode owing to its exemplary electron mobility and varying morphology [6]. ZnO has tunable electronic band gap, high optical transparency, insignificant toxicity and economical preparation cost. It’s large surface area enhances adsorption with organic dye hence optimized photon absorption. These aspects of ZnO have yielded into numerous and diverse reports of ZnO applied as an active acceptor compound in hybrid solar cells [7,8]. In DSSC’s, ZnO has been utilized as a semiconducting scaffold [9,10], as well a charge transport layer [11,12]. Additionally, ZnO is a distinctive compound characterized by its inherent semiconducting and piezoelectric properties. [13,14]. This oxide semiconductor exhibits versatility, characterized by a direct bandgap of 3.37 eV and a high free exciton binding energy of 60 meV at ambient temperature. [15,16]. ZnO exists in three main crystalline phases; Wurtzite (hexagonal), zinc blende (cubic) and Rock salt (cubic) [17,18]. Both the Wurtzite and zinc blende can exist under room pressure but rock salt only yields from the metamorphosis of Wurtzite ZnO at high pressure and temperature. Several recent experimental and ab initio studies have been reported on the fundamental properties of wurtzite ZnO (W-ZnO). Structural characterization with x-ray diffractometer (XRD) has been conducted on W-ZnO nanostructures synthesized using reflux precipitation [19] and sol-gel [20] experimental techniques. According to these studies, W-ZnO belongs to the p63mc space group having a hexagonal crystalline structure with lattice constants a=3.264 Å and c=5.219 Å. Dhamodharan et al [21] fabricated ZnO based thin films applying the spray pyrolysis technique and investigated its optical properties by use of spectrophotometer. A direct band gap of 3.37eV as well as high optical transmittance (85-95%) in the visible region that decreased with increasing photon energy was observed in their work. Similarly, computational techniques have also been utilized to supplement experimental data on ZnO. Density functional theory (DFT) as a computational technique has successfully been used to give insights into the ground state nature of W-ZnO. With the use of WIEN2K in the generalized gradient approximation (GGA) formalism, Khuili et al., [22], confirmed the hexagonal structure of W-ZnO with lattice constants a=3.248 Å and c= 5.222 Å. A direct band gap of 0.8eV at gamma point of symmetry was reported. This was higher than 0.65eV obtained by Qing et al [23] using local density approximation (LDA) potentials in QE code. Lei et al [24] employed the CASTEP code using GGA potentials to implement DFT in the electronic structure calculations. They observed that the valence band maximum (VBM) was occupied mainly by O-2p states while the conduction band minimum (CBM) was dominated by Zn-4s states giving a direct band gap of 0.734 eV. John and Padmavathi [25] introduced the modified Becke-Johnson (mBJ) potentials to the LDA potential in their DFT study of the optical properties of W-ZnO. A low energy loss in the visible spectrum, an absorption edge of 2.68eV, static refractive index
 = 1.648 were reported in their study. To investigate on the electronic and elastic properties of W-ZnO, Gopal and Spaldin [26] used the VASP code to implement DFT with Self- Interaction Corrected (SIC) and LDA potentials for comparison. While the standard LDA underestimated the band gap at 0.78eV, SIC-LDA overestimated it at 3.8eV. The five independent elastic constants for hexagonal W-ZnO obtained with SIC-LDA potentials were C11=217, C12=117, C13=121, C33=225 and C44=50 GPa. In ambient conditions of pressure and temperature, a thermodynamically metastable cubic ZnO can be obtained from wurtzite phase. In their study, Decremps et. al [27] reported the growth of zinc blende structure of ZnO on a Pt (111)/Ti/SiO2 /Si substrate when an annealing temperature beyond 700°C is used. A cubic crystal structure was observed in their study with a lattice parameter a=b=c= 4.595 Å. Kims et.al [28] confirmed the reconstruction of hexagonal to cubic structure by annealing at a temperature higher than 700°C. Haq et. al [29] utilized the WIEN2K to implement a comparative DFT study of cadmium (Cd) doping on the wurtzite and zinc blende phases of ZnO. From their study W-ZnO demonstrated a wider band gap of 0.736 eV as compared to 0.63 eV of cubic ZnO. Structural- dependence of the optical properties of ZnO was as well deduced from their study.The invention of the first 2D material known as graphene by Novoselov et. al [30] in 2004 has revolutionalised research in photovoltaic, photocatalytic and sensing compounds [31-33]. Graphene has gained enormous interest in the research sector for its wide surface area, superior electron mobility and high transparency [34]. Being good electrical conductor, the VB and CB and of graphene however overlap making it lack the band gap desired in DSSC Photoanode. Inspired by the fascinating and superior properties of graphene, researchers are therefore vigorously exploring for monolayer (2D) semiconductors [35]. The focus of the ongoing studies is to develop environmentally friendly nanostructures such as nanowires, nanosheets, nanogenerators among others based on 2D monolayer materials. To this effect, the non-toxic and cost effective ZnO has gained immense interest as a potential 2D material for nanoscale fabrications. Research is therefore at an advanced stage to establish the material properties of mono-layered ZnO and moreso in comparison with the bulk phases. Chen et. al [36] investigated on the synergetic influence of defects on 2D-ZnO prepared through hydrothermal technique on the photocatalytic performance. According to their study, 2D-ZnO displayed enhanced charge carrier separation due to intrinsic electric field between the polar surfaces. Qin et. al [37] computed the electronic and magnetic properties of ZnO monolayer nanosheet. They observed a wider band gap of 1.56eV in standard DFT calculations as compared to 0.734 eV for bulk wurtzite ZnO obtained by Lei et al [24]. Based on a first principle investigation undertaken by Tan et. al [38], the ZnO monolayer optical and electronic properties are tunable by doping. Pure and Cd doped ZnO monolayer exhibits a direct band gap at gamma point but wider than the bulk wurtzite ZnO. This resulted from the quantum confinement effect and can yield into a higher transparency to visible light. From the above discussion, the structural formation of ZnO material is reported to possess a significant effect on its electronic, optical, mechanical and electrical properties. Specifically, the effectiveness of photovoltaic is significantly influenced the crystal structure of the compounds employed. [38]. Additionally, very little is known on the electrical conductivity, mechanical, elastic and photon absorption of monolayer ZnO as compared to the cubic and hexagonal bulk structures. This study contributes to this domain by providing an in depth comparative analysis of material properties of the metastable cubic zinc blende, Wurtzite and monolayer ZnO. The monolayer of ZnO was derived from Wurtzite ZnO phase since it is reported to be more stable under ambient conditions. DFT has been verified as a reliable and effective computational technique in the study of fundamental material properties [39-41]. However, the band gap underestimation in the standard DFT is a major limitation in the accurate prediction of electronic properties of materials. The use of approximated potentials in the Kohn-Sham implementation, results to generation of self-interaction errors [42]. The hybridization between the Zn-3d and O-2p shells is therefore inadequately dealt with by standard semi-local exchange correlation (XC) functionals, resulting into the shrinking of the band gap [40]. Green functional (GW) approximation [42,43] puts into consideration the self-energy of a many-body system of electrons and has been used in this study to reproduce the experimental band gaps of compounds tested as well as optical analysis.
2. Computational Details
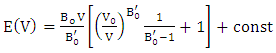
- This study utilized ab initio DFT as implemented in Plane Wave Self Consistent Field (PWSCF) approach of Quantum ESPRESSO (QE) code [44]. The optimized Norm-Conserving Vanderbilt (ONCV) pseudopotentials within the Generalized Gradient Approximation, employing the Perdew-Burke-Ernzerhof (GGA-PBE) functionals [45], taken from the pslibrary [46] were employed to illustrate the electron - ion interaction. The k-integration was carried out on a Monk–Horst packing grid [47] with a size of 8x8x6 k-point mesh for the hexagonal structure, 6 x 6 x 6 k-point mesh for the cubic structure and 6x6x1 for the monolayer phase. The limit cutoff energy was set at 40 Ry for all the phases throughout the whole Brillouin zones. We have utilized the Broyden-Fletcher-Goldfarb-Shanno (BFGS) [48]. The extraction of physical parameters, including the bulk modulus and its pressure derivatives, involved fitting the computed total energy at ten varying lattice constants to a third-order Murnaghan equation of state (49), as illustrated in equation 1.
 | (1) |
 is the bulk modulus,
  is the equilibrium unit cell volume,
  is the pressure derivative of the bulk modulus. The thermo-pw code [50], which is an open-source code in QE Code was utilized to perform the elastic properties computations. The thermo_pw code, subjected a strain of 0.0075 to the system in order to produce these properties. Epsilon.x input within QE was used to compute the optical properties of the investigated compounds. The Zener anisotropy index was determined using elastic constants, while the Voigt and Reuss methods were applied to derive the equivalent Zener anisotropy measure and the universal anisotropy index based on the computed shear modulus (G). The electronic properties were calculated comparatively with both standard DFT as well as GW approximation techniques. The transport properties were determined by use of the semi-classical transport theory [51] which is executed in the BoltzTrap code [52].
3. Results and Discussions
3.1. Structure of ZnO
- The crystal structures of the three phases of ZnO tested in this study are presented in Figure 1. The unit cell of the cubic structure (C-ZnO) used in this study belongs to the F43m while the hexagonal structure (W-ZnO) belong to P63mc space group. The monolayer (M-ZnO) was cleaved from a 2 x 2 x 1 wurtzite supercell. The W-ZnO crystal is characterized by two interpenetrating hexagonal close-packed (HCP) sub-lattices. Each of these HCP structures contains a single type of atom that is offset along the threefold c-axis by an internal parameter u of 0.375, consistent with the ideal wurtzite configuration. The unit cell of a C-ZnO has a face- centered cubic lattice such that the Zn and O alternate in tetrahedral arrangement throughout the crystal. It has the zinc blende structure with a Zn atom located at (0,0, 0) and O atom located at (0.25,0.25,0.25). Table 1 presents the computed lattice constants in comparison with other previous reports.
|
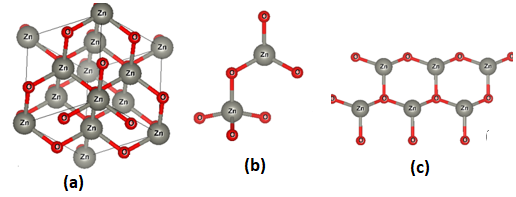 | Figure 1. Schematic representation of (a) C-ZnO, (b) W-ZnO and (c) M-ZnO structure using VESTA code [53] |
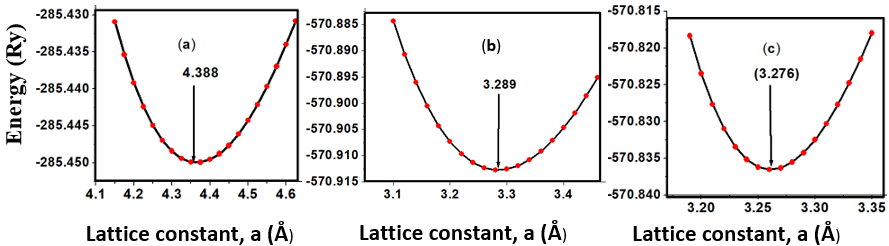 | Figure 2. Total energies as a function of lattice constant, a for (a) C-ZnO, (b) W-ZnO and (c) M-ZnO |
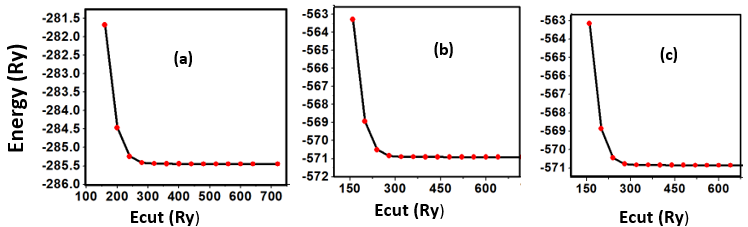 | Figure 3. Total energies as a function of Ecut for (a) C-ZnO, (b) W-ZnO and (c) M-ZnO |
 | Figure 4. Total energies as a function of k-point for (a) C-ZnO, (b) W-ZnO and (c) M-ZnO |
3.2. Mechanical Properties
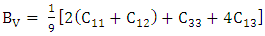
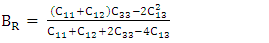
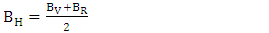
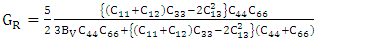
- The elastic constants, Cij, are critical distinctives for interpretation of the mechanical performance of stressed materials [54]. These constants offer knowledge on the binding between adjacent atomic planes, the anisotropic behavior of binding, stiffness and structural stability. Using the Voigt (V) [55], Reuss, (R) [56] and Hill (R) [57] averaging approach, various elastic properties were deduced. The bulk modulus which illustrates the measure of incompressibility was computed from the average of Bv and BR as described by equations 2-4.
 | (2) |
 | (3) |
 | (4) |
 | (5) |
 | (6) |
 | (7) |
 | (8) |
|
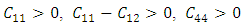 and
and 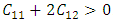 Similarly, the stability of W-ZnO and M-ZnO was also ascertained having fulfilled the stability criterion for hexagonal structures [59] defined as:
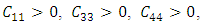
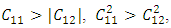
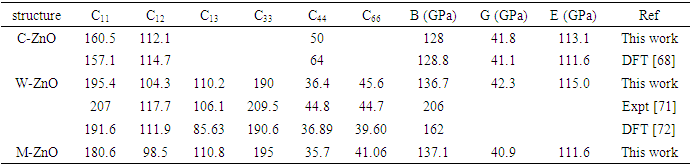
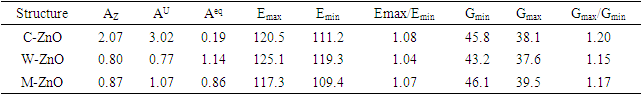
 The values of 𝐶11 and 𝐶33 reflect the linear compression resistance associated with the a and c orientations, respectively. In comparison to other elastic constants, the values of 𝐶11 and 𝐶33 are notably elevated. This demonstrates that ZnO material exhibits incompressibility in both the a and c orientations when exposed to stress. The fact that the elastic constant 𝐶11 is higher relative to 𝐶33 implies the degree of incompressibility in the a-direction exceeds that observed in the c-direction. From the value of bulk modulus obtained, ZnO is an incompressible compound with M-ZnO phase having the highest bulk modulus. This establishes M-ZnO as most resistant to external pressure compared to the other phases. The hardness of the compounds is indicated by the shear modulus that ranged between 40.9 GPa and 42.3 GPa with the highest hardness found in the W-ZnO (42.3 GPa) compound. From the results of Young’s modulus calculation, the W-ZnO are more elastic compared to C-ZnO and M-ZnO which are relatively stiffer. By use of equations 9-12, other fundamental elastic characteristics including the Poissons’ ratio
  , Pugh ratio (P), Kleinman parameter
  and Debye temperature, were calculated and presented in Table 3.
|
 and Debye temperature,
 | (9) |
 | (10) |
 | (11) |
 | (12) |
 is plank’s constant, k is Boltzmann’s constant, NA is Avogadro’s number, n is the number of atoms per formula unit, M is the molecular mass per formula unit,
  is the desity and Vm is obtained from equation 13.
 | (13) |
 | (14) |
 and E represent the poisons ratio and young’s modulus respectively. The structures in this study had hardness ranging from 3.7-4.1 with the highest hardness observed in the C-ZnO.The ductility of the tested compounds can be predicted from the results of Pugh’s and Poisson’s ratio [61]. If the Poisson’s ratio exceeds 0.26, the material is regarded ductile otherwise it is considered to be brittle [62]. Moreover, ductility is also implied if the Pugh’s ratio is above 1.75. As recorded in Table 3, the three ZnO crystal structures studied possess ductile nature considering their Pugh’s and Poisson’s ratio are above 1.75 and 0.26 respectively. The brittleness and ductility of a material can be determined by use of Cauchy pressure [63]. A negative value of Cauchy pressure is an indication of metallic bonding while a positive value implies great resistance to bond bending. The positive values of Cauchy pressure of the tested ZnO phases collaborate with the values of Poissons and Pugh ratio to confirm the ductility of the structures. Another critical mechanical aspect in material study is the Kleinman parameter. It outlines the simplicity of bond bending relative to bond stretching and ranges between 0 and 1 [64]. The analysis of the Kleinman parameter demonstrates that the bond stretching associated with M-ZnO is minimal. (0.66) and that of C-ZnO is the highest (0.78). It is observed that the Debye temperature varied with the crystal structure with M-ZnO exhibiting the highest (485.1 K). The machinability expressed as [65]
  is a criterion used to describe how ease a material can be cut by use of machine or any other tool in an engineering process. High machinability is an indication of hardness and more effort and time would be required to generate a fine surface [65]. In this work, W-ZnO possess the highest machinability index followed by M-ZnO and the lowest was in C-ZnO. Consequently, W-ZnO is implied to have the highest plastic, excellent lubricating aspects, lowest feed forces and reduced frictional value.
3.3. Anisotropic Elastic Properties
- The elastic anisotropy is a critical tool for evaluating the feasibility of introducing micro cracks in a material [66]. In this study, Zener anisotropic index (AZ), universal Zener anisotropic index (AU), and the equivalent Zener anisotropic index (Aeq) were calculated using equations 15-17 and recorded in Table 4.
 | (15) |
 | (16) |
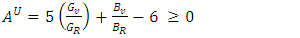 | (17) |
3.4. Electronic Properties
- The band structure and corresponding projected density of states (PDOS) were calculated in this study to give insights on the Energy band gap as presented in Figures 5 and 6. The dotted lines at 0 eV in these figures represents the Fermi energy level. By sampling the high symmetry points in the first Brillouin zone, the K points mesh for the electronic band structure calculations was optimized to a denser mesh. In this study, the band structures are depicted along the high symmetry points
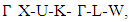
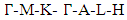 and
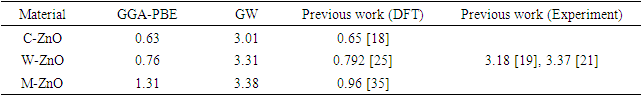
and  for the C-ZnO, W-ZnO and M-ZnO structures respectively. From the band structure calculations, direct band gaps of 0.63, 0.76 and 1.31 eV for the C-ZnO, W-ZnO and M-ZnO respectively were realized at Gamma. These energy band gaps corroborate with the findings of the PDOS presented in Figures 5. From the PDOS calculations, valence band is mainly dominated by the O-2s, Zn-3d and O-2p states. The Zn-4s and O-2p states contributes in to the conduction band of ZnO. The contribution of Zn-2s and Zn-2p orbitals is not well pronounced in both the valence band (VB) and conduction band (CB). Compared with the experimental results reported in Table 5, the band gaps from the DFT computations were severely underestimated. This results from the inadequacy of standard semi-local exchange correlation (XC) functionals to deal with the hybridization between the Zn-3d and O-2p shells. To correct this, GW approximation technique was employed and findings illustrated in Figure 6. From this figure, band gaps of 3.01, 3.31 and 3.38 eV were obtained for C-ZnO, W-ZnO and M-ZnO respectively. The correction using GW shifts the hybridized Zn-3d and O-2p state downwards while simultaneously shifting upward the Zn-4s state resulting into a widened band gap as shown in Table 5.
|
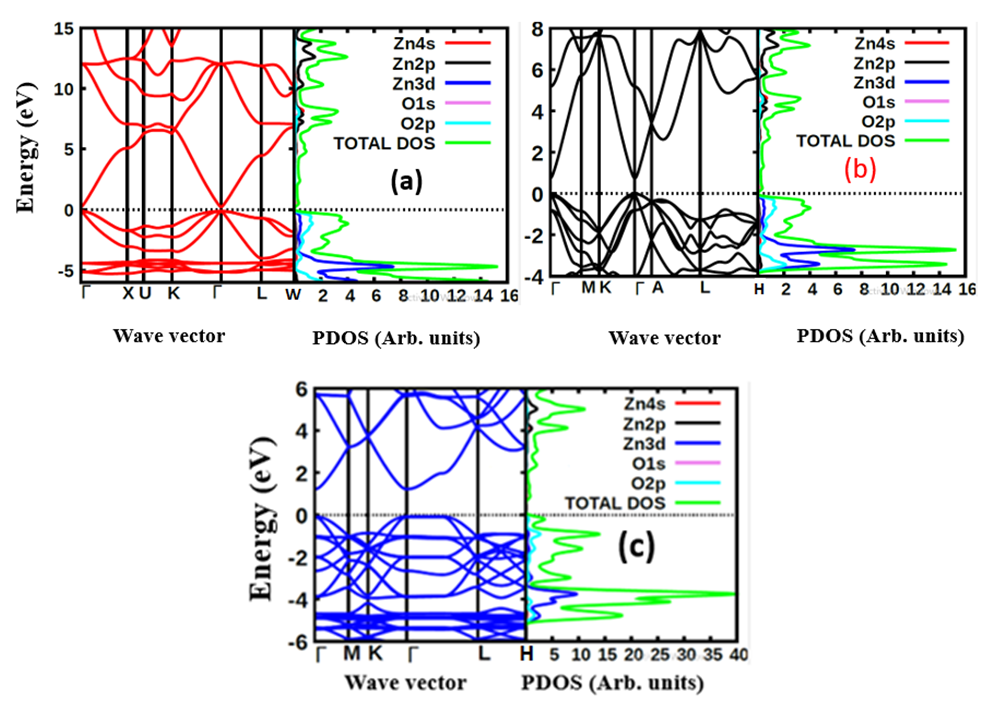 | Figure 5. The electronic band structure and PDOS of (a) C-ZnO, (b) W-ZnO and (c) M-ZnO structures using standard DFT |
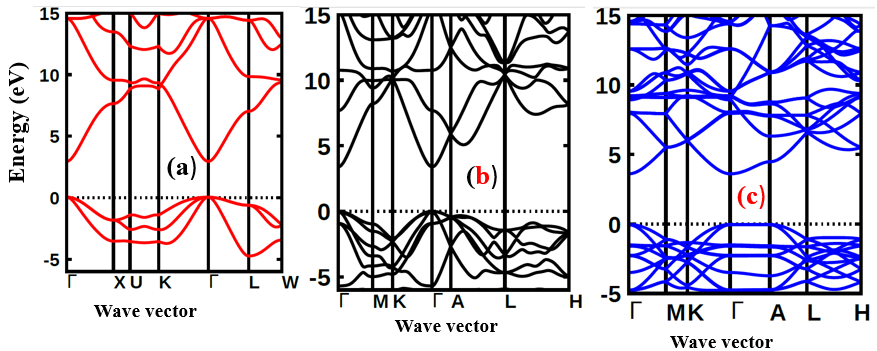 | Figure 6. The electronic band structure of (a) C-ZnO, (b) W-ZnO and (c) M-ZnO structures using GW |
3.5. Dynamical Stability
- To establish the dynamical stability of any compound, the phonon dispersion is a critical tool. The dynamical profiles imply dynamical stability if all the frequencies are positive and instability in the presence of negative frequencies. The computed phonon frequency profiles for the different ZnO phases are presented in Figure 7. These calculations were implemented by use of phonopy interfaced with quantum ESSPRESSO code. From Figure 7, the vibrational frequencies for all lattice phonon modes emerged positive confirming the dynamical stability of all the structures. The convergence of the profiles at the gamma points further indicates stability. The lack of fictitious frequencies indicates the validity of the lattice vibrations which does not lead to instability or material decay.
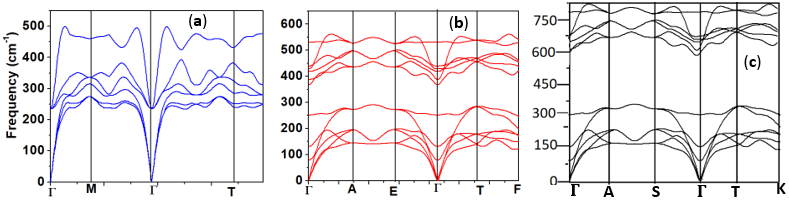 | Figure 7. Phonon dispersion for the (a) C-ZnO, (b) W-ZnO and (c) M-ZnO structures |
3.6. Electrical Conductivity
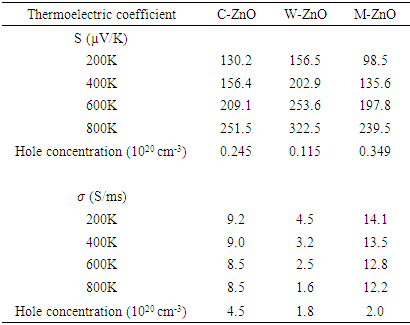
- The transport properties of a compound are a critical factor to consider in the choice of a good DSSC photoanode material. Compared with other metal oxide semiconductors used in DSSC, ZnO has an enhanced electrical conductivity and reduced resistivity [69-74]. In this study, the electrical conductivity of different phases of ZnO as a function of hole concentration is computed and compared. To validate our results, the seebeck coefficients are also reported so as to prove the inverse correlation of electrical conductivity coefficients and Seebeck coefficients [75]. The semi-classical Boltzmann transport equations with constant relaxation time approximation were solved to achieve these transport coefficients as executed in the BoltzTraP code [51]. The investigation was performed at four specific temperatures, that is, at 200K, 400K, 600K and 800K to Investigate the influence of temperature on the transport characteristics of ZnO. The seebeck coefficients and electrical conductivity coefficients of the P-type phases of ZnO computed in this study are presented in Figures 8 and 9 respectively, with the calculated values in Table 6.
|
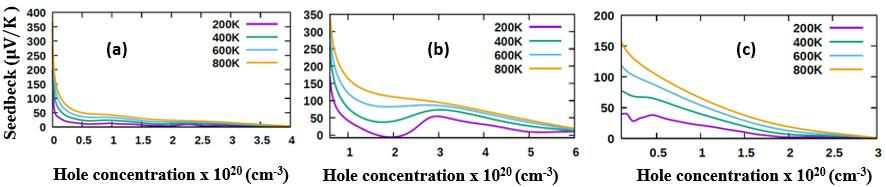 | Figure 8. Seebeck coefficient of (a) C-ZnO, (b) W-ZnO and (c) M-ZnO phases as a function of holes concentration |
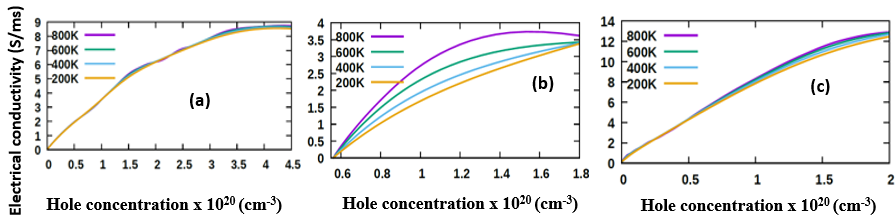 | Figure 9. Electrical conductivity of (a) C-ZnO, (b) W-ZnO and (c) M-ZnO phases as a function of holes concentration |
 at 800K for C-ZnO, W-ZnO and M-ZnO respectively as shown in Table 6. Among the three phases of ZnO tested, W-ZnO had the highest seebeck coefficient of 322.5
  at 800K depicting it as the best thermoelectric structure. Based on reports from previous studies, materials with seebeck coefficient above 200
  are considered good thermoelectric compounds [76-77]. The seebeck coefficient values obtained in this study were higher than 200
  ascertaining ZnO as viable thermoelectric compound.From Figure 9, the electrical conductivity of ZnO decreased with temperature confirming the inverse relation of seebeck coefficient and electrical conductivity. All the phases exhibited high electrical conductivity with M-ZnO depicting the highest (14.1 S/ms) while the W-ZnO had the lowest (4.5 S/ms) at 800K. When applied in DSSC, the high electrical conductivity of M-ZnO would suppress electron-hole recombination hence expected to enhance the solar cell performance. The absence of the negative hole concentrations in both seebeck and electrical conductivity calculations proves the p-type nature of Three phases of ZnO investigated in this work.
3.7. Optical Properties
- A suitable compound to be used in the DSSC photoanode should be chosen guided by its optical properties [78,79]. The optical properties of a material explain the frequency response of distinct optical parameters of that material to the energy of the incident photon,
 . The optical parameters in a material are determined by
  which is a complex dielectric function dependent on frequency.
  as expressed in the relation 20 [80].
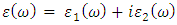 | (20) |
 and
and  are the real and complex parts respectively of the complex dielectric functions. While the real part, explains the photon dispersion and extent of material polarisation, the imaginary component describes the photon absorption of a material. Within the selection rules, calculations of the momentum matrix elements between unoccupied and occupied wavefunctions as given in equation 21 give the imaginary part
  [81].
[81]. | (21) |
 from
from  [75].
[75].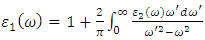 | (22) |
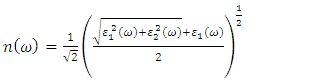
 , refractive index
  , energy loss spectrum
  , and reflectivity
  were obtained from
  and
and  as indicated in equations 23-26 respectively.
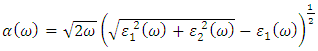 | (23) |
 | (24) |
 | (25) |
 | (26) |
 , as 4.7, 4.5 and 4.89 for C-ZnO, W-ZnO and M-ZnO structures respectively. The refractive indices were obtained by computing the square roots of these static dielectric values [38] and presented in Table 7. From this table, M-ZnO phase has the highest optical transparency as indicated by the values of
  as well as the refractive index
  . The imaginary spectrum defines the connection existing between the optical and electronic properties of a material [82]. Figure 10(b) presents
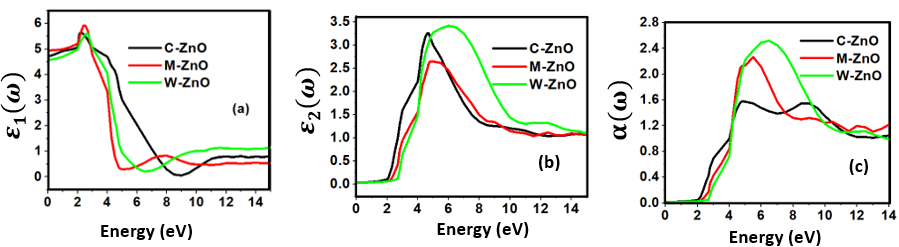
  as a function of energy from which the critical onset points are located at 3.0, 3.29 and 3.35 eV for C-ZnO, W-ZnO and M-ZnO structures respectively as tabulated in Table 7. These values agree with the energy band gaps obtained from band structure calculations. The peaks of the imaginary part of the dielectric function are associated with the electron excitation from one state to another. The main peaks observed in this study were located at 4.2, 6.1 and 5.5 eV for the C-ZnO, W-ZnO and M-ZnO respectively. These peaks relate to the electron transition between the Zn-3d ad O-2p states. The absorption coefficient informs on the decay of light intensity per unit distance in a material medium. It is greatly affected by the photon frequency implying that the incident photon interacts with material electrons resulting in inter-band electron transition from the valence band to conduction band. Figure 10(c) depicts a broad absorption spectrum of ZnO ranging from 3.01 eV to 14 eV which is majorly beyond the visible region of electromagnetic spectrum. Therefore, ZnO is indicated to be transparent to majority of the solar radiation as required in the photoanode of DSSCs. Consequently, ZnO is able to pass on light to the absorption dye for photoemission and hence current generation [83].
|
 refractive index (n), absorption coefficient
  and reflectivity (R) at 0 eV
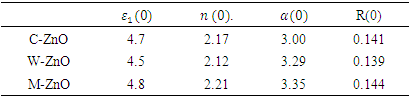
 | Figure 10. The (a) real part and (b) imaginary part of the dielectric constant, (c) absorption coefficient of C-ZnO, M-ZnO and W-ZnO phases |
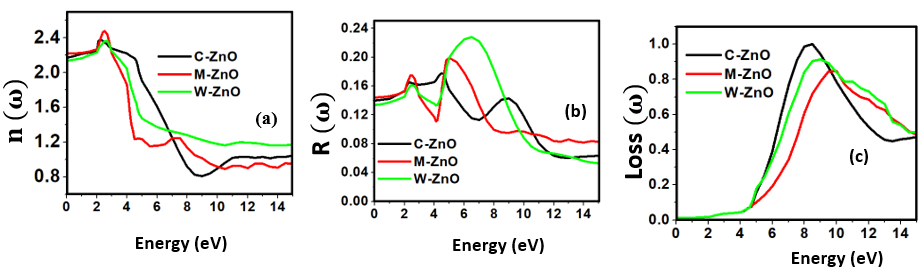 | Figure 11. The (a) refractive index, (b) reflectivity and (c) energy loss as a function of the energy in eV of C-ZnO, M-ZnO and W-ZnO phases |
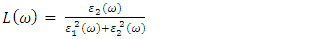
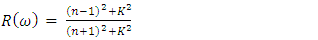
 were located at 2.176, 2.15 and 2.20 for the C-ZnO, M-ZnO and W-ZnO phases respectively. The material tested can therefore effectively bend and slow down light thereby improving the overall photon absorption when used as a DSSC photoanode. A significant decay in the dispersion curve of the refractive index was observed after the first peak indicating that beyond 3.2 eV photon energy, ZnO fails to maintain its transparent nature and instead absorbs such radiations. Reflectivity depicts the surface behavior of a material. Figure 11(b) shows a low reflectivity (R0) of 0.141, 0.139 and 1.42 at zero photon energy for the C-ZnO, W-ZnO and M-ZnO phases respectively as listed in Table 7. The least reflectivity (0.139) was observed in W-ZnO implying its least ability to reflect solar radiation but instead allow it to pass through for dye excitation in DSSC. From the plot, the highest peaks are observed at 5.0, 7.2 and 5.8 eV for the C-ZnO, W-ZnO and M-ZnO phases respectively after which the reflectivity rapidly dropped. Energy loss L (ω) is another vital parameter that characterizes the loss of energy of a fast-moving electron as it transverses a material medium. Figure 11(c) shows a near zero energy loss up to 4.0 eV in all the structures. At higher photon energy, the energy loss in ZnO gradually rises to a peak at 9.2 eV. The capability of ZnO within UV-Vis region to retain most of its energy with negligible energy loss to the surrounding as desired in DSSCs photoanode is therefore confirmed.
 4. Conclusions
- In summary, we have conducted a comparative analysis on the material properties of cubic, wurtzite and monolayer structures of ZnO, using the DFT technique as implemented in the Quantum Espresso code. This was with the aim of establishing the most suitable structure in the DSSC Photoanode application. GW approximations were used in the electronic and optical application rectify the inadequacies of standard DFT. The equilibrium lattice constants of 4.388
 for C-ZnO, 3.289
  for W-ZnO and 3.276
  for M-ZnO concur with other DFT findings and experimental results. A direct band gap at gamma point was obtained in all the structures with highest gap of 3.38 eV yielded by M-ZnO. The elastic constants calculated conformed to the stability criterion of cubic and hexagonal structures confirming mechanical stability of the ZnO tested. Optical absorption onsets were realized at 3.00 eV, 3.29 eV and 3.35 eV for the C-ZnO, W-ZnO and M-ZnO respectively. This is consistent with the energy band gap of ZnO which demonstrates ZnO as a transparent material in infra-red and visible light regions and only starts to absorb at UV region. Among the three structures tested, monolayer ZnO was observed to have the highest photon transparence, hence would allow more light to pass on to the dye for maximum absorption. Additionally, M-ZnO demonstrated highest electrical conductivity. All the structures revealed minimal energy loss in the solar radiation spectrum and hence light can easily transverse its structure. The properties examined in this study establishes the M-ZnO as the most appropriate structure for DSSC photoanode application.
Declaration of Competing Interest
- The authors declare the absence of any conflict of interests that may influence the accuracy of the data reported in this paper.
Data Availability
- Data will be made available on request.
ACKNOWLEDGEMENTS
- The authors gratefully appreciate the computational resources gracefully availed by the Centre of High-Performance Computing (CHPC) in Cape Town South Africa through MATS1181 project.
References
| [1] | Grätzel M. And O’Regan B. (1991). A low-cost, high-efficiency solar cell based on dye-sensitized colloidal TiO2 films, Nature, 353:737–740. |
| [2] | Duong, T. T., Choi, H. J., He, Q. J., Le, A. T., & Yoon, S. G. (2013). Enhancing the efficiency of dye sensitized solar cells with a SnO2 blocking layer grown by nanocluster deposition. Journal of Alloys and Compounds, 561, 206-210. |
| [3] | Xu, F., Zhang, X., Wu, Y., Wu, D., Gao, Z., & Jiang, K. (2013). Facile synthesis of TiO2 hierarchical microspheres assembled by ultrathin nanosheets for dye-sensitized solar cells. Journal of Alloys and Compounds, 574, 227-232. |
| [4] | Govindaraj R., Senthil M., Ramasamy P. and Mukhopadhyay S. (2014). Synthesis of titanium dioxide nanostructures and their effects on current-voltage (I-V) performance in dye sensitized solar cells, International Journal of Chem Tech Research, 6: 5220-5225. |
| [5] | Grätzel, M. (2003). Dye-sensitized solar cells. Journal of photochemistry and photobiology C: Photochemistry Reviews, 4(2), 145-153. |
| [6] | Kanimozhi, G., Vinoth, S., Kumar, H., Srinadhu, E. S., & Satyanarayana, N. (2018). A novel electrospun cobalt-doped zinc oxide nanofibers as photoanode for dye-sensitized solar cell. Materials Research Express, 6(2), 025041. |
| [7] | Huang, J., Yin, Z., & Zheng, Q. (2011). Applications of ZnO in organic and hybrid solar cells. Energy & Environmental Science, 4(10), 3861-3877. |
| [8] | Beek, W. J., Wienk, M. M., & Janssen, R. A. (2006). Hybrid solar cells from regioregularpolythiophene and ZnO nanoparticles. Advanced Functional Materials, 16(8), 1112-1116. |
| [9] | Zhang, Q., Dandeneau, C. S., Zhou, X., & Cao, G. (2009). ZnO nanostructures for dye-sensitized solar cells. Advanced materials, 21(41), 4087-4108. |
| [10] | Lin, C. Y., Lai, Y. H., Chen, H. W., Chen, J. G., Kung, C. W., Vittal, R., & Ho, K. C. Energy Environ. Sci. 4, 3448 (2011). |
| [11] | Lai, T. H., Tsang, S. W., Manders, J. R., Chen, S., & So, F. (2013). Properties of interlayer for organic photovoltaics. Materials Today, 16(11), 424-432. |
| [12] | M.Tan, M. J., Zhong, S., Li, J., Chen, Z., & Chen, W. (2013). Air-stable efficient inverted polymer solar cells using solution-processed nanocrystalline ZnO interfacial layer. ACS applied materials & interfaces, 5(11), 4696-4701. |
| [13] | Look, D. C., Reynolds, D. C., Sizelove, J. R., Jones, R. L., Litton, C. W., Cantwell, G., &Harsch, W. C. (1998). Electrical properties of bulk ZnO. Solid state communications, 105(6), 399-401. |
| [14] | Forro, L., Chauvet, O., Emin, D., Zuppiroli, L., Berger, H., & Levy, F. (1994). High mobility n-type charge carriers in large single crystals of anatase (TiO2). Journal of Applied Physics, 75(1), 633-635. |
| [15] | Wang, Z. L. (2004). Nanostructures of zinc oxide. Materials today, 7(6), 26-33. |
| [16] | Mahmoud, W. E. (2010). Synthesis and optical properties of Ce-doped ZnO hexagonal nanoplatelets. Journal of crystal growth, 312(21), 3075-3079. |
| [17] | Klingshirn, C. (2007). ZnO: material, physics and applications. ChemPhysChem, 8(6), 782-803. |
| [18] | Charifi, Z., Baaziz, H., & Hussain Reshak, A. (2007). Ab-initio investigation of structural, electronic and optical properties for three phases of ZnO compound. physica status solidi (b), 244(9), 3154-3167. |
| [19] | Ungula, J., Dejene, B. F., & Swart, H. C. (2018). Band gap engineering, enhanced morphology and photoluminescence of un-doped, Ga and/or Al-doped ZnO nanoparticles by reflux precipitation method. Journal of Luminescence, 195, 54-60. |
| [20] | Ungula, J. (2015). Growth and characterization of ZnO nanoparticles by sol-gel process (Doctoral dissertation, University of the Free State (Qwaqwa Campus)). |
| [21] | Dhamodharan, P., Manoharan, C., Bououdina, M., Venkadachalapathy, R., & Ramalingam, S. (2017). Al-doped ZnO thin films grown onto ITO substrates as photoanode in dye sensitized solar cell. Solar Energy, 141, 127-144. |
| [22] | Khuili, M., Fazouan, N., Abou El Makarim, H., El Halani, G., &Atmani, E. H. (2016). Comparative first principles study of ZnO doped with group III elements. Journal of Alloys and Compounds, 688, 368-375. |
| [23] | Qing, X., Zhang, C., Gong, J., & Chen, S. (2021). Ab initio study of photoelectric properties in ZnO transparent conductive oxide. Vacuum, 191, 110391. |
| [24] | Lei, X., Zhao, G. J., Liang, X. X., & Song, T. L. (2015 January). First-principle Studies of Lattice and Electronic Structure of BexZn1-xO. In Journal of Physics: Conference Series (Vol. 574, No. 1, p. 012049). IOP Publishing. |
| [25] | John, R., & Padmavathi, S. (2016). Ab initio calculations on structural, electronic and optical properties of ZnO in wurtzite phase. Crystal structure theory and applications, 5(02), 24. |
| [26] | Gopal, P., &Spaldin, N. A. (2006). Polarization, piezoelectric constants, and elastic constants of ZnO, MgO, and CdO. Journal of Electronic Materials, 35(4), 538-542. |
| [27] | Decremps, F., Pellicer-Porres, J., Datchi, F., Itié, J. P., Polian, A., Baudelet, F., & Jiang, J. Z. (2002). Trapping of cubic ZnO nanocrystallites at ambient conditions. Applied physics letters, 81(25), 4820-4822. |
| [28] | Kim, S. K., Jeong, S. Y., & Cho, C. R. (2003). Structural reconstruction of hexagonal to cubic ZnO films on Pt/Ti/SiO 2/Si substrate by annealing. Applied Physics Letters, 82(4), 562-564. |
| [29] | Haq, B. U., Ahmed, R., & Goumri-Said, S. (2014). DFT characterization of cadmium doped zinc oxide for photovoltaic and solar cell applications. Solar energy materials and solar cells, 130, 6-14. |
| [30] | Novoselov, K. S., Geim, A. K., Morozov, S. V., Jiang, D. E., Zhang, Y., Dubonos, S. V., ... & Firsov, A. A. (2004). Electric field effect in atomically thin carbon films. science, 306(5696), 666-669. |
| [31] | Ngumbi, P. K. (2021). Synthesis and Characterization of Graphene-Gold Nanocomposite Counter Electrodes for Dye-Sensitized Solar Cell Application (Doctoral dissertation, JKUAT-COPAS). |
| [32] | Muchuweni, E., Martincigh, B. S., & Nyamori, V. O. (2020). Recent advances in graphene-based materials for dye-sensitized solar cell fabrication. RSC advances, 10(72), 44453-44469. |
| [33] | Guo, X., Lu, G., & Chen, J. (2015). Graphene-based materials for photoanodes in dye-sensitized solar cells. Frontiers in Energy Research, 3, 50. |
| [34] | Mandal, P., Debbarma, J., & Saha, M. (2021). A review on the emergence of graphene in photovoltaics industry. Biointerface Res. Appl. Chem, 11(6), 15009-15036. |
| [35] | Farooq, R., Mahmood, T., Anwar, A. W., & Abbasi, G. N. (2016). First-principles calculation of electronic and optical properties of graphene like ZnO (G-ZnO). Superlattices and Microstructures, 90, 165-169. |
| [36] | Chen, Q., Wang, H., Luan, Q., Duan, R., Cao, X., Fang, Y., ... & Hu, X. (2020). Synergetic effects of defects and acid sites of 2D-ZnO photocatalysts on the photocatalytic performance. Journal of hazardous materials, 385, 121527. |
| [37] | Qin, Guoping, Xinqiang Wang, Ji Zheng, Chunyang Kong, and Bing Zeng. "First-principles investigation of the electronic and magnetic properties of ZnO nanosheet with intrinsic defects." Computational materials science 81 (2014): 259-263. |
| [38] | Tan, C., Sun, D., Xu, D., Tian, X., & Huang, Y. (2016). Tuning electronic structure and optical properties of ZnO monolayer by Cd doping. Ceramics International, 42(9), 10997-11002. |
| [39] | Namisi, M. M., Musembi, R. J., Mulwa, W. M., & Aduda, B. O. (2023). DFT study of cubic, tetragonal and trigonal structures of KGeCl3 perovskites for photovoltaic applications. Computational Condensed Matter, 34, e00772. |
| [40] | Allan, L., Mulwa, W. M., Musembi, R. J., &Aduda, B. O. (2022). First Principles Study of the Structural, Mechanical, Electronic, and Lattice Dynamical Properties of the Half-Heusler Alloys ZrCoY (Y= Sb, Bi). arXiv preprint arXiv:2204.03759. |
| [41] | Mulwa, W. M., Ouma, C. N., Onani, M. O., & Dejene, F. B. (2016). Energetic, electronic and optical properties of lanthanide doped TiO2: An ab initio LDA+ U study. Journal of Solid State Chemistry, 237, 129-137. |
| [42] | Friedrich, C., Müller, M. C., & Blügel, S. (2011). Band convergence and linearization error correction of all-electron GW calculations: The extreme case of zinc oxide. Physical Review B, 83(8), 081101. |
| [43] | Zhang, M., Ono, S., Nagatsuka, N., & Ohno, K. (2016). All-electron mixed basis G W calculations of TiO 2 and ZnO crystals. Physical Review B, 93(15), 155116. |
| [44] | Giannozzi, P., Baroni, S., Bonini, N., Calandra, M., Car, R., Cavazzoni, C., &Wentzcovitch, R. M. (2009). QUANTUM ESPRESSO: a modular and open-source software project for quantum simulations of materials. Journal of physics: Condensed matter, 21(39), 395502. |
| [45] | Perdew, J. P., Burke, K., & Ernzerhof, M. (1996). Generalized gradient approximation made simple. Physical review letters, 77(18), 3865. |
| [46] | Dal Corso, A. (2014). Pseudopotentials periodic table: From H to Pu. Computational Materials Science, 95, 337-350. |
| [47] | Monkhorst, H. J., & Pack, J. D. (1976). Special points for Brillouin-zone integrations. Physical review B, 13(12), 5188-5192. |
| [48] | Pfrommer, B. G., Côté, M., Louie, S. G., & Cohen, M. L. (1997). Relaxation of crystals with the quasi-Newton method. Journal of Computational Physics, 131(1), 233-240. |
| [49] | Tyuterev, V. G., & Vast, N. (2006). Murnaghan’s equation of state for the electronic ground state energy. Computational materials science, 38(2), 350-353. |
| [50] | Motornyi, O., Raynaud, M., Dal Corso, A., & Vast, N. (2018, December). Simulation of electron energy loss spectra with the turboEELS and thermo_pw codes. In Journal of Physics: Conference Series (Vol. 1136, No. 1, p. 012008). IOP Publishing. |
| [51] | Litim, D. F., & Manuel, C. (2002). Semi-classical transport theory for non-Abelian plasmas. Physics reports, 364(6), 451-539. |
| [52] | Madsen, G. K., & Singh, D. J. (2006). BoltzTraP. A code for calculating band-structure dependent quantities. Computer Physics Communications, 175(1), 67-71. |
| [53] | Momma, K., & Izumi, F. (2011). VESTA 3 for three-dimensional visualization of crystal, volumetric and morphology data. Journal of applied crystallography, 44(6), 1272-1276. |
| [54] | Thirika A.M., Mulwa W.M., Makau N.W., Bamidele I.A (2022) Ab Initio Study of Structural and Vibrational Properties of Fe2P-Type Materials for Near - Room - Temperature Refrigeration. International Journal of Physics, 2022, Vol. 10, No. 1, 49-58. |
| [55] | Voigt, W. J. T. L. (1928). A determination of the elastic constants for beta-quartz lehrbuch de kristallphysik. Terubner Leipzig, 40, 2856-2860. |
| [56] | Crosson, R. S., & Lin, J. W. (1971). Voigt and Reuss prediction of anisotropic elasticity of dunite. Journal of Geophysical Research, 76(2), 570-578. |
| [57] | Hill, R. (1952). The elastic behaviour of a crystalline aggregate. Proceedings of the Physical Society. Section A, 65(5), 349. |
| [58] | Tindibale, E., Mulwa, W. M., & Adetunji, B. I. (2024). Elastic anisotropy, mechanical, lattice dynamics, and electronic properties of MPdZ (M= Hf, Zr, Ti; Z= Sn, Ge, Si). DFT study. Computational Condensed Matter, 39, e00904. |
| [59] | Chirchir G.K, Mulwa W.M. Bamidele I.A (2022) Structural, Electronic and Mechanical Properties of Re Doped FeMnP0.67A0.33 (A=Ga and Ge): A DFT Study. International Journal of Physics, 2022, Vol. 10, No. 1, 70-78. |
| [60] | Miao, N., Sa, B., Zhou, J., & Sun, Z. (2011). Theoretical investigation on the transition-metal borides with Ta3B4-type structure: A class of hard and refractory materials. Computational materials science, 50(4), 1559-1566. |
| [61] | Pugh, S. F. (1954). XCII. Relations between the elastic moduli and the plastic properties of polycrystalline pure metals. The London, Edinburgh, and Dublin Philosophical Magazine and Journal of Science, 45(367), 823-843. |
| [62] | Frantsevich, I. N. (1982). Elastic constants and elastic moduli of metals and insulators. Reference book. |
| [63] | Thompson, R. P., & Clegg, W. J. (2018). Predicting whether a material is ductile or brittle. Current Opinion in Solid State and Materials Science, 22(3), 100-108. |
| [64] | Güler, E., & Güler, M. (2014). Phase transition and elasticity of gallium arsenide under pressure. Materials Research, 17, 1268-1272. |
| [65] | Naher, M. I., & Naqib, S. H. (2020). Structural, elastic, electronic, bonding, and optical properties of topological CaSn3 semimetal. Journal of Alloys and Compounds, 829, 154509. |
| [66] | Mitro, S. K., Hossain, K. M., Majumder, R., & Hasan, M. Z. (2021). Effect of the negative chemical pressure on physical properties of doped perovskite molybdates in the framework of DFT method. Journal of Alloys and Compounds, 854, 157088. |
| [67] | Mitro, S. K., Hossain, K. M., Majumder, R., & Hasan, M. Z. (2021). Effect of the negative chemical pressure on physical properties of doped perovskite molybdates in the framework of DFT method. Journal of Alloys and Compounds, 854, 157088. |
| [68] | Baranov, A. N., Kurakevych, O. O., Tafeenko, V. A., Sokolov, P. S., Panin, G. N., & Solozhenko, V. L. (2010). High-pressure synthesis and luminescent properties of cubic ZnO/MgO nanocomposites. Journal of applied physics, 107(7). |
| [69] | Wu, X., Wu, Z., Guo, L., Liu, C., Liu, J., Li, X., & Xu, H. (2005). Pressure-induced phase transformation in controlled shape ZnO nanorods. Solid State Communications, 135(11-12), 780-784. |
| [70] | Khuili, M., Fazouan, N., Abou El Makarim, H., Atmani, E. H., Rai, D. P., &Houmad, M. (2020). First-principles calculations of rare earth (RE= Tm, Yb, Ce) doped ZnO: Structural, optoelectronic, magnetic, and electrical properties. Vacuum, 181, 109603. |
| [71] | JemmyCinthia, A., Sudhapriyang, G., Rajeswarapalanichamy, R., & Santhosh, M. (2014). Structural, electronic and elastic properties of ZnO and CdO: a first-principles study. Procedia Materials Science, 5, 1034-1042. |
| [72] | Sarasamak, K., Limpijumnong, S., & Lambrecht, W. R. (2010). Pressure-dependent elastic constants and sound velocities of wurtzite SiC, GaN, InN, ZnO, and CdSe, and their relation to the high-pressure phase transition: A first-principles study. Physical Review B, 82(3), 035201. |
| [73] | Wang, F., Wu, J., Xia, C., Hu, C., Hu, C., Zhou, P., ... & Liu, X. (2014). Thermodynamic and elastic properties of hexagonal ZnO under high temperature. Journal of alloys and compounds, 597, 50-57. |
| [74] | Chatterjee, S., & Karki, I. B. (2019). Effect of Photoanodes on the Performance of Dye-Sensitized Solar Cells. Journal of the Institute of Engineering, 15(3). |
| [75] | Jantrasee, S., Moontragoon, P., & Pinitsoontorn, S. (2016). Thermoelectric properties of Al-doped ZnO: experiment and simulation. Journal of Semiconductors, 37(9), 092002. |
| [76] | Solola, G. T., Bamgbose, M. K., Adebambo, P. O., Ayedun, F., & Adebayo, G. A. (2023). First-principles investigations of structural, electronic, vibrational, and thermoelectric properties of half-Heusler VYGe (Y= Rh, Co, Ir) compounds. Computational Condensed Matter, e00827. |
| [77] | Bamgbose, M. K. (2021). First-principles study of electronic structure and thermoelectric properties of p-type XIrSb (X= Ti, Zr and Hf) half-Heusler compounds. Materials Science in Semiconductor Processing, 129, 105792. |
| [78] | Mitro, S. K., Hossain, K. M., Majumder, R., & Hasan, M. Z. (2021). Effect of the negative chemical pressure on physical properties of doped perovskite molybdates in the framework of DFT method. Journal of Alloys and Compounds, 854, 157088. |
| [79] | Knott, A., Liu, X., Makarovskiy, O., O’Shea, J., Tuck, C., & Wu, Y. (2019, February). Design and optical characterisation of an efficient light trapping structure for dye-sensitized solar cell integrated windows. In Building Simulation (Vol. 12, pp. 41-49). Tsinghua University Press. |
| [80] | Sun, J., Wang, H. T., He, J., & Tian, Y. (2005). Ab initio investigations of optical properties of the high-pressure phases of ZnO. Physical Review B, 71(12), 125132. |
| [81] | Azam, S., Irfan, M., Abbas, Z., Rani, M., Saleem, T., Younus, A., & Al-Sehemi, A. G. (2019). DFT study of the electronic and optical properties of ternary chalcogenides AlX2Te4. Materials Research Express, 6(11), 116314. |
| [82] | Vettumperumal, R., S. Kalyanaraman, and R. Thangavel. "Optical constants and near infrared emission of Er doped ZnO sol–gel thin films." Journal of Luminescence 158 (2015): 493-500. |
| [83] | Liu, Y., Hou, Q., Sha, S., & Xu, Z. (2020). Electronic structure, optical and ferromagnetic properties of ZnO co-doped with Ag and Co according to first-principles calculations. Vacuum, 173, 109127. |