American Journal of Materials Science

p-ISSN: 2162-9382    e-ISSN: 2162-8424

2024;  14(1): 12-20

doi:10.5923/j.materials.20241401.02

Received: Feb. 9, 2024; Accepted: Feb. 23, 2024; Published: Mar. 9, 2024


Effects of Growth Temperature on the Structural and Optical Properties of Synthesized Titanium Dioxide Nanoparticles

Gakuru Simon Waweru, Sharon Kiprotich, Peter Waithaka

Department of Physical and Biological Sciences, Murang’a University of Technology, Murang’a, Kenya

Correspondence to: Sharon Kiprotich, Department of Physical and Biological Sciences, Murang’a University of Technology, Murang’a, Kenya.

Email:

Copyright © 2024 The Author(s). Published by Scientific & Academic Publishing.

This work is licensed under the Creative Commons Attribution International License (CC BY).
http://creativecommons.org/licenses/by/4.0/

Abstract

The nanoparticles (NPs) of titanium dioxide (TiO2) were synthesized using sol-gel method. This method was preferred as it gives NPs with uniform particle size, surface properties, control of reaction time and temperature, easiness in operation and of low cost. The synthesized gel was annealed at different temperature for 2 h in a muffle furnace between temperature 400 and 900°C. Fourier Transform Infrared spectroscopy showed Ti-O-Ti stretching vibrations at wavenumber 668 and 1033 cm-1 and Ti-O at 435 and 416 cm-1 in line with the tetrahedral structure of TiO6. Structural properties were studied using X-ray diffraction (XRD) which displayed anatase and rutile phases with peaks 105 and 101 respectively. Change of phase from anatase to rutile occurred at 600°C characterized by peak 101. The crystallite size calculated using Debye-Scherrer equation is of the range between 10.83 to 23.90 nm for 400°C to 900°C respectively. Crystallite size was found to be directly proportional to XRD peak intensity and inversely proportional to Full Width at Half Maximum. Scanning Electron Microscope confirmed the improvement of the nanoparticles morphology with no agglomeration and aggregation at 800°C. Kubelka-Munk and Tauc equations were employed in the optical analysis and the optical band gap value reduced from 3.50 eV to 3.26 eV for 400°C and 900°C respectively.

Keywords: TiO2 NPs, Crystallite size, Band gap, Sol-gel, Structural Properties

Cite this paper: Gakuru Simon Waweru, Sharon Kiprotich, Peter Waithaka, Effects of Growth Temperature on the Structural and Optical Properties of Synthesized Titanium Dioxide Nanoparticles, American Journal of Materials Science, Vol. 14 No. 1, 2024, pp. 12-20. doi: 10.5923/j.materials.20241401.02.

1. Introduction

Titanium dioxide (TiO2) a white inorganic compound, is a naturally occurring oxide of titanium (Ti) a transition element with atomic number 22. Its outstanding non-toxic nature and stability [1] in terms of its opacity, electrical and physical properties, chemical structure and biocompatibilityhas made it toexcel in clusters such as biomedicine as anti-bacterial agents [2], photocatalysis [3,4,5], in dye sensitized solar cells (DSSC) as a photoanode and counter electrode [6], gas sensing, self- cleaning surfaces, water sputtering devices among other industrial applications [7]. The structure of TiO2 comprises of Ti-O-Ti stretching vibrations emanating from the TiO6 octahedral structure with different sharp orientations in edges and corners which gives it distinct properties including but not limited to specific surface area different phasestructureandcrystal size [8]. These features have caused the TiO2 to be termed as polymorphic existing in three phases that is brookite, rutile and anatase [9]. The structure of rutile and anatase is a tetragonal crystalline structure while brookite takes orthorhombic crystalline structure [9]. Anatase has a refractive index of 2.49 and density of 3.9g/cm3, while rutile has a refractive index of 2.61 and density of 4.3 g/cm3 and brookite having a refractive index of 2.58 and density 4.1 g/cm3 [10,11]. The most stable thermodynamic phase is rutile while brookite and anatase are metastable where when subjected to different conditions including but not limited to annealing temperature, readily transform to rutile phase [12]. Other conditions that transform the anatase and brookite phases include the type of starting materials, its composition and deposition method [13]. Brookite-anatase, anatase-rutile or brookite-anatase-rutile mixed forms are other phases that can be obtained inTiO2NPs [14].
When nanoparticles are to be applied key properties such as crystal phase, morphology and crystallite size are highly considered [15]. Therefore, in the application of TiO2 in solar cells and as a photocatalyst the polymorph that suits the above threshold is the anatase having an optical band gap (Eg) of 3.2eV. The Eg of brookite is found to be close to that of anatase showing potentiality of it being used as photocatalyst however, few reports have been made as its thermodynamic instability emanating from its metastable state makes it to be looked down upon; rutile has a band gap of 3.0 eV [16].
Hydrothermal, solvo-thermal, hydrolytic precipitation and sol-gel have been applied to synthesize desired TiO2 NPs [10]. NPs with uniform particle size, surface properties, control of reaction time and temperature, easiness in operation and cost of synthesis are the key features to be considered when choosing a synthesis method [17]. Sol-gel matches the entire threshold making it to be widely applied. Muaz et al [18] reported a slight transformation from anatase to rutile at 500°C when thin films of TiO2 were annealed at 300°C, 500°C for 1 hour. Bakri et al [19] reported phase transformation of anatase to rutile at temperature above 900°C after annealing thin films for 1 hour. According to M.K. Singh et al. [20] a phase transformation occurred at 800°C. Muthee and Dejene [10] reported that anatase phase occurred at 450°C, mixed-phase (anatase/rutile) at 550°C - 650°C and rutile phase at 750°C. This prompts out that annealing temperature influences TiO2 properties and that it needs to be investigated, analyzed and reported to help study its crystal size and structure, morphology, optical and photocatalytic activities. This study examines the effects of annealing temperature for 2 hours at (400, 500, 600, 700, 800, and 900°C) on the structural, optical and morphological properties for the synthesized TiO2 NPs using sol-gel synthesis method.

2. Methodology

2.1. Chemicals

Tetra isopropyl orthotitanate (C12H28O4Ti) of purity 99.9% used as a metal precursor supplied by Sigma-Aldrich, ethanol absolute (C2H5OH) of Purity 99.9% as a solvent precursor supplied by Sigma-Aldrich, di-ethanolamine ((CH2CH2OH)2NH) of purity 99.3% supplied by Sigma-Aldrich, deionized water (DI) (H2O), Ammonium hydroxide supplied by A.B.Chem.Co., ltd, Hydrochloric acid of supplied by A.B.Chem.Co., ltd. All reagents were of pure analytical grade and used as received from the manufacturer.

2.2. Synthesis Procedure

Sol-gel synthesis method was employed to prepare TiO2 NPs by adding 6mL of isopropyl orthotitanate (TIP) to 24 mL of ethanol in a clean 50 mL glass beaker placed on top of a magnetic stirrer at room temperature and stirred continuously for 30 min. Thereafter, its pH was adjusted to pH 7 using stock solution of HCl or NH4OH with the help of a pH meter and the homogenous solution stirred for further 15 min. The contents were transferred to a hot magnetic stirrer where 6mL of diethanolamine was added drop wise to the solution and stirred for further 45 min where it will have formed the gel. The gel was dried in the oven at 100°C for 2h to evaporate the residual solvents. The formed gel was left to age for at least 12hours thereafter combusted and annealed at different temperature of 400, 500, 600, 700, 800, 900°C for 2 h. The annealed NPs were ground into a fine NPs using a mortar and stored in a sample holder for further analysis.

2.3. Characterization of the Samples

X-Ray diffractometer (XRD) measurements were made using ARL EQUINOX 100 at 40V, 0.9mA, at a scanning range of 20°-100° to obtain the crystal structure and the phase content of the synthesised TiO2 NPs. The data obtained from the sample series was plotted, analysed and compared with the data base in Cambridge crystallographic data and the crystal sizes computed using Debye-Scherer’s equation. Surface morphology and composition of the TiO2 NPs were analyzed using Tescan Vega 3 scanning electron microscope (SEM). A double beam UV-Vis 1800 Shimadzu model was used to analyze optical properties at a wavelength ranging 200 nm to 1100 nm at a fast scanning speed; Kubelka- Munk and Tauc equations were employed in the analysis. Fourier Transform Infrared spectrophotometer IR Spirit Shimadzu model was used to analyze the functional groups present in the samples.

3. Results and Discussion

3.1. FTIR Analysis

Figure 1 shows Infrared spectroscopy analysis for stretching and bending vibrations of the present functional groups in TiO2 NPs obtained in the range of 400-4000 cm-1. The infrared spectroscopy shows main bands both at the finger print region and functional group region (435, 416, 668, 1033 and 2360 cm-1). The pronounced stretching vibration at 668 and 1033 cm-1 is assigned to Ti-O-Ti stretching vibrations of TiO6 where it increased as the annealing temperature increased [21,22] while 416 cm-1 and 435 cm-1 are related to Ti-O vibration [23]. The stretched vibration of –OH including Ti-OH absorption band were assigned to 2360 cm-1 stretching present in the functional group band [24]. FTIR spectra confirm presence of vital functional groups of TiO2 NPs that is Ti-O and Ti-O-Ti associated with bending from the tetrahedral structure in both anatase and rutile. The pronounced –OH at 2360cm-1 is associated with the solvent precursor ethanol, diethanolamine, and titaniaorthotitanate forming Ti-OH stretching. Angular vibration are also witnessed between 400-500 cm-1, 1300 to 2100 cm-1, 3450-4000 cm-1 making it hard for a number of peaks less easily spotted such as stretching and bending vibrations of -CH2and -NH which are present but their bands are not so pronounced both of which are from diethanolamine (DEA).The stretching vibration -CH2 and –NH occur in the range 2800- 3000 cm-1 and 300-3500cm-1 respectively [42,43]. However, the corresponding stretching vibration in the spectra is diminished which could be attributed to combustion of the gel during annealing process.
Figure 1. FTIR spectra showing the effects of annealing temperature on the functional groups of TiO2 NPs

3.2. XRD Analysis

Figure 2 shows the X-ray diffraction (XRD) patterns in the range of 20°-100° of TiO2 NPs annealed at different temperature: 400, 500, 600, 700, 800 and 900°C. Total change of phase from anatase to rutile phase occurred at 600°C.
Figure 2. XRD patterns for TiO2 NPs (a) merged overlaid and (b) stacked graphs for samples annealed at various temperatures
The phase content of anatase and rutile was obtained using Eqs (1) and (2) [25]
(1)
(2)
Where IA and IR represent intensity of the anatase and rutile phases.
The most intense peak of anatase and rutile were used to calculate mole ratio between the two phases i.e. anatase and rutile using Spurr and Myers Eqs (3) and (4) [26].
(3)
(4)
Where IA and WA represent the intensity and mole fraction of the Anatase phase while IR and WR are the intensity and mole fraction of the Rutile phase respectively.
In comparison of the two methods as shown in figure 3 (a) and (b), the effects of annealing temperature shows a reciprocal of each phase with similar trends of increase in both phase content and mole fraction in rutile phase and a similar trend of decrease in phase content and mole fraction in the anatase phase [27]. This confirms transformation of TiO2 from the decreasing phase of anatase to an increasing phase of rutile [28]. In figure 3 (a) both phase content and mole fraction of the anatase phase appear to decrease with increasing annealing temperature for which at temperature above 700°C their values are close to zero suggesting that at high temperature above 700°C anatase phase is completely transformed to rutile. In figure 3 (b) Phase content and mole fraction appears to be constant below 500°C annealing temperature and during transformation at temperature above 500°C it increases and after rutilation has occurred becomes constant suggesting that rutilation starts to happen at temperature above 500°C and at around 700°C transformation to rutile has occurred confirming visible rutile peaks of (101) at 600°C in the analyzed samples.
Figure 3. Graphical representation of phase content/mole fraction of TiO2 NPs for (a) anatase phase and (b) rutile phase annealed at different annealing temperature
Debye-Scherrer [29] Eq (5) was used to estimate the average crystal size (D) of the TiO2 NPs
(5)
Where 
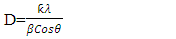
is the shape constant (0.9), is the X-ray wavelength 
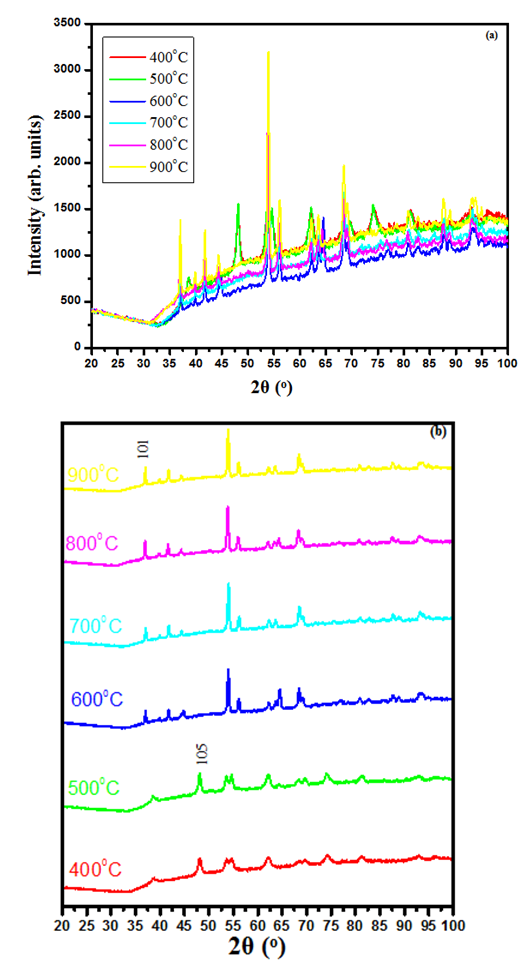
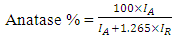
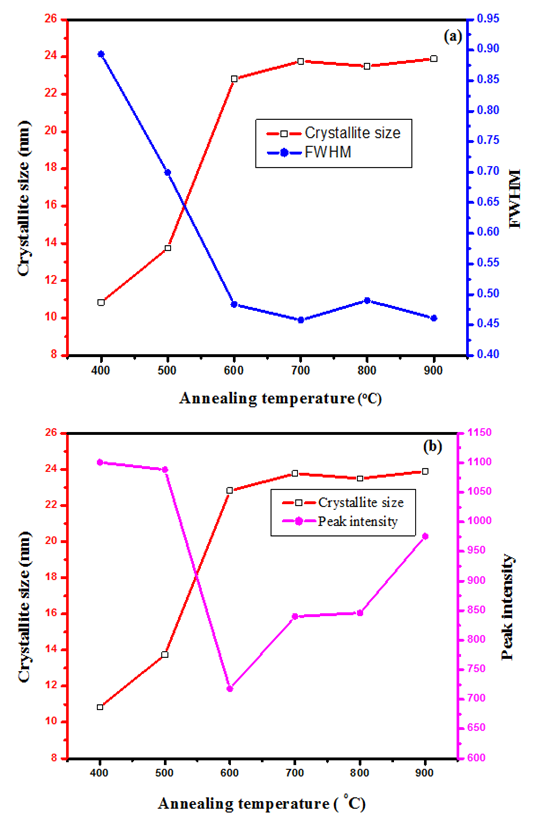
represents the full width at half maximum and θ is the Bragg’s angle in degrees.
As depicted in Figure 4(a) average crystallite sizes in (nm) are inversely proportional to their corresponding FWHM values which both appear to be constant at high temperature. Figure 4 (b) shows peak intensity vs crystallite size where the peak intensity in the anatase phase is found to decrease and their crystal size increase as the annealing temperature increases from 400 to 500°C, this is attributed to transformation and phase transition or coexistence with amorphous phase [30]. The peak intensity in the rutile phase increases as the annealing temperature increases due to formation of a more thermodynamic stable phase. This generally indicates improved crystal quality at high temperature; growth temperature rearranges the atoms which in turn increases their particle size [30]. A joint variation was deduced between FWHM, peak intensity and crystallite size where crystallite size is directly proportional to peak intensity and inversely proportional to its corresponding FWHM [10]: Crystal size .
Figure 4. Plot showing comparison on the (a) FWHM and (b) peak intensity with crystallite size of TiO2 NPs as the annealing temperature is varied
The difference in the rutile and anatase phase crystallite sizes proponents that nucleation and growth of the rutile phase was initiated between 500°C and 700°C. Apparently, high surface area energy contributes to low rate transformation from anatase to rutile [31] and transformation of phases occurs between 600°C to 900°C. In this study, complete elimination of anatase phase to rutile phase occurred at 700°C. It was also noted that the growth rate of particles differed when at low temperature and at high temperature. Slow growth rate was observed at lower temperature for which the rate increased at higher temperature. This is attributed by high activation energy at low temperature reducing its growth rate and low initiation energy at higher temperature increasing its growth rate [32].
As attributed, specific surface area (SSA) contributes to low anatase –rutile transformation. SSA was calculated by considering the total area covered by the crystals in unit mass [33] using Eq 6
(6)
Where 
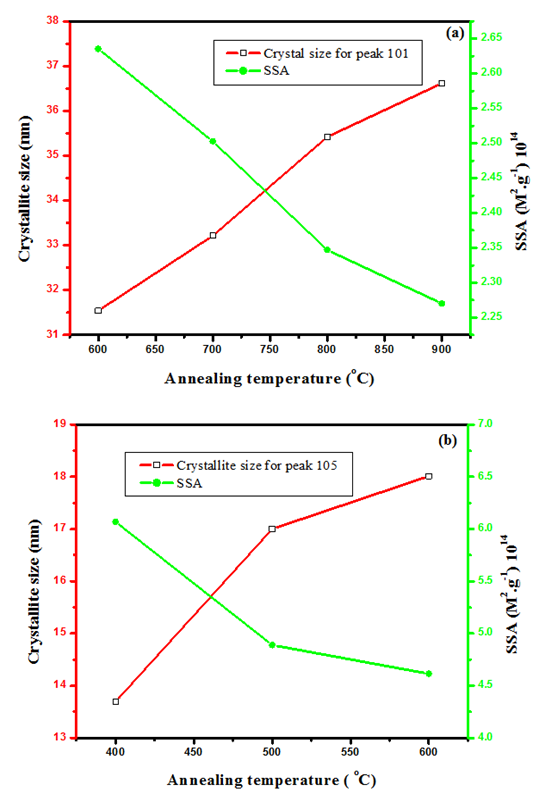
is the density of TiO2 NPs (4.23g/cm3) and Dp denoted the crystal size obtained by the Debye – scherrer equation [29]. The crystallographic defects or irregularities formed during crystal formation give rise to dislocations. Therefore, dislocation density is the length of the dislocation lines per unit volume of the materials crystal calculated using [34] Eq 7
(7)
Crystallite per unit surface area (N) was determined using [35]
(8)
Where D is the size of the NPs while d is the inter-planar spacing between the atoms.
Figure 5 shows that for both (a) anatase peak (105) and (b) rutile peak (101) SSA decreased as the annealing temperature was increased. SSA for anatase (105) shifted from 6.726×10¹⁴ M2.g-1 to 4.612× 10¹⁴ M2.g-1 and for rutile peak (101) from 2.6135× 10¹⁴ M2.g-1 to 2.2695× 10¹⁴ M2.g-1. This shows that crystallite size is inversely proportional to SSA for both the anatase and rutile peaks. TiO2 generally has a low SSA [44].
Figure 5. graph showing effects of annealing temperature on SSA and crystal size for (a) rutile peak (101) and (b) anatase peak (105)
Higher surface area provides more active sites and surfaces for the reactants playing a vital role in increasing catalytic reactions, surface reactivity, photocatalytic efficiency, adsorption capacity, electrochemical performance and creation of surface defects and states [45]. Consequently, extremely high SSA leads to increased recombination rate of charge carriers prompting optimal SSA as akey factor in applications such as photocatalysis, photo-electrochemical cells among other applications. In line with TiO2 applications and specifically as a photoanode, increase in SSA increases recombination rate. Minimizing surface related recombination rate helps improve the overall efficiency of the photoanode provided factors like band structure, charge transport and stability are optimized. Increase in annealing temperature is found to help reduce recombination rate and improving the optical properties of TiO2.
The values of strain were estimated using Eq 9
(9)
Where θ is the diffraction angle and β is the FWHM.
Figure 6. A graph showing the effects of annealing temperature on crystal size and strain of TiO2 NPs
An inverse variation of crystallite size with strain is observed as a function of annealing temperature. As the annealing temperature increases the strain of the NPs decreases and appears to be constant as the crystal size becomes relatively constant.

3.3. Morphological Analysis

Figure 7(a) to (d) shows SEM images of TiO2 NPs annealed at different temperature of 400°C, 500°C, 600°C and 800°C providing insights into their morphological changes. According to figure 7(a) TiO2 NPs annealed at 400°C shows presence of primary particles of grains that are very small in size (nanometer) and as the annealing temperature increases agglomeration and aggregation is inevitable being more pronounced at 800°C where it shows an increased grain size.
In comparison to figure 7 (a), (b), (c) and (d) sintering and coarsening took place as a result of thermal treatment offering a glimpse into the dynamic rearrangement of NPs; increase in the annealing temperature made the adjacent particles coalesce and the large particles to grow at the expense of the smaller particles [31]. Figure 7(a) shows some nucleation on primary particles reducing its texture which are absent at figure 7(d) which is as a result of sintering and coalescing where the large crystalline structures tends to fill in the interstitial spaces, surface porosity decreased as the void spaces between the particles became more densely packed forming a more compact structure. This shows that, as the annealing temperature increases and precisely at around 600°C, the nucleation that was observed at 400°C sintered and coalesced leading to a smoother surface with no deposits on the surface of the crystals. Uniform grain distribution with a higher clarity and connections is observed as the annealing temperature increases as shown in figure 7(d).
Figure 7. Representative SEM images of NPs annealed at (a) 400°C, (b) 500°C, (c) 600°C and (d) 800°C
The agglomeration formed resulted from overlapping of the smaller and medium particles. This overlap were caused by lack of water on the surface structure, soft agglomerates from the weak surface and hard agglomerates from strong chemical bond (10).

3.4. Optical Analyses

The reflectance spectra for NPs annealed at different temperature are depicted in figure 8(a) between the ranges of 200 nm to 1100 nm. TiO2 NPs annealed at 400°C had the highest reflectance of 85.26% while that annealed at 700°C had the least reflectance of 23.38%. Band gap energy (Eg) was estimated using the Kubelka- Munk formula Eq 10 [37] where (F(R)) is the Kubelka-Munk function and ∞ denotes sufficient thickness of the sample layer that is thick enough to completely hide the support for which the desired material is placed and deposited
(10)
Where (k) is the absorption coefficient (m-1), (s) is the scattering coefficient (m-1).
The plot of (F(R)hv)1/2 with photon energy (hv) as shown in figure 8(b) was used to get the estimated band gap; From Tauc equation Eq 11 [38]
(11)
Where 
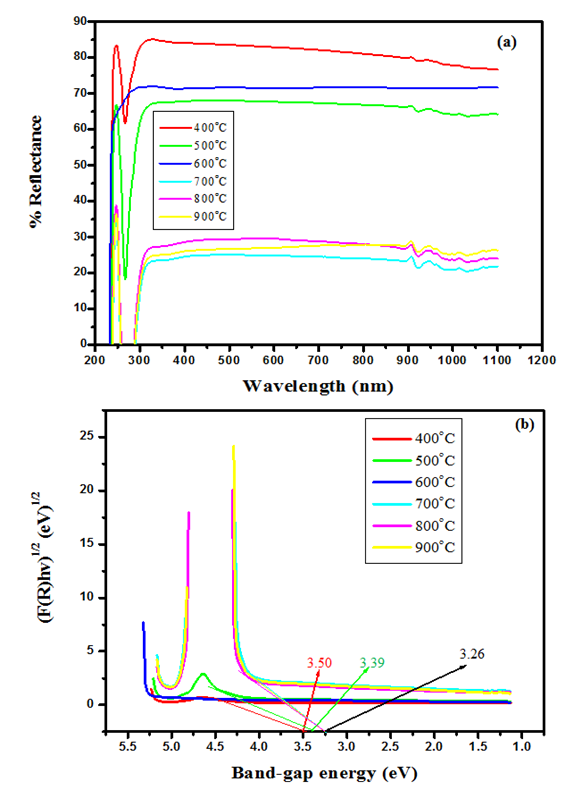
is the linear absorption coefficient, hv is the photon energy, Eg the separation gap between conduction band and valence band and is a constant which depends on the probability of transition; it takes values such as 2 and 3 for indirect allowed, indirect forbidden, direct allowed and direct forbidden transitions respectively [39].
Replacing with Kubelka function F(R∞) (Eq 12)
(12)
For purposes of optical analysis of this study of indirect transition was used as it gave good aquasi. From Eq 12 which corresponds to a linear equation y = mx+c where when extrapolating of the aquasi line to zero absorption coefficient the x intercept gives an estimate value of the band gap(Eg) value. Increased crystal size gives smaller band gap therefore as the annealing temperature increases the crystal size increased resulting in a decreased band gap [40]. The estimated band gap ranges from 3.26 to 3.50 eV; rutile phase has a lower optical band gap as compared to anatase in line with other works [41].
Figure 8. Graph showing (a) reflectance spectra and (b) band gap plot for TiO2 prepared at different annealing temperature

4. Conclusions

In summary, the structural, morphological and optical properties of TiO2 NPs synthesized by sol- gel method were greatly influenced by the increasing annealing temperature. FTIR showed in the finger print region four stretching modes at 1033 and 668 cm-1 associated with Ti-O-Ti and other stretching associated with Ti-O at 435 and 416 cm-1. Other stretching modes were noted in the functional group associated with Ti-OH associated with the bonds formed with the solvent precursor. XRD analysis displayed presence of rutile phase and anatase phase. The anatase phase was found to end at 500°C with the depletion of the peak 105 for TiO2 NPs annealed at 600°C. Phase content and mole fraction were found to decrease in the anatase phase and increase in the rutile phase. Similarly crystallite size was found to decrease in anatase phase and increase in rutile phase. Crystallite size increased with a consequential decrease in strain as the annealing temperature increased. SEM analysis showed that the surface morphology of the TiO2 improved as the annealing temperature increased with no agglomeration and aggregation at 800°C. Optical analysis depicted that the Eg reduced from 3.50 eV to 3.26 eV. The high band gap of 3.5 eV confirms that the anatase phase has a higher optical value compared to the 3.26eV of the rutile phase. The reduced band gap energies at raised annealing temperature confirm the increase in grains as observed in SEM images and XRD crystals sizes. The study confirms that higher annealing temperature yields larger crystal sizes that influence the nanomaterials properties.

ACKNOWLEDGEMENTS

This research has been successful through the support received from African AI Research grant Award: DSA and Deep Learning Indaba. The authors wish to thank this team and Murang’a University of Technology for giving us access to various synthesis and characterization techniques for the research.

Declaration of Conflict of Interest

The authors have no conflict of interest to declare.

References

[1]  deDicastillo, C. L., Correa, M. G., Martínez, F. B., Streitt, C., & Galotto, M. J. (2020). Antimicrobial effect of titanium dioxide nanoparticles. Antimicrobial Resistance-A One Health Perspective.
[2]  Ilyas, M., Waris, A., Khan, A. U., Zamel, D., Yar, L., Baset, A., & Ahmad, A. (2021). Biological synthesis of titanium dioxide nanoparticles from plants and microorganisms and their potential biomedical applications. Inorganic Chemistry Communications, 133, 108968.
[3]  Armaković, S. J., Savanović, M. M., &Armaković, S. (2022). Titanium dioxide as the most used photocatalyst for water purification: An overview. Catalysts, 13(1), 26.
[4]  Jaison, A., Mohan, A., & Lee, Y. C. (2023). Recent Developments in Photocatalytic Nanotechnology for Purifying Air Polluted with Volatile Organic Compounds: Effect of Operating Parameters and Catalyst Deactivation. Catalysts, 13(2), 407.
[5]  Lavino, S. (2023). Characterization of titanium dioxide coatings for self-cleaning surfaces.
[6]  Younas, M., Gondal, M. A., Dastageer, M. A., & Harrabi, K. (2019). Efficient and cost-effective dye-sensitized solar cells using MWCNT-TiO2 nanocomposite as photoanode and MWCNT as Pt-free counter electrode. Solar Energy, 188, 1178-1188.
[7]  Padmanabhan, N. T., & John, H. (2020). Titanium dioxide based self-cleaning smart surfaces: A short review. Journal of Environmental Chemical Engineering, 8(5), 104211.
[8]  Hiroi, Z. (2022). Inorganic structural chemistry of titanium dioxide polymorphs. Inorganic Chemistry, 61(22), 8393-8401.
[9]  Eddy, D. R., Permana, M. D., Sakti, L. K., Sheha, G. A. N., Solihudin, Hidayat, S., ... &Rahayu, I. (2023). Heterophase polymorph of TiO2 (Anatase, Rutile, Brookite, TiO2 (B)) for efficient photocatalyst: fabrication and activity. Nanomaterials, 13(4), 704.
[10]  Muthee, D. K., &Dejene, B. F. (2021). Effect of annealing temperature on structural, optical, and photocatalytic properties of titanium dioxide nanoparticles. Heliyon, 7(6), e07269.
[11]  Muthee, D. K., &Dejene, B. F. (2020). The effect of tetra isopropyl orthotitanate (TIP) concentration on structural, and luminescence properties of titanium dioxide nanoparticles prepared by sol-gel method. Materials Science in Semiconductor Processing, 106, 104783.
[12]  Byrne, C. (2019). Anatase to rutile transition in titanium dioxide photocatalytic nanomaterials (Doctoral dissertation, Institute of Technology, Sligo).
[13]  Bakri, A. S., Sahdan, M. Z., Adriyanto, F., Raship, N. A., Said, N. D. M., Abdullah, S. A., & Rahim, M. S. (2017, January). Effect of annealing temperature of titanium dioxide thin films on structural and electrical properties. In AIP conference proceedings (Vol. 1788, No. 1). AIP Publishing.
[14]  Borisov, S. V., Magarill, S. A., &Pervukhina, N. V. (2019). Crystallographic Analysis of TiO 2 Polymorphism (Brookite, Anatase, Rutile). journal of structural chemistry, 60, 1783-1789.
[15]  Reghunath, S., Pinheiro, D., & KR, S. D. (2021). A review of hierarchical nanostructures of TiO2: Advances and applications. Applied Surface Science Advances, 3, 100063.
[16]  Žerjav, G., Žižek, K., Zavašnik, J., & Pintar, A. (2022). Brookite vs. rutile vs. anatase: Whats behind their various photocatalytic activities?. Journal of Environmental Chemical Engineering, 10(3), 107722.
[17]  Sajid, M., &Płotka-Wasylka, J. (2020). Nanoparticles: Synthesis, characteristics, and applications in analytical and other sciences. Microchemical Journal, 154, 104623.
[18]  A.K.M. Muaz, U. Hashim, M.K.M. Arshad, A.R. Ruslinda, R. Ayub, S.C.B. Gopinath, Effect of Annealing Temperature on Structural, Morphological and Electrical Properties of Nanoparticles TiO2 Thin Films by Sol-Gel Method. Presented at the International Conference on Nano-Electronic Technology Devices and Materials, 2015.
[19]  A.S. Bakri, M.Z. Sahdan, F. Adriyanto, N.A. Raship, N.D.M. Said, S.A. Abdullah, M.S. Rahim, Effect of annealing temperature of titanium dioxide thin films on structural and electrical properties, American Institute of Physic. 30030 (2017) 1788–1798.
[20]  M. Kumar Singh, M. Singh Mehata, Phase-dependent optical and photocatalytic performance of synthesized titanium dioxide (TiO2) nanoparticles, Optik-International Journal of Light Electronics and Optics. 163011 (2019) 193–204.
[21]  Pekov, I. V., Zubkova, N. V., Chukanov, N. V., Yapaskurt, V. O., Turchkova, A. G., Ksenofontov, D. A., &Pushcharovsky, D. Y. (2022). Natisite, Na2TiSiO5, an Indicator Mineral of Hyperagpaitic Hydrothermal Assemblages in the Lovozero and Khibiny Alkaline Plutons, Kola Peninsula: Occurrence, Crystal Chemistry, and Genetic Features. Geology of Ore Deposits, 64(7), 452-469.
[22]  Solano Pizarro, R. A., & Herrera Barros, A. P. (2020). Cypermethrin elimination using Fe-TiO2 nanoparticles supported on coconut palm spathe in a solar flat plate photoreactor. Advanced Composites Letters, 29, 2633366X20906164.
[23]  RAGU, S., Cho, S., Waqar, A., Ishfaque, A., Choi, D., & Kim, B. Microcrack-Assisted Piezoelectric Acoustic Sensor Based on F-Mwcnts/Batio3@ Pdms Nanocomposite and its Self-Powered Voice Recognition Applications. Available at SSRN 4549162.
[24]  Husna, R. A., Suherman, S., & Natsir, T. A. (2023). Effect of Calcination Temperature on the Preparation of Mixed Oxide SnO2/CeO2/TiO2 to Increase the Photodegradation Activity of Methylene Blue under Visible Light. Key Engineering Materials, 949, 75-80.
[25]  Saikumari, N., Dev, S. M., &Dev, S. A. (2021). Effect of calcination temperature on the properties and applications of bio extract mediated titanianano particles. Scientific Reports, 11(1), 1734.
[26]  Turkten, N., Karatas, Y., Uyguner-Demirel, C. S., &Bekbolet, M. (2023). Preparation of PANI modified TiO2 and characterization under pre-and post-photocatalytic conditions. Environmental Science and Pollution Research, 1-26.
[27]  Subasinghe, H. C. S., &Ratnayake, A. S. (2021). Processing of ilmenite into synthetic rutile using ball milling induced sulphurisation and carbothermic reduction. Minerals Engineering, 173, 107197.
[28]  Anitha, B., &Khadar, M. A. (2020). Anatase-rutile phase transformation and photocatalysis in peroxide gel route prepared TiO2 nanocrystals: Role of defect states. Solid State Sciences, 108, 106392.
[29]  Mustapha, S., Tijani, J. O., Ndamitso, M. M., Abdulkareem, A. S., Shuaib, D. T., Amigun, A. T., &Abubakar, H. L. (2021). Facile synthesis and characterization of TiO2 nanoparticles: X-ray peak profile analysis using Williamson–Hall and Debye–Scherrer methods. International Nano Letters, 11(3), 241-261.
[30]  El-Saady, A. A., Farag, A. A. M., Basset, D. M. A., Roushdy, N., & El-Nahass, M. M. (2023). Tailoring the optoelectronic properties of nanocrystalline β-H2Pc films via thermal annealing: Structural, morphological, and optical analyses. Physica B: Condensed Matter, 669, 415339.
[31]  Fu, F., Zhang, Y., Zhang, Y., & Chen, Y. (2021). Synthesis of Mn-doped and anatase/rutile mixed-phase TiO 2 nanofibers for high photoactivity performance. Catalysis Science & Technology, 11(12), 4181-4195.
[32]  Song, J. J., Deng, J., Zhao, J. Y., Zhang, Y. N., &Shu, C. M. (2021). Comparative analysis of exothermic behaviour of fresh and weathered coal during low-temperature oxidation. Fuel, 289, 119942.
[33]  Sivkov, A., Vympina, Y., Ivashutenko, A., Rakhmatullin, I., Shanenkova, Y., Nikitin, D., &Shanenkov, I. (2022). Plasma dynamic synthesis of highly defective fine titanium dioxide with tunable phase composition. Ceramics International, 48(8), 10862-10873.
[34]  Yuan, S., Zhu, Y., Huang, M., Liang, S., & Li, Z. (2020). Dislocation-density based crystal plasticity model with hydrogen-enhanced localized plasticity in polycrystalline face-centered cubic metals. Mechanics of Materials, 148, 103472.
[35]  Devesa, S., Rooney, A. P., Graça, M. P., Cooper, D., & Costa, L. C. (2021). Williamson-hall analysis in estimation of crystallite size and lattice strain in Bi1. 34Fe0. 66Nb1. 34O6. 35 prepared by the sol-gel method. Materials Science and Engineering: B, 263, 114830.
[36]  Zhou, X., Shao, C., Li, X., Wang, X., Guo, X., & Liu, Y. (2018). Three dimensional hierarchical heterostructures of g-C3N4 nanosheets/TiO2 nanofibers: controllable growth via gas-solid reaction and enhanced photocatalytic activity under visible light. Journal of hazardous materials, 344, 113-122.
[37]  LandiJr, S., Segundo, I. R., Freitas, E., Vasilevskiy, M., Carneiro, J., & Tavares, C. J. (2022). Use and misuse of the Kubelka-Munk function to obtain the band gap energy from diffuse reflectance measurements. Solid state communications, 341, 114573.
[38]  Johannes, A. Z., Pingak, R. K., & Bukit, M. (2020, April). Tauc Plot Software: Calculating energy gap values of organic materials based on Ultraviolet-Visible absorbance spectrum. In IOP conference series: materials science and engineering (Vol. 823, No. 1, p. 012030). IOP Publishing.
[39]  Haryński, Ł., Olejnik, A., Grochowska, K., &Siuzdak, K. (2022). A facile method for Tauc exponent and corresponding electronic transitions determination in semiconductors directly from UV–Vis spectroscopy data. Optical Materials, 127, 112205.
[40]  Haq, S., Rehman, W., Waseem, M., Meynen, V., Awan, S. U., Khan, A. R., ...& Iqbal, N. (2021). Effect of Annealing Temperature on Structural Phase Transformations and Band Gap Reduction for Photocatalytic Activity of MesoporesTiO 2 Nanocatalysts. Journal of Inorganic and Organometallic Polymers and Materials, 31, 1312-1322.
[41]  Žerjav, G., Žižek, K., Zavašnik, J., &Pintar, A. (2022). Brookite vs. rutile vs. anatase: Whats behind their various photocatalytic activities?. Journal of Environmental Chemical Engineering, 10(3), 107722.
[42]  Faizan, M., & Ahmad, S. (2021). FTIR and FT-Raman spectra of 6-(dimethylamino) purine and its theoretical studies of anharmonic vibrational analysis using quantum chemical calculations. Vibrational Spectroscopy, 113, 103224.
[43]  Ahmad, A., & Ayub, H. (2022). Fourier Transform Infrared Spectroscopy (FTIR) Technique for Food Analysis and Authentication. In Nondestructive Quality Assessment Techniques for Fresh Fruits and Vegetables (pp. 103-142). Singapore: Springer Nature Singapore.
[44]  Haghighi, P., & Haghighat, F. (2023). TiO2-based photocatalytic oxidation process for indoor air VOCs removal: A comprehensive review. Building and Environment, 111108.
[45]  Zhao, W., Adeel, M., Zhang, P., Zhou, P., Huang, L., Zhao, Y & Rui, Y. (2022). A critical review on surface-modified nano-catalyst application for the photocatalytic degradation of volatile organic compounds. Environmental Science: Nano, 9(1), 61-80.