-
Paper Information
- Paper Submission
-
Journal Information
- About This Journal
- Editorial Board
- Current Issue
- Archive
- Author Guidelines
- Contact Us
American Journal of Materials Science
p-ISSN: 2162-9382 e-ISSN: 2162-8424
2022; 12(1): 18-24
doi:10.5923/j.materials.20221201.03
Received: Apr. 10, 2022; Accepted: Apr. 29, 2022; Published: May 24, 2022

Analysis of Copper Deposits in Maragwa Location in Tharaka Nithi County – Kenya
 Abstract
 Reference
 Full-Text PDF
 Full-text HTML
Peterson Mutembei Kugeria1, Peter Waithaka Njoroge2
1Department of Physical Sciences, University of Embu, Embu, Kenya
2Department of Physical Sciences, Murang'a University, Murang'a, Kenya
Correspondence to: Peterson Mutembei Kugeria, Department of Physical Sciences, University of Embu, Embu, Kenya.
| Email: |  |
Copyright © 2022 The Author(s). Published by Scientific & Academic Publishing.
This work is licensed under the Creative Commons Attribution International License (CC BY).
http://creativecommons.org/licenses/by/4.0/

A primary obstacle to some developing countries like Kenya is the reliance on agriculture when they are endowed with bulk of some mineral resources like copper. The economies of some developed and developing countries are usually supported by the exploitation of these natural resources. In Kenya, few copper deposits have been identified but there is no established copper industry. In this study, new deposits from Maragwa location were investigated with the aim of determining their suitability for extraction. During sampling, Kamwathu and Maragwa sub-locations in Maragwa location in Tharaka Nithi County Kenya were identified. Five deposits from each sub location were identified. In each deposit, a pick mattock was used to dig and breaks the mineral rocks. About a kilogram of minerals was obtained at 30 cm deep, and another one at one meter depth. The samples were separately labelled as Level A and B. The samples were analysed using XRD and AAS for mineralogical and elemental composition respectively. The common copper mineral was chalcopyrite minerals with a mean mineral abundant of 5.12. The mean copper composition ranged between 1.76±0.19 and 8.42±1.35, with an average mean of 4.46±0.45 percent. The mean copper at level A and B was 4.47±0.7 and 4.44±06 percent. Copper minerals distributed uniformly with the depth. The deposits had chemical composition greater than the cut - off grade of 0.4 - 1.0 percent required for commercial extraction.
Keywords: Copper, Maragwa location, Copper extraction, Copper deposits
Cite this paper: Peterson Mutembei Kugeria, Peter Waithaka Njoroge, Analysis of Copper Deposits in Maragwa Location in Tharaka Nithi County – Kenya, American Journal of Materials Science, Vol. 12 No. 1, 2022, pp. 18-24. doi: 10.5923/j.materials.20221201.03.
Article Outline
1. Introduction
- Copper deposits are usually found in varied mineralogical and elemental composition [1]. The minerals includes chalcopyrite (CuFeS2), bornite (Cu5FeS4), chalcocite (Cu2S), covellite (CuS), cuprite oxide (Cu2O), and malachite (Cu2CO3(OH)2) among many other minerals [2,3]. In China, about fifteen copper ores grades between 0.82 to 0.99 percent [4]. In Mexico the copper ores from the States of Zacatecas, San Luis Potosi, Chihuahua and Guerrero have average grades of 0.4 percent copper [5]. In African countries, copper ores mined contain mainly chalcopyrite and bornite minerals with average copper composition of 0.5 to 2.3 percent [6]. In Botswana copper is extracted from ores containing mainly chalcocite, bornite and copper sulphides grading between 1.3 and 1.5 percent copper [7,8]. In South Africa, copper reserves have been found to contain mainly chalcopyrite and bornite minerals grading between of 0.49 to 0.71 percent [9]. In Tanzania, the copper minerals at Bulyanhulu and the Buzwagi copper mines are of high grade which is mainly azurite and malachite minerals [10]. In Sudan, mineral deposits found at Hadal Awatib East mine, Hadayamet, and Hassai South mine grades at average of 1.12 percent copper [11].In Kenya, few copper deposits have been identified. For instance, in Macalder in South Nyanza and Kitere near Kisii, copper minerals occur as sheets, veins, and lenses between stratified layers of banded iron formation as sandstone, and metabasalts [7]. Copper sulphides minerals in these areas occur as quartz, sphalerite‐pyrite, pyrrhotite-chalcopyrite, and copper carbonate grading at 3.0 to 4.55 percent Cu. More copper minerals have been identified near Voi Hill and Maungu with a sample from the best mineralized part of the outcrop assaying at 8.2 percent Cu [12]. In Kanzugo region in Kitui County, green malachite and blue azurite minerals are found within the igneous rocks [13]. In Eastern Kenya, the studies done in Maragwa location in Tharaka Nithi County, found copper minerals to occur as chalcopyrite minerals assaying 1.77 – 8.38 percent Cu [14]. Despite the presence of such good copper deposits in Kenya, their extraction has not been exploited for economic growth. This is probably due lack of capital and technological requirement to establish industries in Kenya [15].
2. Materials and Methods
2.1. The Study Area
- Samples for analysis were obtained from Maragwa location, Tharaka North Sub - County in Tharaka Nithi County. In the location, two sub locations were studied namely Kamwathu and Maragwa. The Geological map of the study area is given in figure 1.
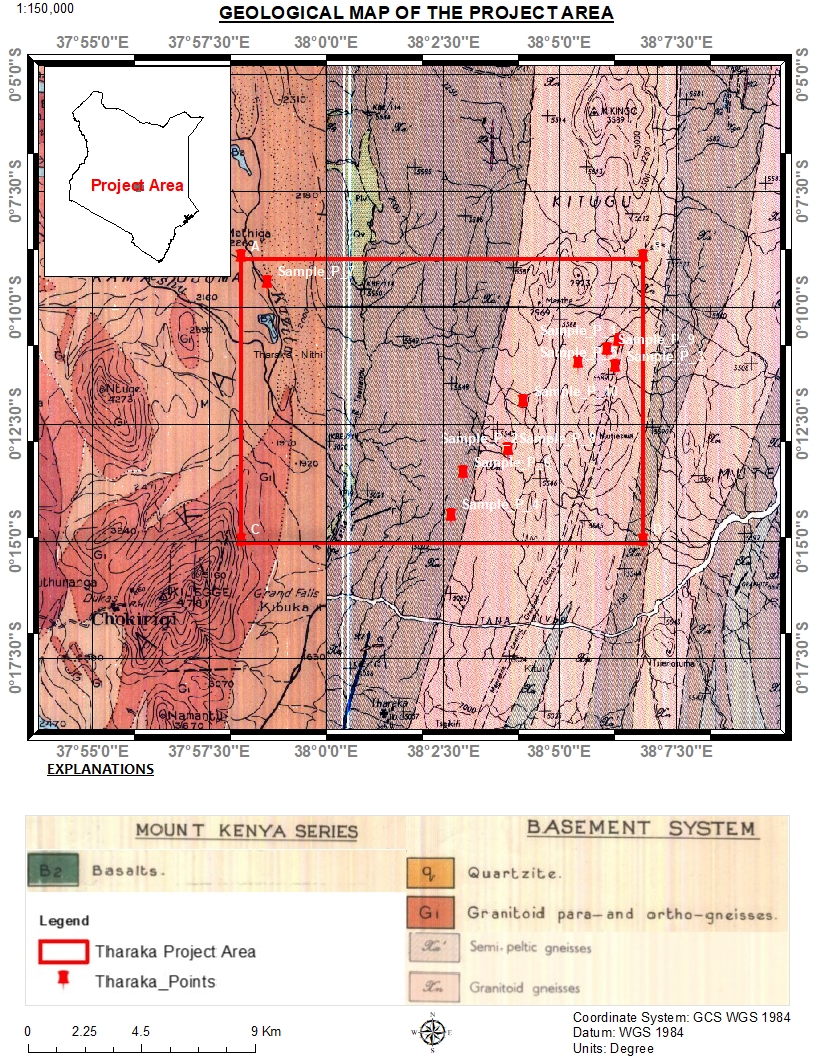 | Figure 1. A Geological map indicating the study area in Maragwa Location (Source: Geological map of Kenya, Mount Kenya Series) |
2.2. Sample Collection and Preparation
- Five quarries from each of the two sub locations were randomly selected for sampling. The quarries selected were spaced about one to two kilometres apart. The quarries selected from Kamwathu were coded as 3227, 3230, 3231 3232 and 3233. Those of Maragwa were coded as 3234, 3238, 3240, 3242 and 3244. From each of the quarries, three sampling sites were selected within a distance of about 10.0 m apart. A pick mattock was used to dig and break the rocks. A shovel was used to scoop out the mineral samples. About a kilogram of the mineral samples were obtained from each of the selected site at a depth of 30.0 cm (named as level A). The mineral samples were crushed using a hummer into small particles ranging between 4.0 and 8.0 meshes. The crushed mineral particles were then mixed carefully. About two kilogram of the mixture was obtained and packed in labelled plastic bags. The samples were labelled as follows; 3227A, 3230A, 3231A 3232A, 3233A, 3234A, 3238A, 3240A, 3242A and 3244A. Another sample was obtained the same way at one metre depth (named level B) from each quarry. The samples were then labelled as follows; 3227B, 3230B, 3231B 3232B, 3233B, 3234B, 3238B, 3240B, 3242B and 3244B. The mineral samples were then transported to the laboratory for further preparation. At the laboratory, all the samples were pulverized to 60.0 meshes using a ball mill.
2.3. Sample Analysis Using XRD
- X- ray diffraction was carried out using an X'Pert³ MRD XL diffractometer model. The diffractometer was configured using the PreFIX (pre-aligned, fast interchangeable X-ray) concept for the soil samples. 3.0 g of the sample was put into the sample holder and loaded into the goniometer, and the measurement taken [16].
2.4. Sample Analysis Using AAS
- The 0.1 g of the sample was put in a 125-ml plastic container. One ml of concentrated aqua-regia (1:3, Nitric acid to hydrochloric solution) was added followed by 3.0 ml of 32.1 M hydrofluoric acid. The sample was then left to digest for 8 hours. 50.0 ml of 0.92 M boric acid was added then allowed to react for one hour. The solution was then topped up to make 100.0 ml using distilled water. The Syenite (SY-3) and Mount Royal Gabbro (MRG) rock standards were used to calibrate the AAS. The standards were weighed and digested following the same procedure used to digest the samples. Samples were then analysed alongside the standards [16].
2.5. Loss of Ignition
- 1.0 g of the samples was weighed into crucible boats and then transferred into the furnace. The samples were then heated to 1,000°C for four hours to ensure all organic materials were burnt. The samples were removed from the furnace and then cooled in a desiccator. The cooled samples were re-weighed and the percentage difference calculated and recorded [16,17].
3. Results and Discussion
3.1. Mineralogical Composition of the Ores
- The mineralogical composition from selected deposits in Maragwa location was determined using XRD technique. Example of Some of the minerals present is given by XRD spectra in figure 2 and 3 for samples 3230 and 3238 respectively.
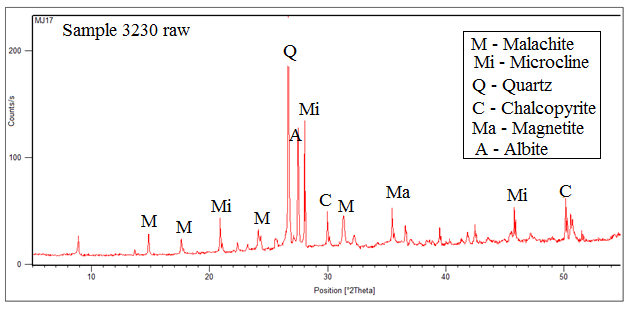 | Figure 2. Showing the XRD Spectrum for raw ore sample 3230 (Source: Kugeria P. M. & Njoroge P. W.) |
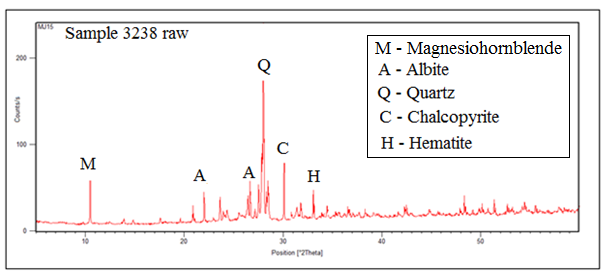 | Figure 3. Showing the XRD Spectrum for raw ore sample 3238 (Source: Kugeria P. M. & Njoroge P. W.) |
|
3.2. Elemental Composition of the Ores
- Elemental analysis was carried on samples using AAS and results given in table 2. The mean chemical composition for each of the ore deposit was determined and result given in table 3. From the results, the mean copper composition ranged between 1.76±0.19 and 8.42±1.35. The mean rutile composition found from all deposits ranged between 0.44±0.06 and 1.98±0.18 with average mean of 0.79±0.11. However, the mean rutile composition at level A was 0.77±0.16 and 0.86±0.17 at level B. from the results, rutile composition distributed well from level A to level B. The silica composition was very high in all deposits with mean ranging from 27.30±1.59 to 68.52±6.32. Mean alumina and iron oxide composition was ranging from 3.22±0.40 to 13.01±2.43 and 0.05±0.02 to 39.76±1.33 respectively. Oxides of calcium and magnesium were also found in significant quantities in some deposits. However, their mean composition ranged from 1.54±0.50 to 21.03±2.88 and 1.05±0.08 to 6.36±0.61 respectively. The other mineral oxides found in all deposits were those of potassium, Sodium and manganese. Their mean ranged from 0.86±0.19 to 11.19±0.77, 2.49±1.54 to 15.64±0.80 and 0.05±0.03 to 1.11±0.31 respectively.
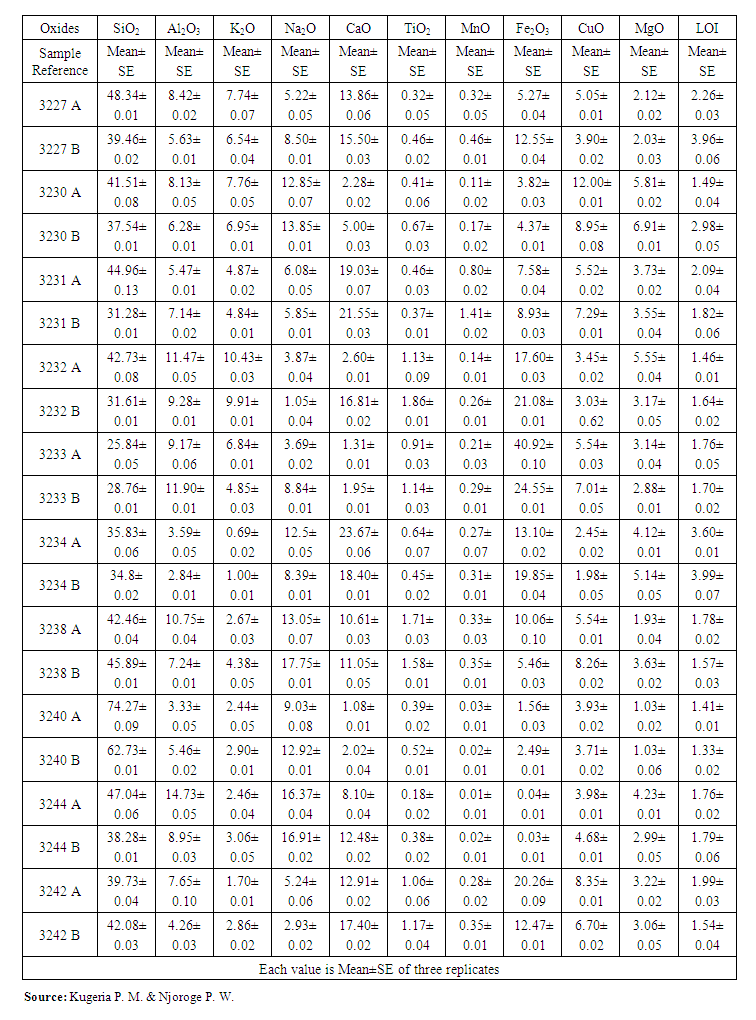 | Table 2. The elemental analysis at level A and B using AAS |
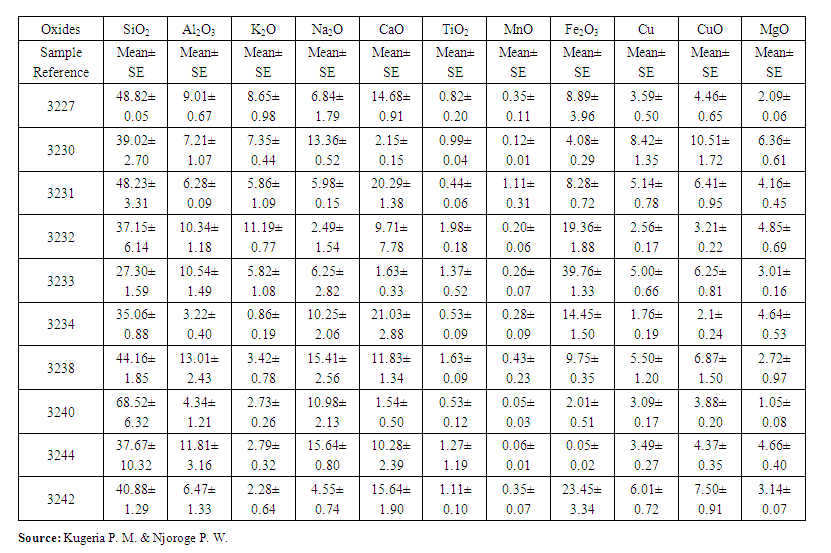 | Table 3. Mean chemical composition for each ore deposit using AAS |
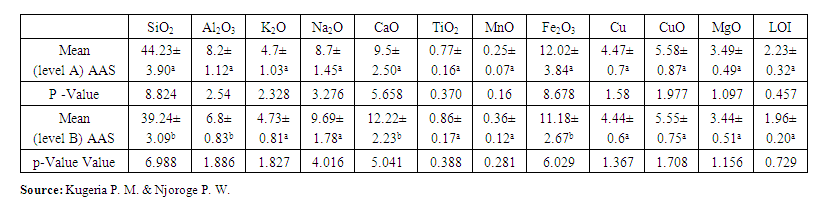 | Table 4. Showing the mean statistical analysis for level A and B at 95.0 % Confidence Level |
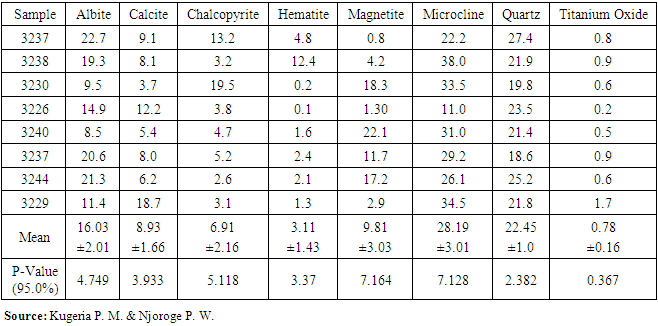
4. Conclusions
- Copper minerals found in the Maragwa location in Tharaka Nithi County in Kenya are rich in chalcopyrite minerals. Chalcopyrite mineral abundance ranges from 2.6 to 19.5 percent. Other common minerals found in the ores were quartz, albite, and microcline, which mainly constitute clay. The quartz, albite and microcline mineral abundances ranged at 18.6 to 27.4 percent, 8.5 to 22.7 percent, and 11.0 to 38.0 percent respectively. Calcite mineral abundance ranged from 3.7 to 18.7 percent. Magnetite and hematite minerals of iron were also found with percentage abundance ranging from 0.8 to 22.0 percent and 0.1 to 2.4 percent, respectively. All deposits found in this region have a copper composition ranging from 1.76±0.19 to 8.42±1.35 percent. This chemical composition is above the cut-off grade of 0.4 to 1.0 percent copper mined in other countries. Therefore, these deposits are viable for copper extraction. Concentration methods, solvent extraction, and electro leaching can be employed in extraction of copper. Quartz, albite, calcite, and microcline minerals are constituents of clay. Their extraction can be investigated for manufacture of cement. In this study, mineral investigation was done up to one meter depth. Further mineral exploration beyond this depth is required to determine the quantity of the minerals available.
ACKNOWLEDGMENTS
- The author acknowledges the contribution of Dr. Waithaka peter for his immense support during the study. He also acknowledges the department of Mines and Geology in the Ministry of Environment and Natural Resources where the experiment was done. Lastly the author thanks the Nyalika Enterprise for allowing the authors to study some of its deposits.