-
Paper Information
- Paper Submission
-
Journal Information
- About This Journal
- Editorial Board
- Current Issue
- Archive
- Author Guidelines
- Contact Us
American Journal of Materials Science
p-ISSN: 2162-9382 e-ISSN: 2162-8424
2021; 11(2): 48-55
doi:10.5923/j.materials.20211102.02
Received: Sep. 21, 2021; Accepted: Oct. 14, 2021; Published: Oct. 30, 2021

Reduction Effect of Exposure to Ultraviolet Radiation of Graphene Oxide Aqueous Suspensions with Different pH Values
 Abstract
 Reference
 Full-Text PDF
 Full-text HTML
Plínio Fernandes Borges Silva1, Lúcia Emília Letro Ribeiro2, Vinícius Meirelles Mendonça1, Sidney Nicodemos da Silva1
1Department of Materials Engineering, Federal Institution of Technological Education of Minas Gerais, Belo Horizonte, Brazil
2Department of Chemistry, Federal Institution of Technological Education of Minas Gerais, Belo Horizonte, Brazil
Correspondence to: Plínio Fernandes Borges Silva, Department of Materials Engineering, Federal Institution of Technological Education of Minas Gerais, Belo Horizonte, Brazil.
| Email: |  |
Copyright © 2021 The Author(s). Published by Scientific & Academic Publishing.
This work is licensed under the Creative Commons Attribution International License (CC BY).
http://creativecommons.org/licenses/by/4.0/

In this work, it was analyzed the photocatalyst reduction of graphene oxide radiated by ultraviolet (UV) light with three different pH values and without any photoactivatable nanoparticles or photo-initiator chemicals. A pristine graphene oxide was dispersed in an aqueous solution and exposed to UV light for five hours with constant stirring and controlled temperature. After the exposure process, the solutions were put in an oven at 120°C for 8 hours for the solvent evaporation. To investigate possible changes in the graphene oxide morphology a Scanning Electron Microscopy (SEM) was applied. Also, during the SEM analysis X-ray spectroscopy by energy dispersion (EDS) was performed to obtain a semi-quantitative chemical characterization. To complement the chemical characterization, the Fourier transform infrared (FTIR) spectroscopy, Raman spectroscopy technique and thermogravimetric analysis (TGA) were performed. Lastly the change in the microstructure was determined by X-ray diffraction (XRD). The characterization showed a decrease in the oxidation degree of the graphene oxide submitted to the process proposed. Thus, the results indicated that the acid environment improved the reduction of the oxygen-functional groups present in the graphene oxide. This work collaborates to the possibility of the use of UV-light exposure to obtain reduced graphene oxide with different degrees of oxidation.
Keywords: Graphene Oxide, Reduced Graphene Oxide, Photocatalyst Reduction, UV light Exposure
Cite this paper: Plínio Fernandes Borges Silva, Lúcia Emília Letro Ribeiro, Vinícius Meirelles Mendonça, Sidney Nicodemos da Silva, Reduction Effect of Exposure to Ultraviolet Radiation of Graphene Oxide Aqueous Suspensions with Different pH Values, American Journal of Materials Science, Vol. 11 No. 2, 2021, pp. 48-55. doi: 10.5923/j.materials.20211102.02.
Article Outline
1. Introduction
- Graphene oxide (GO) is a carbon-based nanomaterial that has in its structure the presence of oxygen atoms and other oxygenated chemical groups, granting it different properties from graphene. This structure derived from graphene is characterized by the presence of chemical functional groups such as: hydroxyl, carbonyl and epoxy, on the surface and/or at the ends of the carbon sheet [1], [2]. These oxygen-functional groups (OFGs) are remnants of the GO production process, called chemical exfoliation. In general, GO is obtained through an intense oxidation of graphite in an extremely acidic solution in the presence of different oxidizing chemical agents, a method initially developed by Hummers, Offeman 1958 [3], [4].In addition, the chemical exfoliation process, due to its low cost and high efficiency, is used to obtain a version of graphene oxide with properties closer to graphene [5], [6]. Nevertheless, graphene oxides (GOs) have advantages over graphene in terms of better solubility and stability in aqueous media [7], [8]. The reduced graphene oxide (rGO) is obtained after a process of reduction of the graphene oxide for the removal of OFGs and restoration of the hexagonal sp2 structure of graphene [9]. The best-known types of GO reduction are thermal [10], [11], chemical [12], [13], electrochemical [14], [15] and photocatalytic reduction [16]. Each process has their own characteristics and limitations, therefore, there is no superior method among them [17].The photocatalytic reduction process consists of the use of electromagnetic radiation to remove the oxygen-functional groups. This process is known for having two different paths for reduction: 1) using photoactivatable inorganic nanoparticles and, 2) using activated photo-initiator compounds [18]. Radiations in microwave, visible, ultraviolet and gamma spectra have already been tested in this process by other authors [19]–[22]. In general, electromagnetic radiation interacts with the agents and the GO in order to generate the right conditions for the removal of the OFGs from the graphene oxide structure. The photoactivatable inorganic nanoparticles approach is based on the capability of specific particles to generate electron-hole pairs when irradiated by specific electromagnetic wavelengths. This excited state is capable of inducing the reduction in the GO and generate rGO/nanoparticles hybrids [23]. Titanium dioxide, silver nanoparticles, and zinc oxide are some well-known examples of nanoparticles tested for this purpose [24]–[26]. Whereas, the use of photo-initiator chemical compounds for the reduction of graphene oxide is based on the possibility that by electromagnetic radiation. Many different compounds were tested for this purpose such as ascorbic acid, polyvinyl pyrrolidone, sulphite, and even green alternatives such as tea leaves extract [21], [27]–[29]. These compounds create free-radicals that can interact with the OFGs extracting them from the GO’s structure [30]. Research on the investigation of the photocatalytic reduction without the use of any photoactivatable nanoparticles or photo-initiator chemicals have been limited. Guardia et al. 2012 [31] investigated the capability of the reduction of graphene oxide in aqueous solution irradiated by UV light. The results showed that the UV light radiation achieved lower oxidation states on the GO dissolved only in deionized water. The aim of this work is to contribute to the study of the photocatalytic reduction of graphene oxide radiated by ultraviolet (UV) light without any photoactivatable nanoparticles or photo-initiator chemicals, evaluating aqueous solutions with alkaline, neutral and acidic pH. Thus, this study proposes a simplified process, without controlled atmosphere, and with the possibility to manufacture reduced graphene oxides with a desirable level of oxidation.
2. Experimental
2.1. UV-Radiation Exposure Process
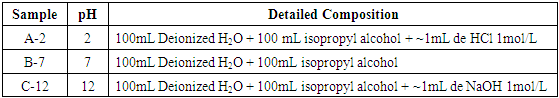
- The exposure process was done using 200 mg of graphene oxide (pristine GO) provided by the research center Centro de Tecnologia em Nanomateriais e Grafeno CTNano (Belo Horizonte, Brazil) solubilized in 200 mL of a solution composed of deionized water and isopropyl alcohol (50% v/v), achieving the concentration of 1 g/L. From this initial dispersion, three samples were made with different pH adding HCl 1 mol/L and NaOH 1 mol/L to the acidic and alkaline media, respectively. Table 1 shows the detailed solution composition for each sample.
|
2.2. Characterization
- The morphological structure was obtained by scanning electron microscopy (SEM) analysis with SHIMADZU SSX-550 equipment with a tungsten filament and Acc Voltage of 15,0 kV. During the SEM analysis, X-ray spectroscopy by energy dispersion (EDS) was performed to obtain a semi-quantitative chemical characterization of the material. To detect peak displacement in the samples diffractograms, an X-ray diffraction (XRD) analyzes were performed on a SHIMADZU XRD-7000 device using a copper target (CuKα, and λ = 0.15406 nm) at 40 kV and 30 mA. The analysis was conducted with angle range of 2θ = 5° – 50° and scan speed of 2 o/minute. The presence of oxygen-functional groups was analyzed by Fourier transform infrared (FTIR) spectroscopy technique performed on the Perkin Elmer FTIR Frontier device, with a wavelength range of 4000-650 cm-1. The graphene structural organization was measured using the Raman spectroscopy, performed on the WiTec Alpha300 device with the λ = 532 nm wavelength laser. The weight loss due to the photoreduction of GO was measured by thermogravimetric analysis (TGA), performed on the HITACH STA7000 series equipment, with a sensitivity of 0.2 µg and in an inert atmosphere of N2. The analysis was conducted with a maximum temperature of 1000°C and 10°C/min of temperature increment on a platinum crucible.
3. Results and Discussion
- As shown in the figure 1, the Pristine GO had the aspect of a solid foam with visible porosity. The A-2 and B7 samples turned out into identical flat sheets of solid and brittle material.The sample C-12 with pH = 12 was not capable of solubilize the GO used, therefore it was not submitted to the photoreduction process. This result is a contrast with other works such as [31], [32]. However, the complex nature of the composition of graphene oxide due to its variety of fabrication compounds, can hinder the stability of GO in different solvents with a large range of pH by unexpected functionalization [33]. Thus, unexpected similar results of unstable solubility with alkaline pH can also be found in the literature [34], [35].
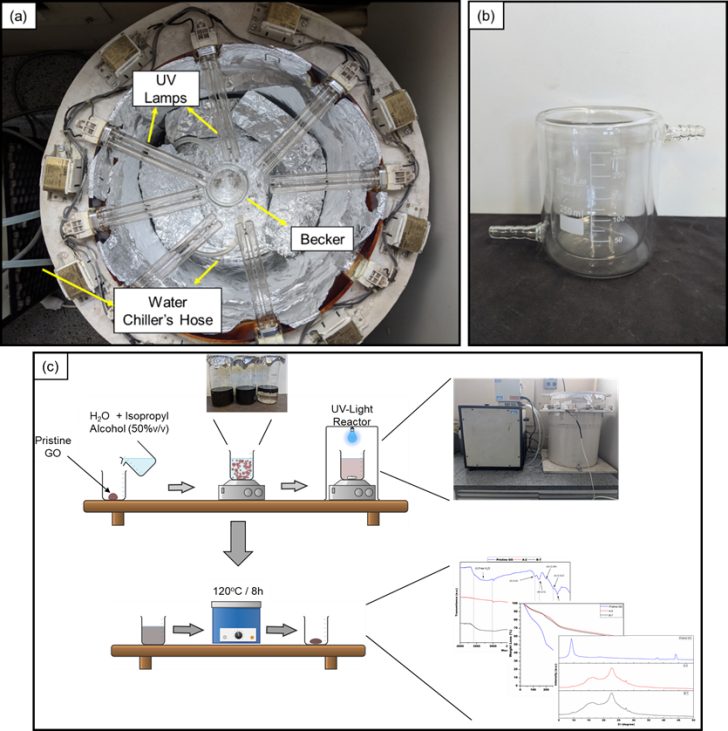 | Figure 1. Illustration of the Experimental Setup (view from above): (a) UV Exposure Reactor (b) Jacketed Beaker (c) Graphical Abstract |
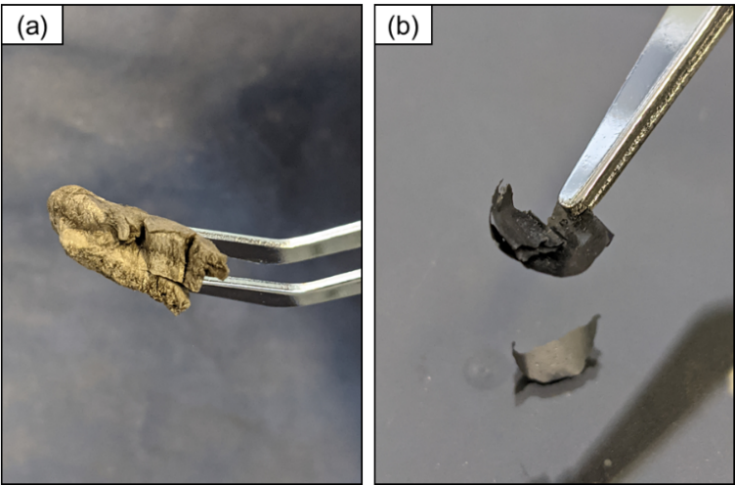 | Figure 2. Images of the samples: (a) Pristine GO (b) A-2 |
3.1. SEM/EDS Analysis
- The SEM images (figure 3) present the morphology of the samples before (Pristine GO) and after the photoreduction process. It is possible to notice that the pristine GO had a cohesive and porous structure, with the GO nanosheets connected to each other (figure 3-a). This morphology can be attributed as a result of the lyophilization process to obtain solid GO from a solution, in accordance with the structures reported by Yu et. al. (2015) and Tang et al (2019) [36], [37]. The samples A-2 and B-7 (figure 3-b and 3-c), on the other hand, presented a cohesive and planar structure with the presence of folds of GO nanosheets over the entire surface. In sample B-7 (figure 3-c), a remaining porosity of the pristine GO was identified. This characteristic can be considering as an intermediate result in comparison with sample A-2. Besides that, in the sample A-2, the surface was more cohesive with no porosity. Also, the surface was marked with the presence of bigger folds in GO nanosheets.
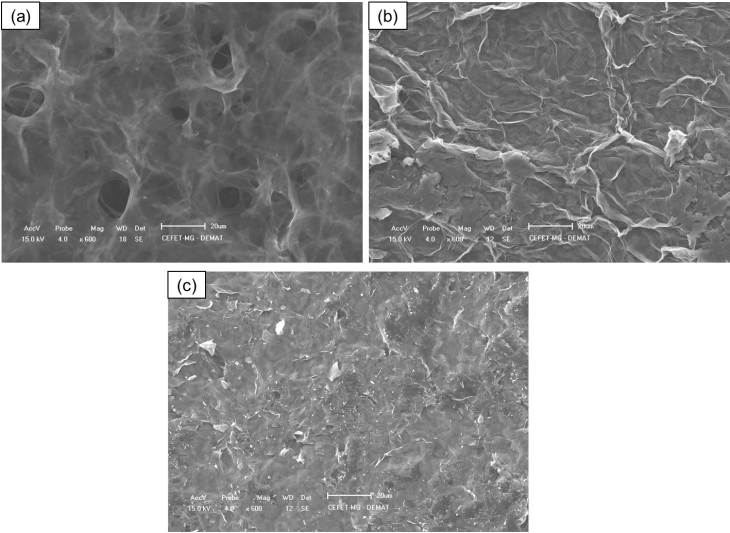 | Figure 3. SEM images of the samples: (a) Pristine GO (b) A-2 (c) B-7 |
|
3.2. FTIR Spectroscopy
- Figure 4 shows the results of the FTIR analysis of the GO samples and the identification of vibrational bonds peaks. The result of the FTIR analysis of the pristine GO sample (Figure 4) revealed peaks related to the vibration of chemical bonds of the oxygen-functional groups present in the graphene oxide. The peaks can be attributed bonds [10], [15], [38]–[40]:(I) ~3250 cm-1: Free H2O molecules vibration;(II) ~1730 cm-1: Stretching of carbonyl and/or carboxyl groups (C=O);(III) ~3250 cm-1: Free H2O molecules vibration;(IV) ~1730 cm-1: Stretching of carbonyl and/or carboxyl groups (C=O);(V) ~1600 cm-1: Skeletal carbon vibration of unoxidized graphitic domain (C=C);(VI) ~1380 cm-1: Alcoholic groups vibration (C-OH);(VII) ~1150 cm-1: Vibration of epoxy (C-O-C) and phenolic groups (C-OH); (VIII) ~1055 cm-1: Alkoxy groups vibration (C-O).
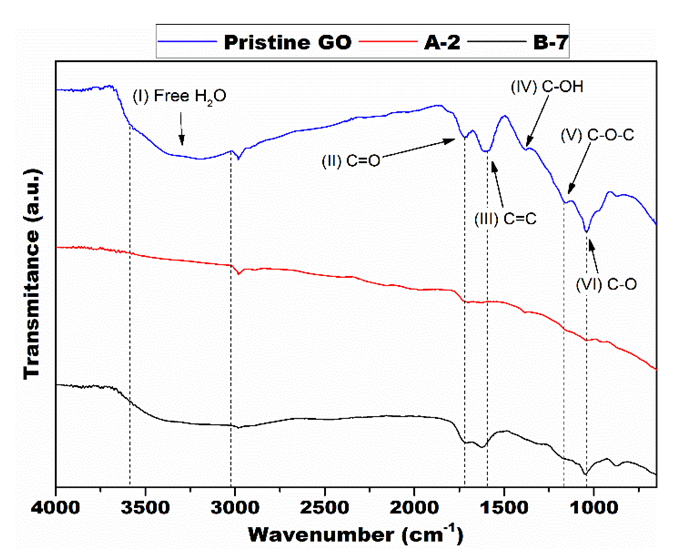 | Figure 4. FTIR spectroscopy curves with highlighted peaks |
3.3. Raman Spectroscopy
- The Raman spectroscopy graphs of the samples where the D, G, 2D and G’ bands of carbon nanomaterials could be identified in the figure 5.The D and G bands are found in the literature in displacements 1350 cm-1 and 1580 cm-1 respectively, however, as it is shown in figure 5 the peaks appeared with a red shift [41]. This phenomenon is commonly found in graphene oxides because of the OFGs present in its structure. The functional groups can alter the interaction between the laser and the phonons of the D and G bands. One explanation for this phenomenon is the large number of C=C double bonds isolated by oxygenated functional groups [14].
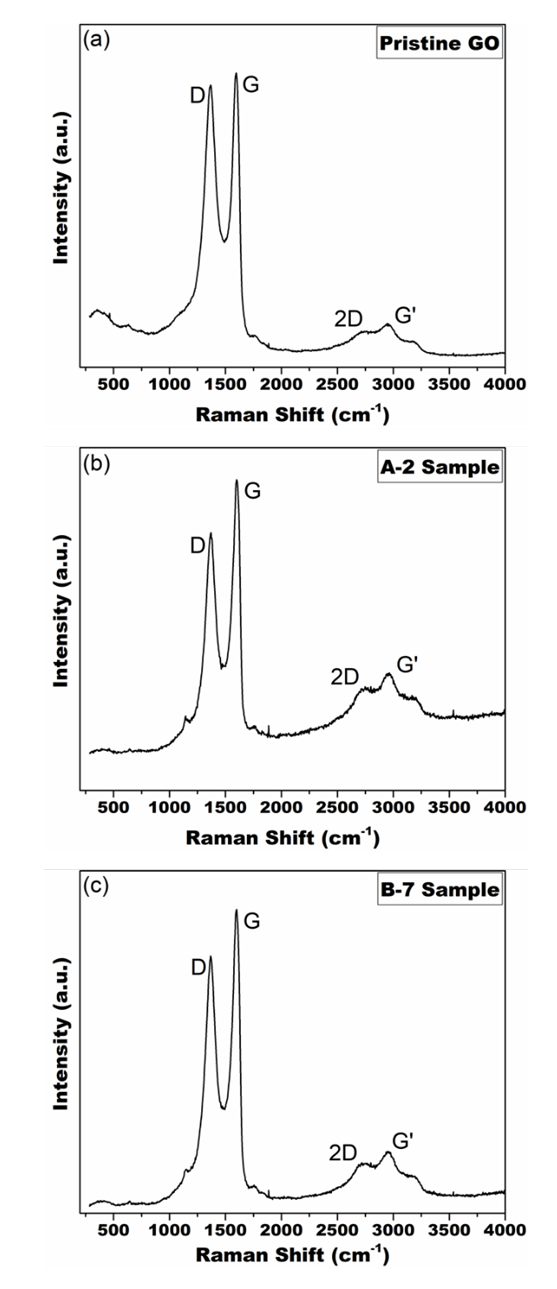 | Figure 5. Raman spectroscopy of the samples: (a) Pristine GO (b) A-2 (c) B-7 |
|
3.4. X-Ray Diffraction
- The diffractograms of the samples (figure 6) show a peak displacement caused by the photoreduction process.
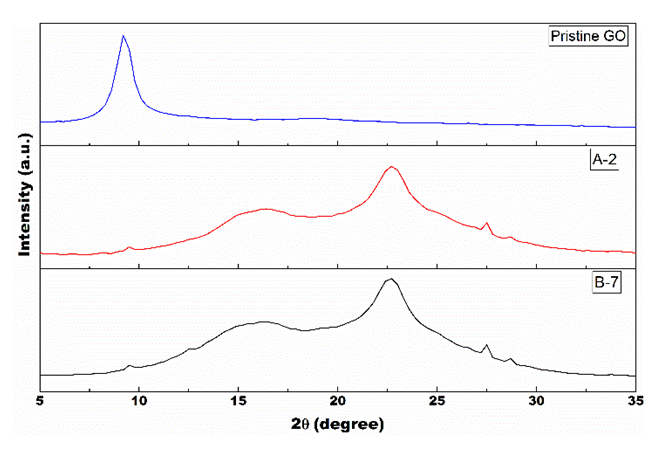 | Figure 6. Diffractograms of the samples showing a peak shift after the UV radiation exposure |
3.5. Thermogravimetry Analysis
- Figure 7 shows the result of the thermogravimetry analysis showing a decrease of weight loss after the applied process. The TGA results show an intense decrease in weight loss of the samples submitted to the photoreduction process in relation to the pristine GO.
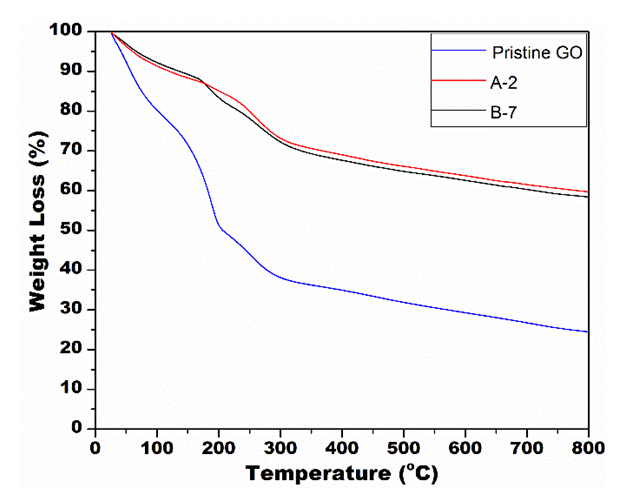 | Figure 7. TGA results of the samples before and after the UV radiation exposure |
4. Conclusions
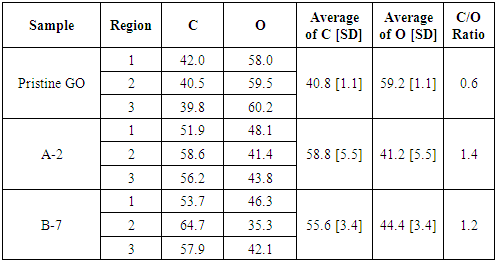
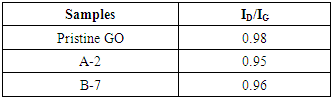
- In summary, this work studied the photocatalytic reduction of graphene oxide by UV radiation without the use of any photoactivatable nanoparticles or photo-initiator chemicals. Also, it was tested the influence of three different pH on the performance of the proposed process. First, the sample with alkaline pH was not able to solubilize the GO used, making in unviable for the proposed process. Then, the results confirmed that the graphene oxide solubilized in solutions with acid and neutral pH was partially reduced. The UV light was able to interact with OFGs on the surface of the GO particles in suspension, providing enough energy to extract them from the nanoparticle. The characterization techniques proved a significant variation from the pristine GO to the after-exposure samples. The XRD analysis presented a peak shift from 2θ = ~9° to 2θ = ~16° merging with the graphene peak at 2θ = ~22°, which is well-known result for the reduction of GO. Also, the reduction of weight loss from 76% for Pristine GO to ~40% for the irradiated samples measured by TGA confirmed the reduction capability of the process. The pH influence in the photocatalytic reduction was confirmed by FTIR and EDS analysis. The measurement of carbon and oxygen concentration of regions of the samples by EDS spectroscopy determined a local C/O ratio that confirmed an increase of the oxygen reduction for the sample with acid pH. In addition, the FTIR spectroscopy showed a reduction in the peaks related to the bond of the OFG’s for the irradiated samples, and this reduction was more drastic for the acidic pH sample. Thus, the analysis of the Raman spectroscopy of the samples suggests that the purposed process was able to maintain the defect level of the GO used, by a balance of energy for both extraction of the OFGs and restauration of the graphene carbon matrix. Finally, the proposed process presents itself as an easier and straightforward way of reducing GO. Furthermore, it allows the possibility of manufacture rGO with different levels of oxidation, that can be designed to be a perfect fit in different applications.
ACKNOWLEDGEMENTS
- This study was financed in part by the Coordenação de Aperfeiçoamento de Pessoal de Nível Superior – Brasil (CAPES) – Finance Code 001. This work was also supported by the Centro de Educação Tecnológica de Minas Gerais (CEFET-MG), Centro de Tecnologia em Nanomateriais e Grafeno (CTNano), Conselho Nacional de Desenvolvimento Científico e Tecnológico (CNPq) and Fundação de Amparo à Pesquisa do Estado de Minas Gerais (FAPEMIG).