American Journal of Materials Science

p-ISSN: 2162-9382    e-ISSN: 2162-8424

2021;  11(2): 37-47

doi:10.5923/j.materials.20211102.01

Received: Aug. 21, 2021; Accepted: Sep. 8, 2021; Published: Sep. 15, 2021


Prediction of Effects of Process Parameters to Study the Microstructure of TIG Welded Mild Steel Sheet by Using Taguchi Method

Javid Ahmed, Muneer Shaik, Md. Musthak

Department of Mechanical Engineering, Deccan College of Engineering and Technology, Hyderabad, India

Correspondence to: Md. Musthak, Department of Mechanical Engineering, Deccan College of Engineering and Technology, Hyderabad, India.

Email:

Copyright © 2021 The Author(s). Published by Scientific & Academic Publishing.

This work is licensed under the Creative Commons Attribution International License (CC BY).
http://creativecommons.org/licenses/by/4.0/

Abstract

Welding is a permanent joining process used to join different materials like metals, alloys or plastics, together at their contacting surfaces by application of heat and pressure. During welding, the work-pieces to be joined are melted at the interface and after solidification a permanent joint can be achieved. Sometimes a filler material is added to form a weld pool of molten material which after solidification gives a strong bond between the materials. Weld-ability of a material depends on different factors like the metallurgical changes that occur during welding, changes in hardness in weld zone due to rapid solidification, extent of oxidation due to reaction of materials with atmospheric oxygen and tendency of crack formation in the joint position. A design of experiments based on Taguchi technique has been used to attain the data. An L9 Orthogonal array was applied to investigate the characteristics of welding joint and optimize the parameters. In present research Radiographic test and Liquid penetration test were considered to find out effect of welding parameters like welding current, Gas Flow Rate and Filler Rod on flaws generated during welding. And work response graphs are considered for the study of influence of welding parameters on Porosity, Nodularity and Grain Size.

Keywords: TIG Welding, Radiographic Test, Liquid Penetration Test, Microstructure, Porosity, Nodularity, Grain Size

Cite this paper: Javid Ahmed, Muneer Shaik, Md. Musthak, Prediction of Effects of Process Parameters to Study the Microstructure of TIG Welded Mild Steel Sheet by Using Taguchi Method, American Journal of Materials Science, Vol. 11 No. 2, 2021, pp. 37-47. doi: 10.5923/j.materials.20211102.01.

1. Introduction

TIG welding is an arc welding process that uses a non-consumable tungsten electrode to produce the weld. The weld area is protected from atmosphere by an inert shielding gas (argon or helium), and a filler metal is normally used [11]. The power is supplied from the power source (rectifier), through a hand-piece or welding torch and is delivered to a tungsten electrode which is fitted into the hand piece. The tungsten electrode and the welding zone are protected from the surrounding air by inert gas. The electric arc can produce temperatures of up to 20,000°C and this heat can be focused to melt and join two different part of material. The weld pool can be used to join the base metal with or without filler material. Schematic diagram of TIG welding is shown in fig. 1 [12].
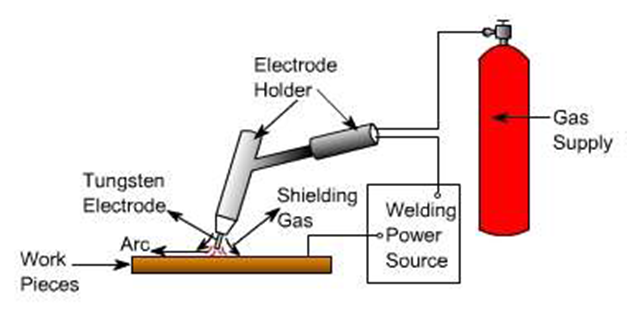
Figure 1. Schematic Diagram of TIG Welding System
The TIG welding process is best suited for metal plate of thickness around 5- 6 mm. Thicker material plate can also be welded by TIG using multi passes which results in high heat inputs, and leading to distortion and reduction in mechanical properties of the base metal. In TIG welding high quality welds can be achieved due to high degree of control in heat input and filler additions separately.

2. Literature Review

Kohyama et al. [1] studied he Microstructural changes in welded joints of 316 SS by dual-ion irradiation was analyzed in this study. They welded the specimens at three different parameters Current, Voltage, Flow Rate. The mechanical and corrosion property changes in welded joints under fusion environment should be very carefully evaluated. Ahmet Durgutlu [2] studied the experimental investigation of the effect of hydrogen in argon as a shielding gas on TIG welding of Stainless Steel material by changing the parameters of Shielding gas. And it can be observed that increasing hydrogen content in the shielding gas reduces the mechanical properties. P. Liu et al. [3] worked on microstructure characteristics in TIG welded joint of Mg/Al dissimilar materials with parameters of welding velocity, wire feed velocity. The structure close to the weld metal is columnar crystals, which grow into the weld metal. The Mg substrate close to the fusion zone was largely affected by the welding thermal cycle, and the crystals were small. The weld metal was mainly composed of dendrite crystal. M. Ahmad et al. [4] Analyzed the microstructure and characterization of phases in TIG welded joints of Zircaloy-4 and Stainless Steel. Input process parameter range of voltage, current and Gas flow rate using the X-ray diffraction (XRD) technique. B.Y. Kang et al. [5] study the effect of alternate supply of shielding gases in austenite stainless steel Welding on the material of Stainless Steel 304 by applying the both Conventional and Alternate method. The input parameters considered are Shielding gas, welding ampere and welding voltage.
S. P. Gadewar et al. [6] analyzed of the experimental investigations of weld characteristics for a single pass tig welding with SS304 with input parameters of Welding current (15-180 Amp), Shielding Gas Flow (1-18 LPM), Work Piece thickness (1-3mm) and applied the Regression analysis technique. Rui-Hua Zhang et al. [7] study of the mechanism of penetration increase in A-TIG welding used the stainless steel materials plate with input parameters which are flux- Al2O3, Fe2 O3, SiO2, Cr2O3, TiO2, MnO, and B2O3 to find the result of penetration simulation by the PHOENICS software. C. Balaji et al. [8] has studied on evaluation of mechanical properties of SS 316 L weldments using tungsten inert gas welding with stainless steel 316 L rod specimen which have dimensions of 25 mm diameter and 75 mm length and changed the input parameters range which are current (90,100,110 amp) bevel angle (60, 70, 800) gas volume (1.1, 0.9, 0.7 lpm) uses the Taguchi L-9 orthogonal array technique and they found the results. Dheeraj Singh et al. [9] studied on parametric optimization of TIG process parameters using Taguchi and Grey Taguchi analysis. They used the Stainless Steel 304 grade plate with the process parameters Current (40-85A), Gas flow rate (5-20 lit./ min), Welding speed (8-14m/min) and Gun angle (500 -800). And they applied the Taguchi method L16 orthogonal array for optimization the result. Cheng-HsienKuo et al. [10] studied on the effect of activated TIG flux on performance of dissimilar welds between mild steel and stainless steel and they used the dissimilar plate with the process parameters which are different flux CaO, Fe2O3, Cr2O3, and SiO2. TIG welding with SiO2 powder can increase weld depth-to-width ratio, which indicates a high degree of energy concentration during welding process, and tends to reduce angular distortion of the weldment. Furthermore, the defects susceptibility of the welds can also be reduced.
Sharma et al. [13] used the TM and PROMETHEE (which widely used MCDM tool) technique to obtain an optimal setting of process parameters for single and multi-optimization resulting in an optimal value of the material removal rate and tool wear rate. Kumar and Mondal [14] compared the results of experimental data on the electric discharge machining of AISI M2 steel by different optimization techniques such as TM, TOPSIS and gray relational analysis (GRA). Viswanathan et al. [15] aimed to investigate the effective factors in turning of magnesium alloy with physical vapor deposition coated carbide insert in dry conditions. To identify the optimal parameters setting, a combination of principal component analysis (PCA) and GRA has been conducted. Liu et al. [16] and, Land and Yeh [17] used both TM and ANSYS which widely used numerical simulation software in order to optimize and design injection molded products. Asafa et al. [18] presented integration of TM and artificial neural network (ANN) technique for the prediction of intrinsic stresses induced during plasma enhanced chemical vapor deposition of hydrogenated amorphous silicon thin films.
From the literature review, it is found that welding of thin plated mild steel is a big challenge by TIG welding process. Again repeatability of welding depends on its control on welding processing parameters. In this work to perform welding of 3 mm MS plate, an automated TIG welding setup was made. Welding of the MS plate was done by changing the welding current, gas flow rate and diameter of filler rod to get a high strength joint. Effect of welding current, gas flow rate and diameter of filler rod were considered for radiographic test and liquid penetration test of weld joint, macrostructure of the heat affected zone and weld joint was analyzed.

3. Methodology

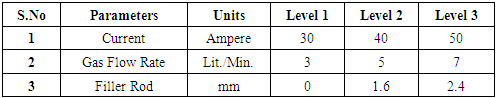
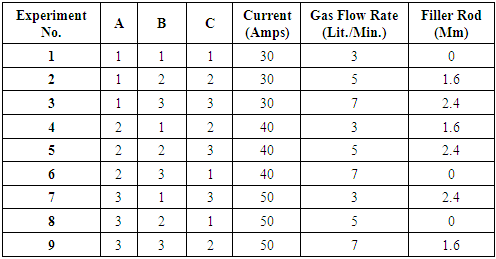
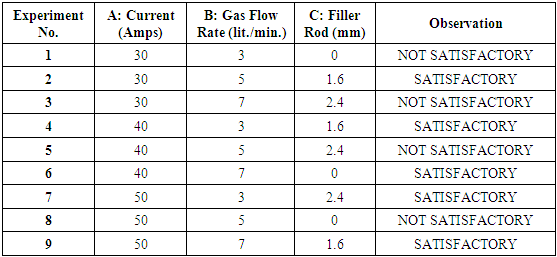
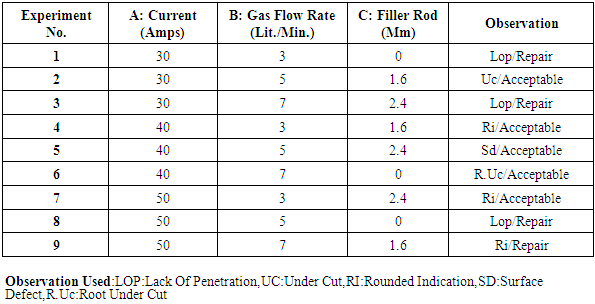
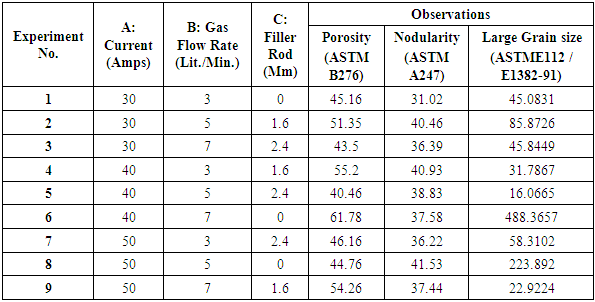
Dr. Genichi Taguchi, a Japanese engineer has developed a method based on orthogonal arrays (OA). In this method quality is measured by the deviation of a characteristic from its target value. A loss function is developed from this deviation. Uncontrollable factors which are also known as noise cause such deviation and result into loss [19]. Taguchi method seeks to minimize the noise because the elimination of noise factor is impractical. This method provides much reduced variance for the experiment with optimum setting of process control parameters. So Taguchi philosophy is based on integration of design of experiments (DOE) with parametric optimization of processes to get the desired results [20].
Parameter design: Taguchi defines a performance measure known as the signal to noise ratio(S/N).The target of the parameter design is to find the optimal setting of the product and the process parameters so that the performance variability is minimized. Selection of parameters is done to maximize the S/N ratio [20]. Signal represents the square of the mean value of the quality characteristic while noise is the measure of the variability of the characteristics. Wang et al. 2011 [21] in his paper investigated the effect of welding current on the microstructure of the material. Table 1 shows the three welding process parameters with three levels hence the taguchi design is of L9 Array. In present study the parameters considered as Current, Gas flow rate and Filler rod diameter. Every parameter is considered with three levels (level 1, level 2 and level 3). The typical L9 orthogonal array is having 9 experiments and its input parameters are as shown in the table 2.
Table 1. Welding Process Parameters
     
Table 2. Experimental Layout Using L9-Orthogonal Array
     
The weld joint can be divided into three basic areas according to the maximum temperature: a) Weld metal, b) Heat Affected Zone (HAZ), c) Unaffected base material zone – parent metal. Welding faults and defects are an unwanted but inseparable part of making weld joints. The aim is eliminating their occurrence.
Welding Defects: Welding defects can be classified in to two types as external and internal defects. External welding defects occur on the upper surface of the welded work. Surface defects of the weld joints are detected by the naked eye or by aid of tools such as magnifying glasses. Internal welding defects occur under the surface of the welded work. These can be detected only after metallographic preparation of the weld joint samples [22].
Weld testing: Weld testing is used to assure the quality and correctness of the weld after it is completed. It is also necessary to check the materials before the process of welding [23]. Two types of tests determine the mechanical properties and quality of the weld joints. They are:
1. Destructive tests – metallographic analysis– microscopic, macroscopic, tensile strength tests, bend tests, hardness tests, Charpy impact tests, weld bending test etc.
2. Non-destructive methods – defectoscopic include visual testing, magnetic particle, liquid penetrant, eddy current, ultrasonic tests, X-ray testing etc.
The quality of welds is assessed in welded metal, heat affected zone (HAZ) and in unaffected base metal [24,25].
Liquid Penetrant Testing (LPT):
It is also called liquid penetrant inspection (LPI) or Penetrant Testing (PT) is a method used to locate the surface-cracking defects in all non-porous materials. This method is mainly used for testing of non-magnetic materials. The penetrant may also be applied to all ferrous and non-ferrous materials. This Test method covers procedures of Heat Effected Zone (HAZ) of weld materials for penetrant examination. Liquid penetrant inspection is used to detect welding surface defects such as hairline cracks, surface porosity, leaks in new products, and fatigue cracks on the products. In this method, a red colored dye penetrant is applied on the surface of the component by dipping, spraying, or brushing. This dye enters crack interfaces through capillary action. After some times the excess penetrant is removed and a developer is applied to detect the weld defects [27]. There are five stages of Dye Penetrant Testing (DPT) are as follows:
• Pre-cleaning
• Application of Penetrant
• Excess Penetrant Removal
• Application of Developer
• Inspection
Radiographic testing method (RT):
The radiographic testing method is a nondestructive testing (NDT) method used for the detection of internal weld defects or weld discontinuities in many different materials and configurations. It is based on using short wavelength electromagnetic radiation passing through the material. The radiation passing through the material forms an image on a photographic film (radiograph) [28].
Experimental work:
Welding thin plates up to 3 mm thick is one of the most complex joining tasks. The aim is to create a stable connection despite the thin material gauge. To prevent distortion of the metal plate and time-consuming reworking, as little heat as possible needs to be generated on the work surface [26]. TIG specimens used in this study were welded using Panasonic Make welding Machine (model BR1-200 (ac/dc)). Welding variables selected are included in Table 2. The 9 experiments based on L9 array were selected to perform the TIG welding as shown in figure 2 to observe the welding defects. The observations (LOP: Lack Of Penetration, UC: Under Cut, RI: Rounded Indication, SD: Surface Defect, R.Uc: Root Under Cut) were noted for non-destructive methods like Radiographic testing as shown in figure 3 and liquid penetration test as shown in figure 4.
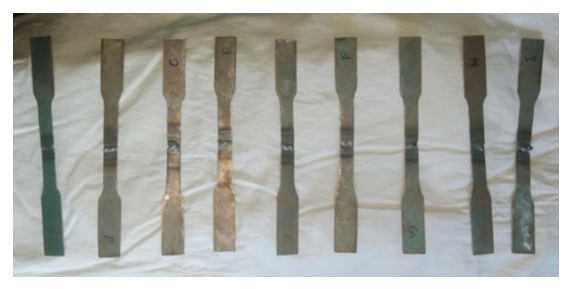
Figure 2. Welded pieces after allowing for the input parameters for welding from table 2
Figure 3. X-Ray Generator
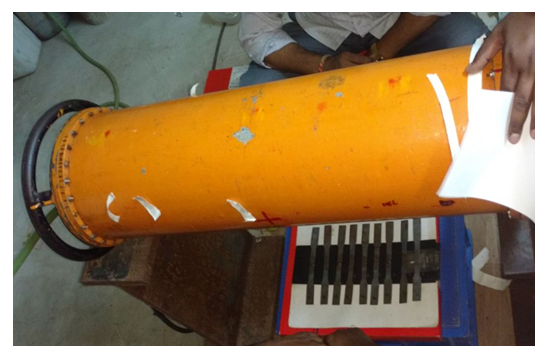
Figure 4. Liquid Penetration Testing
Trinocular microscope Vision Plus-5000 as shown in figure 5 was used to identify, classify and evaluate faults and defects. Trinocular microscope images were processed for Porosity (according to ASTM B276), Nodularity (according to ASTM A247) and Large Grain size (according to ASTM E112/E1382-91). The Trinocular microscope Vision Plus-5000 has Co-Axial focusing system. The specifications of Trinocular microscope Vision Plus-5000 were shown in table 3.
Table 3. Trinocular microscope Vision Plus-5000 specifications
     
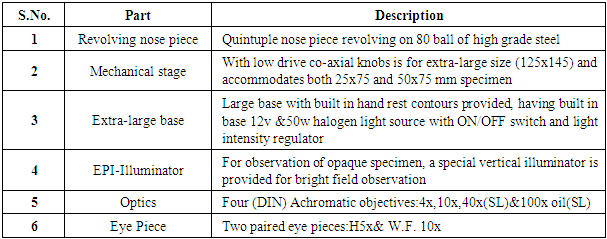
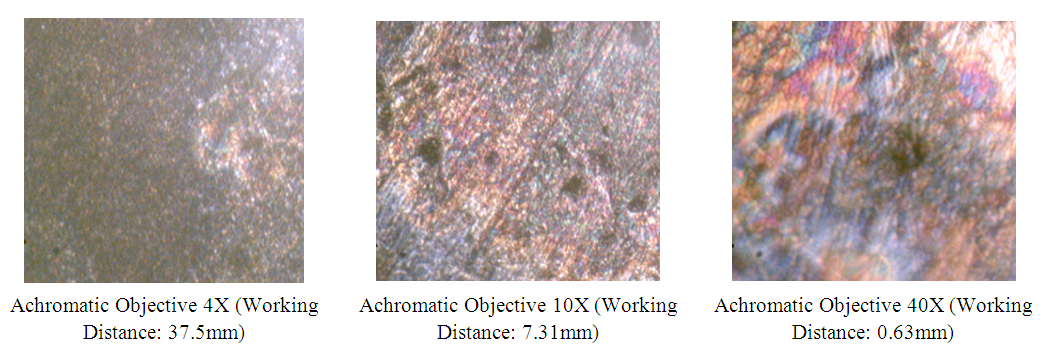
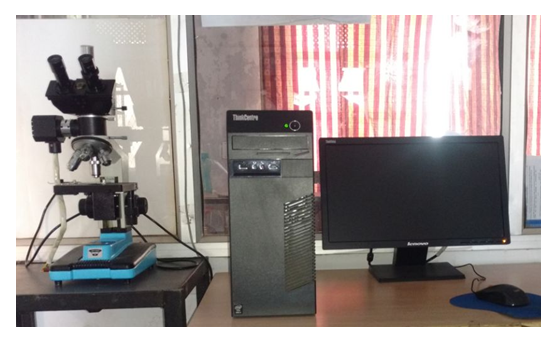
Figure 5. Trinocular microscope Vision Plus-5000 setup

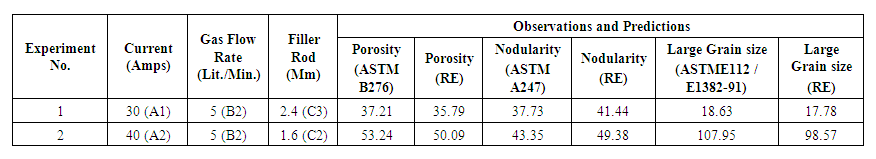
4. Results and Discussions

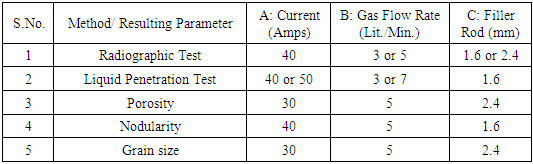
Liquid Penetration Test: In the liquid penetrant test, the test is done for MS TIG welded plates with minimum thickness of 3mm after welding at room temperature weld and HAZ areas, defect indications were found in the jobs. The crater crack, transverse crack, longitudinal crack, surface porosity, weld undercut, and surface lack of fusion in weld seam and heat affected zone were observed by using liquid penetrant test. Hence the observations of Liquid Penetration test are as noted in table 4. From the results it may observed that current with 30 Amps is satisfactory upto 33% only where as current with 40 Amps and 50 Amps are satisfactory upto 66%. Gas flow rate with 3 lit./min and 7 lit./min are satisfactory upto 66% where as Gas flow rate with 5 lit./min is satisfactory upto 33% only. Without filler rod and Filler rod with 2.4 mm are satisfactory upto 33% only where as Filler rod with 1.6 mm is 100% satisfactory.
Table 4. Liquid Penetration Test Result
     
Radiographic Test: Inspection of weld defects from the radiographic images has always been an important and challenging task. Identify internal weld defects such as porosities, longitudinal and transverse cracks, confined slags; lack of proper fusion, in the radiography films is an important objective of welding. Felisberto and colleagues [29] introduced an object identification system in the weld bead, by the extraction of digital radiography. They offered a way to, execute the system head function of interpretation of weld quality based on identify techniques in which genetic algorithms is used to manage levels of search parameters such as position, width, length and angle that are the most important of determinants in radiography image according to the original sample. Undercut occurs at the face of weld and according the standard, in both static and dynamic loading, to determine acceptance or rejection of it depends on the depth of undercuts. The weld profile in groove welds should not be more than 3 mm and If be more than 3mm will be determined as defect, that in related radiography film as a bright white in whole width of weld will be seen. The maximum allowable penetration of the weld root is 2 millimeter and excess penetration, in the middle of weld in radiography film appears brighter white. The overlap is in weld surface where it can be detected by visual inspection. Burn through occurs in the whole weld and can be seen in weld root and in radiography film appears as a black spot, while is rejected. Weld root concavity as a Narrow black line in the middle of the weld (root) is seen. Under fill according to standard is unacceptable and must be filled to the specified profile of weld in the standard. In radiography film appears darker parts of weld. During the assembly, the piece to be welded together is not justified. During the assembly, the two pieces to be welded together are not aligned and because of misalignment of two part, in radiography film, half dark and half-light seen. Incomplete fusion often occurs in weld wall (the junction of the base metal and weld metal) and also between consecutive passes and according to the standard is rejected.
The observations (LOP: Lack Of Penetration, UC: Under Cut, RI: Rounded Indication, SD: Surface Defect, R.Uc: Root Under Cut) of Radiographic test are as noted in table 5. From the results it may observed that current with 30 Amps and 50 Amps are only acceptable upto 33% where as current with 40 Amps is 100% acceptable. Gas flow rate with 7 lit./min is only acceptable upto 33% where as Gas flow rate with 3 lit./min and 5 lit./min are 66% acceptable. Without filler rod only 33% is acceptable where as Filler rod with 1.6 mm and 2.4 mm are 66% acceptable. Incomplete penetration occurs at the root of weld and with any size, according to standard, is rejected. In the incomplete penetration, the edges of part remain sharp, and because it can only occur in the roots.
Table 5. Radiographic Test Result
     
Metallographic Study: Micro-metallographic analysis is performed for a number of purposes, the most obvious of which is to assess the microstructure of the constitutive parts of welded joint (heat affected zone-HAZ and weld metal-WM). It is also common to analysis large grain size, Porosity and Nodularity in the welded joint. The observations using Trinocular microscope Vision Plus-5000 are noted in table 6. Porosity is a measure of the spaces in a , and is a of voids over the total volume, between 0 and 1, or as a between 0% and 100%. Nodularity is the proportion of nodules, their size and their distribution is a key factor in determining the properties of weld, the greater the proportion of nodules, the greater the strength and ductility. Grain size has a measurable effect on most mechanical properties. For example, at room temperature, hardness, yield strength, tensile strength, fatigue strength and impact strength all increase with decreasing grain size. Hence in table 6 the Porosity measured according to ASTM B276, The nodularity measured according to ASTM A247 and Large Grain size is measured according to ASTME112 / E1382-91.
Table 6. Observations Of Microstructure Study
     
Porosity (ASTM B276): Table 7 and Table 8 show the result of the Porosity and signal to noise ratio of weld that has been welded according to selected parameters. By referring to the Table 7 and Table 8, the graphs plotted as in figure 6 and figure 7, shows that for the Porosity smaller the better type of quality characteristic is considered. By observing the results it is noticed that when the current is 30 Amps the Porosity is less. For the Gas flow rate (Lit/min), it is noticed that when the Gas flow rate is 5 Lit/min the Porosity is less. And for the Filler Rod Diameter (mm) it is noticed that when the Filler rod diameter is 2.4 mm the Porosity is less. For the Porosity the first preferece should be given to Filler rod diameter because of its first rank, the next preference is for gas flow rate and the last preference is for Current.
Table 7. Response Table for Means
     
Table 8. Response Table for Signal to Noise Ratios
     
Porosity is caused by the absorption of nitrogen, oxygen and hydrogen in the molten weld pool which is then released on solidification to become trapped in the weld metal. Nitrogen and oxygen absorption in the weld pool usually originates from poor gas shielding. As little as 1% air entrainment in the shielding gas will cause distributed porosity and greater than 1.5% results in gross surface breaking pores. Leaks in the gas line, too high a gas flow rate, draughts and excessive turbulence in the weld pool are frequent causes of porosity. Hydrogen can originate from a number of sources including moisture from inadequately dried electrodes, fluxes or the workpiece surface. Grease and oil on the surface of the workpiece or filler wire are also common sources of hydrogen.
Nodularity (ASTM A247): The method of determining nodularity follows ASTM A 247-67(1998) practices, where percentage of nodularity was based on area fraction nodules versus total graphite area. In general, the tensile strength and tensile elongation decreased with decreasing nodularity. Table 7 and Table 8 show the result of the Nodularity and signal to noise ratio of weld that has been welded according to selected parameters. By referring to the Table 7 and Table 8, the graphs plotted as in figure 6 and figure 7, shows that for the Nodularity larger the better type of quality characteristic is considered. By observing the results it is noticed that when the current is 40 Amps the Nodularity is More. For the Gas flow rate (Lit/min), it is noticed that when the Gas flow rate is 5 Lit/min the Nodularity is less. And for the Filler Rod Diameter (mm) it is noticed that when the Filler rod diameter is 1.6 mm the Nodularity is more. For the Nodularity the first preferece should be given to gas flow rate because of its first rank, the next preference is for Current and the last preference is for Filler rod diameter.
Large Grain size (ASTME112 / E1382-91): Marek Opiela et al [30] has discussed that The strength properties increase considerably with a decrease in grain size from 225 to 13 µm, wherein the critical grain growth took place between 1000 and 1100°C. The inverse relationship was confirmed between the grain size and ductility. Table 7 and Table 8 show the result of the Grain Size and signal to noise ratio of weld that has been welded according to selected parameters. By referring to the Table 7 and Table 8, the graphs plotted as in figure 6 and figure 7, shows that for the Grain size smaller the better type of quality characteristic is considered. By observing the results it is noticed that when the current is 30 Amps the Grain size is less. For the Gas flow rate (Lit/min), it is noticed that when the Gas flow rate is 3 Lit/min the Grain size is less. And for the Filler Rod Diameter (mm) it is noticed that when the Filler rod diameter is 2.4 mm the Grain size is less. For the Grain size the first preferece should be given to Filler rod diameter because of its first rank, the next preference is for gas flow rate and the last preference is for Current.
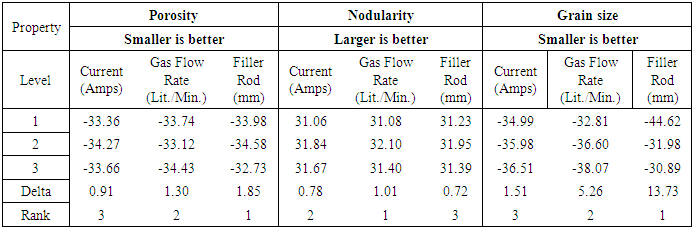
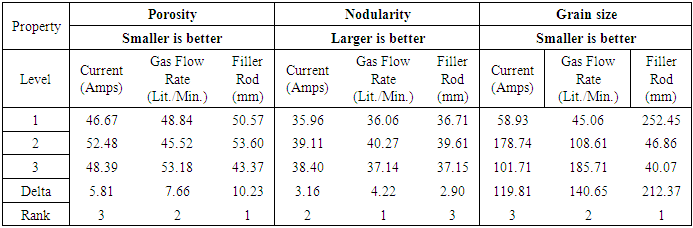
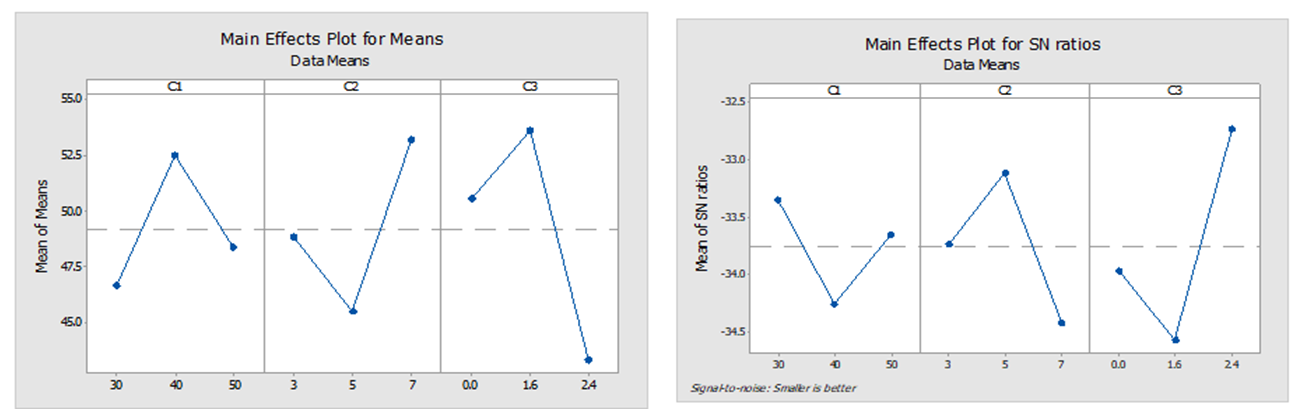
Figure 6. Response graph for Porosity (Smaller is better)
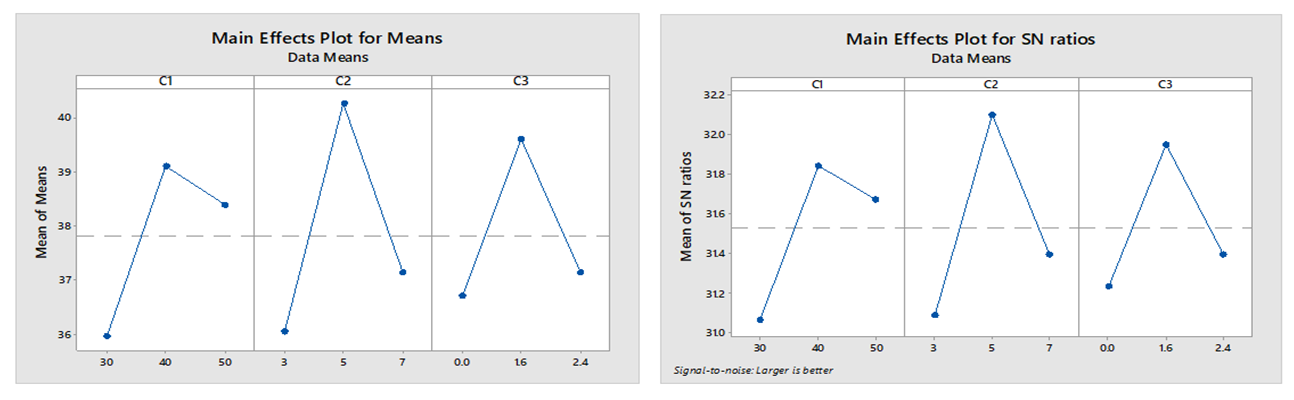
Figure 7. Response graph for Nodularity (Larger is better)
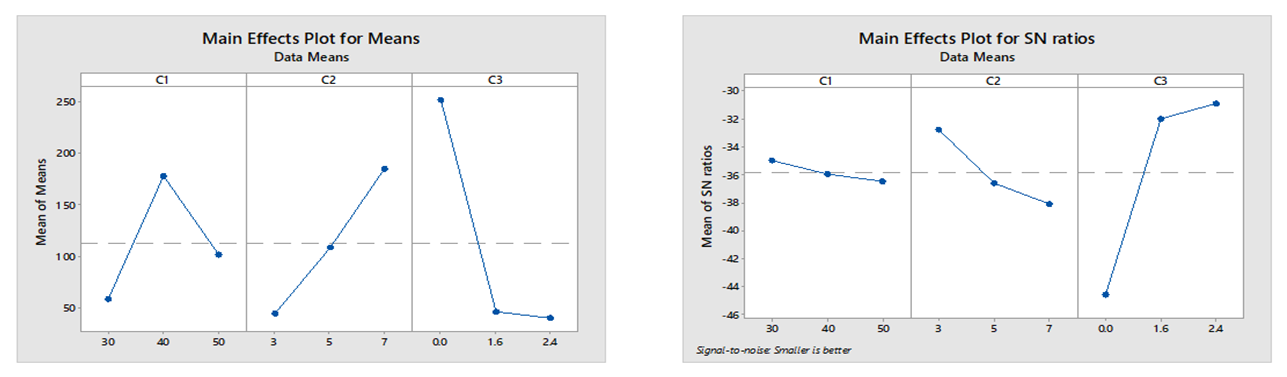
Figure 8. Response graph for Grain Size (Smaller is better)
By observing the above results the following regression equations for porosity, nodularity and grain size were generated.
Predicted Regression equations: A regression equation (RE) is used in stats to find out what relationship, if any, exists between sets of data. Regression equations can help you figure out if your data can be fit to an equation. This is extremely useful if you want to make predictions from your data–either future predictions or indications of past behavior.
Regression Equation for porosity
C4 = 49.18 – (2.51*C11) + (3.30*C12) – (0.79*C13) – (0.34*C21) – (3.66*C22) + (4.00*C23) + (1.39*C31) + (4.42*C32) – (5.81*C33)
Regression Equation for nodularity
C4 = 37.82-(1.87*C11) + (1.29*C12) + (0.57*C13) – (1.77*C21) + (2.45*C22) – (0.69*C23) -(1.11*C31) + (1.79*C32) – (0.68*C33)
Regression Equation for grain size
C4 = 113.1 – (54.2*C11) + (65.6*C12) – (11.4*C130 – (68.1*C21) – (4.5*C22) + (72.6*C23) + (139.3*C31) – (66.3*C32) – (73.1*C33)
Optimization:
By observing the Results we can optimize the parameters. Hence the optimized values are tabulated in table 9. The best optimum results are recorded at A1B2C3 (30 Amps Current, 5 Lit/min Gas Flow Rate and 2.4 mm Filler Rod) for better porosity and Grain Size whereas A2B2C2 (40 Amps Current, 5 Lit/min Gas Flow Rate and 1.6 mm Filler Rod) for better Nodularity. A2B2C2 is also considerable for better Radiographic results and Liquid penetration test results.
Table 9. Optimized Parameters
     
Confirmation Test: The purpose of confirmation test is to validate the prediction parameters based on the optimum level. Based on the respected combinations, the TIG Welding was carried out and the results were noted in Table 10. Hence from table 10 the conformation test was carried out and the results were tabulated.
Table 10. Comparisons of Experimental values and predicted values by using regression equation for Optimized process parameters
The microstructures of Welded zone and Heat affected zone for A1B2C3 and A2B2C2 specimens are shown from figure 9 to figure 12. For the microstructure study 4X (Working Distance of 37.5mm), 10X (Working Distance of 7.31mm) and 40X (Working Distance of 0.63mm) Achromatic Objectives were considered. As it can be observed that the 40X (Working Distance of 0.63mm) shows the clear image of microstructure for all the cases. So that in entire study of Table 6, the 40X (Working Distance of 0.63mm) images were utilised to measure the porosity, nodularity and large grain size. It was seen, while using the low value of current, the amount of heat input raising the temperature was very low. That is why widened, and deeper weld pool was not made. It also gives us an idea about how the weld pool’s depth and widening changes concerning welding current. With the increase in current the width and the depth of weld pool increases. The increased size of dendrites was found in the weld with an increase in current. At low gas flow rate the atmospheric gases can easily enter into the shielding gas column and increases the weld contamination with reduced penetration. As the flow rate increase shielding gas column becomes laminar in nature and prevents the inclusion of atmospheric gases into the weld pool. But for Argon gas the average gas flow rate for should be considered. The microstructure results indicated the improvement in the weld pool of the joint when using filler Rod.
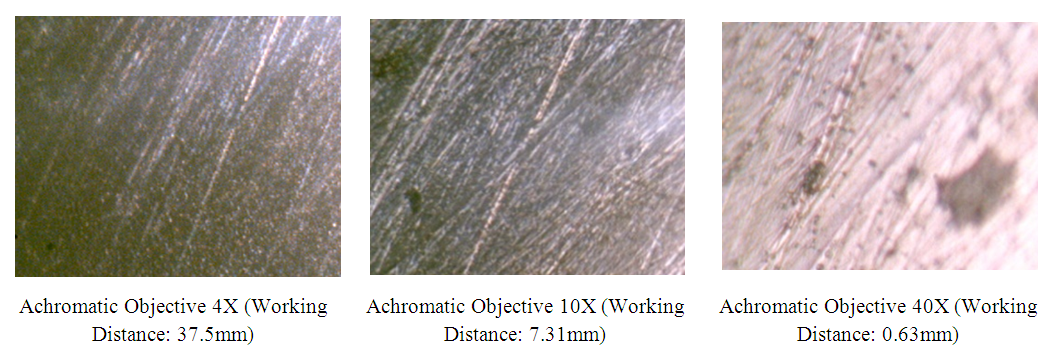
Figure 9. Micro structures of Welded zone for the optimized parameters of 30 Amps Current, 5 Lit/Min and 2.4 mm Filler rod
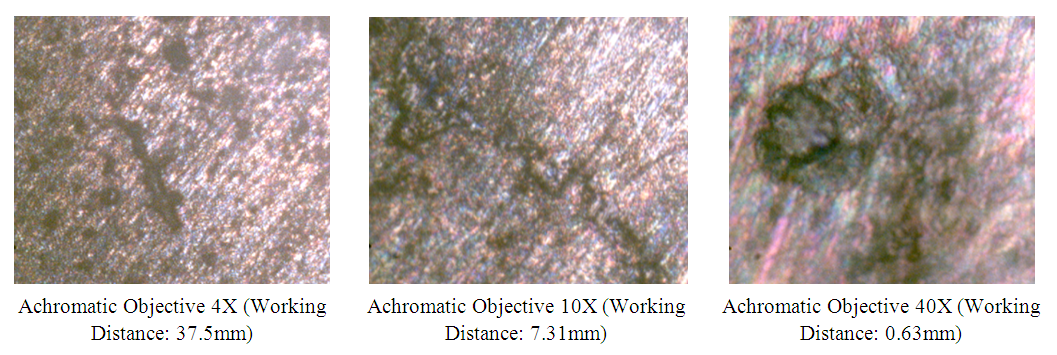
Figure 10. Micro structures of Heat affected zone for the optimized parameters 30 Amps Current, 5 Lit/Min and 2.4 mm Filler rod
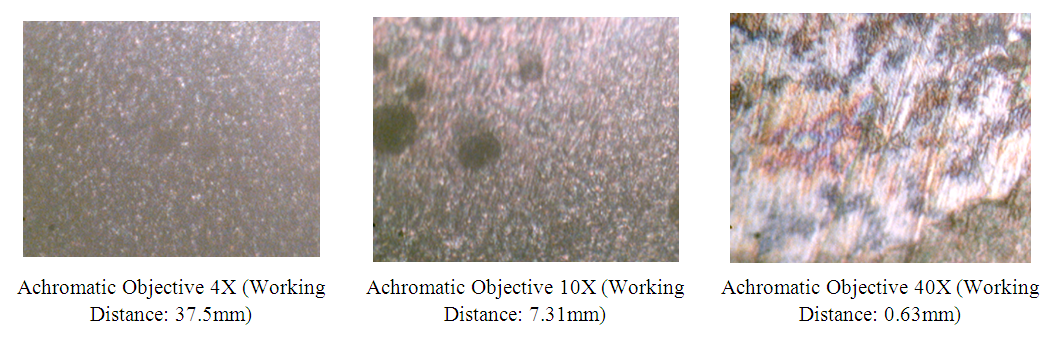
Figure 11. Micro structures of Welded zone for the optimized parameters of 40 Amps Current, 5 Lit/Min and 1.6 mm Filler rod
Figure 12. Micro structures of Heat affected zone for the optimized parameters 40 Amps Current, 5 Lit/Min and 1.6 mm Filler rod

5. Conclusions

During the study, mild steel sheets were joined using TIG welding process. The Radiographic test, Liquid Penetration test and microstructural study of welded joints were investigated. Tungsten Inert Gas Welding is more suitable for welding of mild steel sheets, TIG welding process provides better strength. It may be because of less porosity in welds during TIG welding and carbon precipitation which comes out due to welding is also less. The low percentage of free carbon allows the product better corrosion resistivity, ductility and strength. Lack Of Penetration, Under Cut, Rounded Indication, Surface Defect, Root Under Cut and Microstructure of the weld joint depends on the welding parameters like Welding current, Filler rod diameter and Gas flow rate. The Radiographic test, Liquid Penetration test and microstructural study was performed on the basis of L9 orthogonal array. The Microstructural study results comprises of Porosity, Nodularity and Grain Size. It was observed that with the increase in current the width and the depth of weld pool increases. And for Argon gas the average gas flow rate for should be considered. When using filler Rod the microstructure indicates the improvement in the weld pool of the joint.

References

[1]  Kohyama, Y. Kohno, K. Baba, Y. Katoh and A. Hishinuma, Microstructural changes in welded joints of 316 SS by dual-ion irradiation, Journal of Nuclear Materials, 191-194; 722-727, 1992.
[2]  Ahmet Durgutlu, Experimental investigation of the effect of hydrogen in argon as a shielding gas on TIG welding of austenitic stainless steel, Materials and Design, 25, pp- 19–23, 2004.
[3]  Peng Liu, Yajiang Li, HaoranGeng, Juan Wanget, Microstructure characteristics in TIG welded joint of Mg/Al dissimilar materials, Materials Letters, 61, 1288- 1291, 2007.
[4]  M. Ahmad, J. I. Akhter, M. Akhtar M. Iqbal, Microstructure and characterization of phases in TIG welded joints of Zircaloy-4 and stainless steel 304L, J Mater Sci.,42, 328–331, DOI 10.1007/s10853-006- 1028-1, 2007.
[5]  B.Y. Kang, Yarlagadda K.D.V. Prasad, M.J. Kang, H.J. Kim, I.S. Kim, The effect of alternate supply of shielding gases in austenite stainless steel GTA welding, Journal of Materials Processing Technology, 209, pp-4722–4727, 2009.
[6]  S. P. Gadewar, Peravali Swaminadhan, M. G. Harkare, S. H. Gawande, Experimental investigations of weld characteristics for a single pass tig welding with SS304, International Journal of Engineering Science and Technology Vol, 2(8), pp 3676-3686, ISSN: 0975-5462, 2010.
[7]  Rui-Hua Zhang, Ji-Luan Pan, Seiji Katayama, The mechanism of penetration increase in A-TIG welding, Higher Education Press and Springer-Verlag Berlin Heidelberg, Front. Mater. Sci, 5(2), 109–118, DOI 10.1007/s11706-011-0125-5, 2011.
[8]  Balaji, S.V. Abinesh Kumar, S. Ashwin Kumar, R. Sathish, Evaluation of mechanical properties of SS 316 L weldments using tungsten inert gas welding, International Journal of Engineering Science and Technology, Vol. 4, ISSN: 0975-5462, 2012.
[9]  Dheeraj Singh, Vedansh Chaturvedi, Jyoti Vimal, Parametric optimization of TIG process parameters using Taguchi and Grey Taguchi analysis, International Journal of Emerging Trends in Engineering and Development, ISSN 2249-6149, 2013.
[10]  Cheng-HsienKuo, Kuang-Hung Tseng, Chang-Pin Chou, Effect of activated TIG flux on performance of dissimilar welds between mild steel and stainless steel, Key Engineering Materials Vol. 479, pp 74-80, 2011.
[11]  Weman, Klas, Welding processes handbook. New York: CRC Press LLC. , 2003.
[12]  Jitender Bansal, Umed Kumar Khod, Deepak Kumar., Optimize The Various Effects Of Welding Parameters Of Al Plate By Tig Welding, International Journal Of Technical Research (IJTR) Vol. 4, Issue 2, PP 29-32, 2015.
[13]  Sharma V., Misrab J. P., Singhala P., Optimization of process parameters on Combustor Material Using Taguchi & MCDM Method in Electro-Discharge Machining (EDM), Materials Today: Proceedings, 18, 2019.
[14]  Kumar D., Mondal S., Process parameters optimization of AISI M2 steel in EDM using Taguchi based TOPSIS and GRA, Materials Today: Proceedings, 26(2), 2020.
[15]  Viswanathan R.,. Ramesh S., Maniraj S., Subburam V., Measurement and multi-response optimization of turning parameters for magnesium alloy using hybrid combination of TaguchiGRA-PCA, Measurement, 159, 2020.
[16]  Liu S.J., C.-H. Lin, and Y.-C. Wu, “Minimizing the sinkmarks in injectionmolded thermoplastics,” Advances in Polymer Technology, 20(3), 2001.
[17]  Lan T.S., M.-C. Chiu, and L.-J. Yeh, “An approach to rib design of injection molded product using finite element and Taguchi method,” Information Technology Journal, 7(2), 2008.
[18]  Asafa T. B., Tabet N., Said S.A.M, Taguchi method–ANN integration for predictive model of intrinsic stress in hydrogenated amorphous silicon film deposited by plasma enhanced chemical vapour deposition, Neurocomputing, 106, April, 2013.
[19]  Jorge Luiz; Robin, Alain; Silva, M. B.; Baldan, Carlos Alberto; Peres, Mauro Pedro. "Electrodeposition of copper on titanium wires: Taguchi experimental design approach". Journal of Materials Processing Technology. 209 (3), PP: 1181–1188, 2009.
[20]  Rahul Davis and Pretesh John, Application of Taguchi-Based Design of Experiments for Industrial Chemical Processes, intechopen book publishers, Chapter 9, PP: 137-155, 2018.
[21]  J. Du, X. Lu, J. Qu, Q. Deng, J. Zhuang, Acta Metall. Sin. 19 (6), PP: 418–424, 2006.
[22]  Ťavodová, M., Hnilicová, M. and Švantner T.: Proposal of use of welded joints EN AW-6082 for adapters of forest technic, Manufacturing technology, Vol. 19, PP: 706-711, Aug. 2019.
[23]  Svobodova, J.: Failures Caused by Heat Treatment and Their Identification, Manufacturing Technology, Vol. 17, No. 6, PP: 969-972, 2017.
[24]  Patek, M. et al.: Destructive testing of the weld joints on split sleeve for branch connections repairs, Communications, Vol. 4, PP: 65-69, 2015.
[25]  Li, Y., Shuai, J. and Xu, K.: Investigation on size tolerance of pore defect of girth weld pipe, PLoS ONE, Vol. 13, Iss. 1, No. e0191575, 2018.
[26]  https://www.binzel-abicor.com/US/eng/solutions/main-focus/thin-sheet-welding.
[27]  Callister W, Fundamental of Materials Science and Engineering (John Wiley & Sons Inc), 2001.
[28]  Yauso Suga*, Kouichiro Kojima and Tetsuro Tominaga, “Detection of Weld Defects by Computer-Aided X-Ray Radiography Image Processing” International Journal of Offshore and Polar Engineering Vol. 5, No. 2, (ISSN 1053-5381), June 1995.
[29]  Marcelo Kleber Felisberto, Heitor Silvério Lopes, Tania Mezzadri Centeno, ”An object detection and recognition system for weld bead extraction from digital radiographs”, Computer Vision and Image Understanding, Volume 102, Issue 3, PP: 238-249, 2006.
[30]  Marek Opiela, Gabriela Fojt-Dymara, Adam Grajcar, and Wojciech Borek, Effect of Grain Size on the Microstructure and Strain Hardening Behavior of Solution Heat-Treated Low-C High-Mn Steel, Materials 2020, 13, 1489, PP: 1-13; doi:10.3390/ma13071489, 2020.