-
Paper Information
- Paper Submission
-
Journal Information
- About This Journal
- Editorial Board
- Current Issue
- Archive
- Author Guidelines
- Contact Us
American Journal of Materials Science
p-ISSN: 2162-9382 e-ISSN: 2162-8424
2021; 11(1): 1-9
doi:10.5923/j.materials.20211101.01
Received: Jan. 5, 2021; Accepted: Jan. 20, 2021; Published: Jan. 25, 2021

Synthesis and Characterization of Zinc Oxide (ZnO) Nanoparticles & Tris(8-Hydroxyquinoline) Aluminium (Alq3) as Material Constituents for Fabrication of Alq3/ZnO Nanocomposite Systems
 Abstract
 Reference
 Full-Text PDF
 Full-text HTML
Chisomo Daka1, Rupam Mukherjee2
1Malawi University of Science & Technology (MUST), Malawi Institute of Technology (MIT), Dept. of Applied Studies, Physics Section, Along Thyolo-Goliati Road, Malawi
2Lovely Professional University, School of Chemical Engineering and Physical Sciences, Department of Physics, Along Delhi-GT Road, Phagwara, India
Correspondence to: Chisomo Daka, Malawi University of Science & Technology (MUST), Malawi Institute of Technology (MIT), Dept. of Applied Studies, Physics Section, Along Thyolo-Goliati Road, Malawi.
| Email: |  |
Copyright © 2021 The Author(s). Published by Scientific & Academic Publishing.
This work is licensed under the Creative Commons Attribution International License (CC BY).
http://creativecommons.org/licenses/by/4.0/

We have studied optical and electrical properties of semiconducting Zinc Oxide (ZnO) nanoparticle systems and the fluorescent matrix of Tris-(8-Hydroxyquinoline) Aluminium (Alq3). To understand these properties we have synthesized ZnO nanoparticles of different particle sizes ranging from ~23 nm to ~110 nm via aqueous sol-gel technique followed by annealing at high temperature and prepared Alq3 compound of planar shaped micro particles. Alq3/ZnO nanocomposites which are prepared by mixing and grinding in specific volume fraction ratio are then used for measuring dielectric properties at room temperature. Measurement techniques like X-Ray Diffraction (XRD), Ultraviolet (UV) Spectroscopy and Fourier Transformation Infrared (FTIR) Spectroscopy are used to determine optical and chemical properties of ZnO and Alq3 constituents. In addition Field Effect Scanning Electron Microscopy (FESEM) together with Energy Dispersive X-Ray Spectroscopy (EDS/XDS) is used to study structural properties, particle morphology and elemental phase analysis of ZnO nanoparticles and Alq3 powder. An impedance analyser of frequency range 20 Hz to 25 KHz is further used to determine dielectric constant of varying composition of Alq3 and ZnO in Alq3/ZnO nanocomposite systems. Overall this paper intends to report the synthesis and fabrication techniques, and characterization of composite materials derived from ZnO and Alq3. We further give an outline of some of the promising applications in organic electronics like organic light emitting diodes (OLEDs), organic photovoltaic cells (OPVC) etc.
Keywords: Nanocomposite, Photoluminescent, Energy Bandgap, Dielectric, Morphology
Cite this paper: Chisomo Daka, Rupam Mukherjee, Synthesis and Characterization of Zinc Oxide (ZnO) Nanoparticles & Tris(8-Hydroxyquinoline) Aluminium (Alq3) as Material Constituents for Fabrication of Alq3/ZnO Nanocomposite Systems, American Journal of Materials Science, Vol. 11 No. 1, 2021, pp. 1-9. doi: 10.5923/j.materials.20211101.01.
Article Outline
1. Introduction
- Ever since the discovery of highly conducting polymers as it was reported in 1977 by Heeger A.J., MacDiarmid A.G. and Shirakawa H. [1], who eventually received the 2000 Nobel Prize in chemistry for the discovery and development of conductive polymers [2], there has been an ever increasing research interest in studying the electronic and optical properties associated with organic semiconductor materials. In essence this obsession was mainly stimulated by the belief that organic semiconductor materials together with their promising properties could be the best material alternatives to replace the inorganic semiconductor materials in electronic and optoelectronic device applications [3].Evidently, specialized fields like plastic electronics and the physics of organic semiconductors emerged primarily to fill up the knowledge gap brought by the discovery of these conducting polymers and to promote research studies aimed at enhancing our understanding of these conjugated polymers [4]. One of the most peculiar properties attributed to these conducting polymers is their structural flexibility which has recently been exploited to aid in designing highly efficient organic light emitting diodes (OLEDs) in foldable multi display panels as is the case with portable devices like smartphones, thin-film field-effect transistors (TFTs) and organic photovoltaic cells (OPVC) for making efficient and low-cost solar energy conversion devices [5] [6] [7]. Electronic and optoelectronic devices are however very sensitive devices and usually work well within specified boundary conditions. Hence any design attempts that require advanced application of these conducting polymers necessitates the requirement for having precise calibration and high optimization of material properties which are in some ways derived from heterogeneous material constituents [8]. In particular, we may consider optimization of charge injection (or extraction) and charge carrier transport. These techniques and many others like optimization of quantum efficiency are very crucial in enabling technological success in the listed applications. In optoelectronic organic semiconductor device applications like organic light emitting diodes (OLEDs), Tris-(8-Hydroxyquinolines) Aluminium (Alq3) is one of the well-known and commonly used industrial materials for manufacturing such devices. Alq3 has a wide spectrum of desirable properties for the purpose which includes good thermal stability, high fluorescence activity, and good electron mobility. This is why it is mostly used as electron transport layer in organic optical devices. Moreover Alq3 is easy to synthesize with low cost techniques. The highlighted properties and many others qualify Alq3 as an ideal host emitting material in OLED devices. Nevertheless, it has been reported that environmental aging compromises stability and photoluminescent efficiency in most devices based on Alq3 [9]. In an effort to overcome the stated material deficiencies; recent studies have reported that Alq3/Zinc Oxide (ZnO) nanocomposites exhibit improved stability and achieve relatively higher values of photoluminescent efficiency in light emitting devices as compared to the bare Alq3 compound [10] [11]. Figure 1 below illustrates the molecular structure of Alq3 (Right) and depicts its usage as an electron transport layer (ETL) and luminophore (i.e. emissive layer) in a bilayer OLED device (Left).
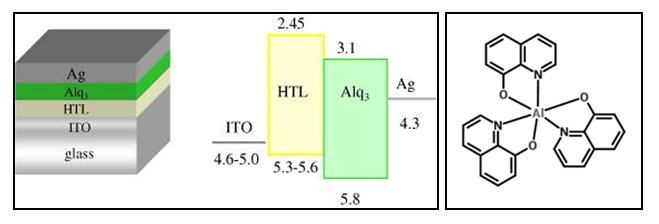 | Figure 1. Alq3 luminophore in a bilayer OLED device (Left) and Alq3 Molecular Structure (Right) [12] |
2. Experiment & Methodology
- This section mainly describes the experimental setups used in this research work. It also lays down a detailed description of synthesis and fabrication techniques that were used for preparation of all the materials and their respective composites.
2.1. Materials & Tools
- Materials used in our experimental setup were purchased from different chemical dealers based on availability and the desired purification quality. For the synthesis of Zinc Oxide (ZnO), the main reagents were Zinc Acetate Dihydrate ([Zn(CH3CO2)2].2H2O), Sodium Hydroxide (NaOH), Ethanol (C2H5OH) and distilled water (H2O). Furthermore, the reagents used for the synthesis of Tris-(8-Hydroxyquinoline) Aluminium (Alq3) [Al(C9H6NO)3] were essentially 8-Hydroxyquinoline (C9H7NO), Aluminium Nitrate [Al(NO3)3], Ammonium Hydroxide [(NH4)OH] and Isopropyl Alcohol (i.e. Isopropanol) (C3H7OH). The experimental tools included general chemistry glassware (i.e. beakers, stirring rods, dishes etc.), spatula, magnetic stirrers, sample bottles, scintillation oven, thermometers, mortar & pestle, crucible, pellet making machine (i.e. die assembly set), digital weighing scale etc.
2.2. Synthesis Techniques
- Two types of materials were basically prepared (i.e. ZnO nanoparticles and Alq3 yellow-green powder respectively) each with its own synthesis procedure and techniques as described in the subsections (2.2.1) and (2.2.2). Alq3/ZnO nanocomposites were also fabricated in assorted weight fraction rations as described in subsection (2.2.3).
2.2.1. Synthesis of ZnO Nanoparticles
- Zinc Oxide (ZnO) nanoparticles were produced via the novel low cost clear cut aqueous sol-gel nanoparticle synthesis procedure described by Bolla G. (2017) [13]. This technique involved the reaction of Zinc Acetate Dihydrate ([Zn(CH3CO2)2].2H2O) and Sodium Hydroxide (NaOH) in an aqueous environment brought about by the presence of distilled water where ethanol (C2H5OH) was the common solvent for the two reagents. Firstly, a mass of 16.50g of [Zn(CH3CO2)2].2H2O was dissolved in 100ml of distilled water contained in a 500ml beaker and a corresponding mass of 12.00g of NaOH was dissolved in 150ml of distilled water in a 250ml beaker. Both of the two solutions were stirred separately for 5 minutes followed by a dropwise mixture of the NaOH solution into the 500ml beaker containing the [Zn(CH3CO2)2].2H2O solution heated to 80°C under a continuous magnetic stirring condition for 15 minutes. Then 150ml of Ethanol (C2H5OH) was added dropwise into the mixture under the same stirring conditions. White Precipitates of ZnO nanoparticles were formed upon mixing every drop of C2H5OH. The white precipitate was filtered on filter paper and cleansed for about 6 to 8 times using distilled water and then left to dry at room temperature. The dried white precipitate was then scintillated in an oven at an average temperature of 450°C for 5hrs. Finally the scintillated sample was crushed using a mortar and pestle to make fine ZnO powder which was later on used for material characterization and composite formation.
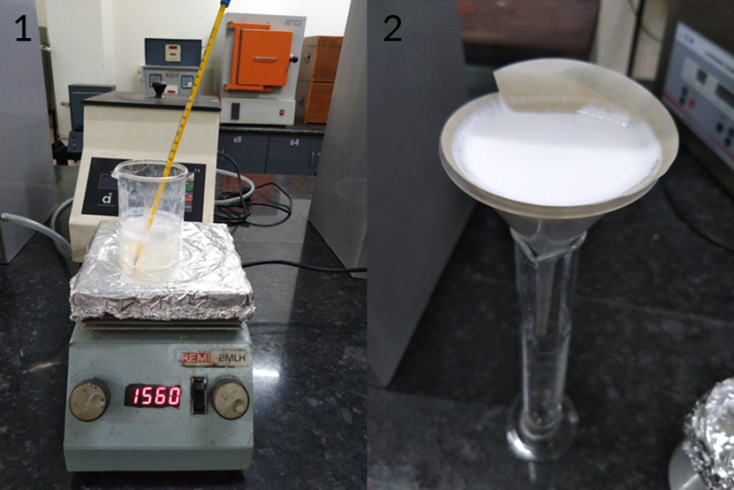 | Figure 2. Synthesis of ZnO Nanoparticles (LPU, Condensed Matter Physics Lab: Block 27-310) |
2.2.2. Synthesis of Alq3 Compound
- The following procedure was largely adopted from the literature by J.G. Mahakhode, et al. (2006) [14] with slight deviations on a few steps. Tris-(8-Hydroxyquinoline) Aluminium (Alq3) [Al(C9H6NO)3] powder was produced by dissolving 17.42 grams of 8-Hydroquinoline (C9H7NO) in 150ml of isopropyl alcohol (i.e. Isopropanol) [C3H7OH] contained in a 500ml beaker and 15.00 grams of Aluminium Nitrate [Al(NO3)3] was dissolved in 150ml of distilled water (H2O) contained in a separate 250ml beaker under a constant stirring condition for 10 minutes at room temperature. The aqueous solution of Al(NO3)3 was then added dropwise with continued stirring to the C9H7NO [dissolved in C3H7OH] solution to create a homogeneous reaction mixture for 15 minutes. Finally, 30ml of Ammonium Hydroxide [(NH4)OH] was precisely added dropwise as a precipitating agent to the reaction mixture while maintaining constant stirring. A yellow-green precipitate of Alq3 was formed upon addition of each drop of (NH4)OH until all the 30ml were drained. Precipitated Alq3 sample was left to settle at the bottom of the beaker and then filtered using filter paper. The Alq3 filtrate was carefully cleansed with distilled water for 6 to 8 times to wash away residual reagents, reaction by-products and excess solvents. The filtered sample was completely dried in an oven at 85°C to evaporate residual isopropanol and then cooled slowly back to room temperature. Finally the yellow-green Alq3 compound was crushed to form a fine powder sample using mortar and pestle thus allowing it to be utilized fully in characterization experiments and in making composite pellets.
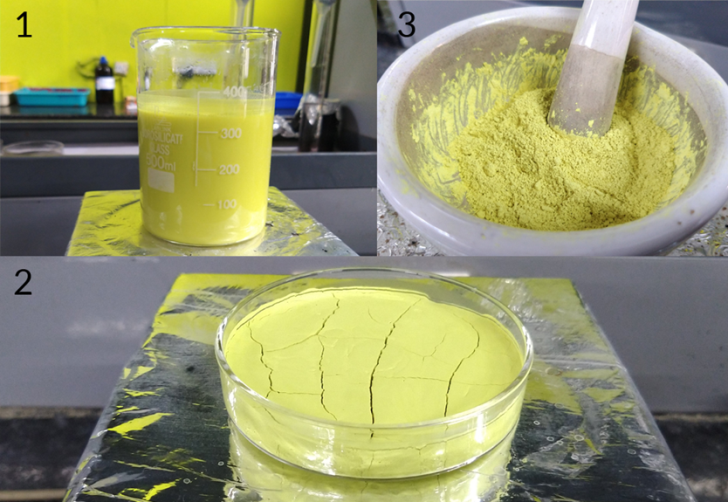 | Figure 3. Preparation of Alq3 Compound (LPU, Condensed Matter Physics Lab: Block 27-310) |
2.2.3. Fabrication of Alq3/ZnO Nanocomposites
- Material composites of Alq3/ZnO were fabricated in form of circular pellets on the basis of weight fraction percentage. Each pellet had a radius of ~12mm and an approximate total mass of 0.20 grams composed form the respective weight fractions of Alq3 and ZnO compounds. The first set of pellet composites were made by mixing one part of ZnO and three parts of Alq3 (i.e. 25wt% ZnO and 75wt% Alq3) to make up 0.20 gram pellets. The second set of pellet composites were made by mixing one part of ZnO and one part of Alq3 (i.e. 50wt% ZnO and 50wt% Alq3) to make up 0.20 gram pellets. Similar pellets of equal radium and mass were fabricated from bare Alq3 compound as a control variable for the experiments carried afterwards. Figure 4 below shows how the fabricated Alq3/ZnO composite powders together with the bare Alq3 compound responds to white-light and UV-light exposure while Figure 5 shows the UV-light exposure in liquid composites. Other techniques like spin-coating are at times employed to prepare highly transparent Alq3/ZnO hybrid thin films with enhance photoluminescence [30].
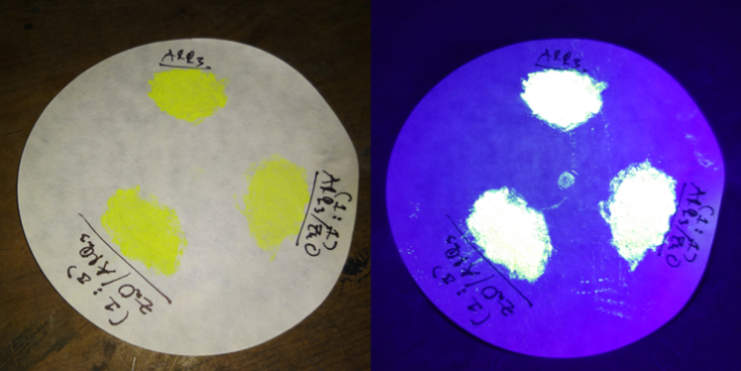 | Figure 4. White Light (Left) and UV-Light (Right) exposure of Alq3 and Alq3/ZnO composites |
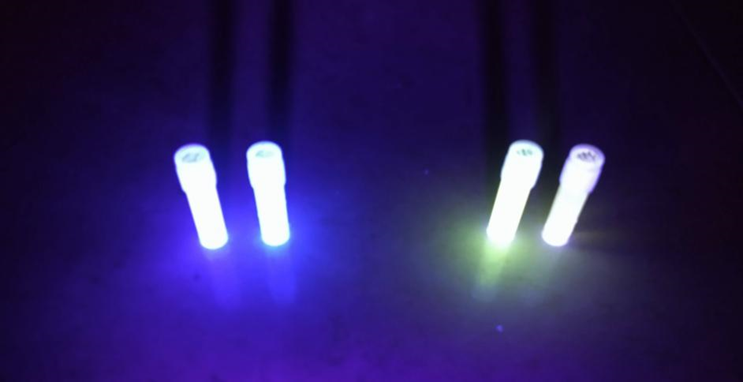 | Figure 5. UV Light exposure of ZnO nanoparticles (Right) solution and Alq3/ZnO liquid composites of different concentrations showing Blue Light and Green Light Photoluminescence respectively |
3. Results and Discussion
- A couple of characterization experiments were carried out on the synthesized ZnO nanoparticles, Alq3 bare compound and the fabricated Alq3/ZnO pellet composites. Firstly, for the synthesized ZnO and Alq3 compounds we studied XRD patterns, UV- Spectroscopy and FTIR. FESEM was also studied along with EDS/XDS. As for the Alq3/ZnO composites, we carried out dielectric experimental characterizations. The following subsections describe the results of experimentation and discuss the structural analysis, elemental analysis, optical absorbance measurements and the dielectric properties of the synthesized compounds and fabricated composites.
3.1. Structural Analysis (FESEM & XRD)
- The structural properties of the synthesized zinc oxide (ZnO) nanoparticles and Tris-(8-Hydroxyquinoline) Aluminium (Alq3) compound were firstly studied using FESEM as shown in Figure 6 and 7. In Figure 6, the results obtained from FESEM show that the ZnO nanoparticles were of different sizes and shapes. Actual particle size measurements on the synthesized ZnO nanoparticles ranged from ~23nm to ~110nm with irregular shapes. This observation is typical of a complex aqueous sol-gel procedure on one hand due to the prevailing high reactivity of the metal oxide precursors with water (and also that water plays a double role as ligand and solvent) and on another hand due to a wide range of reaction parameters that need to be controlled with high precision (i.e. hydrolysis & condensation rate of the metal oxide precursors, temperature, pH, mixing procedure, oxidation rate, the nature & concentration of anions, etc.) in order to provide good reproducibility of the synthesis protocol. This level of complexity attributed to the aqueous sol-gel technique makes it cumbersome to synthesize metal oxide nanoparticles with higher levels of purity and homogeneity. It is also hard to maintain well-defined and uniform crystal morphologies of the synthesized nanoparticles [15] [16].In Figure 7, FESEM results of the prepared yellow-green Alq3 powder however showed a structural morphology of clustered rod-like structures with irregular cross-sections. The longitudinal measurements of the rod-like structural segments greatly varied from ~0.8µm to ~3.4µm. Similar results showing the distributed rod-like structures of yellow-green Alq3 powder were reported by Tingxi Li, et al. (2016) [9] with the main difference being that in their case the Alq3 compound had a morphology with homogeneous shape and size.
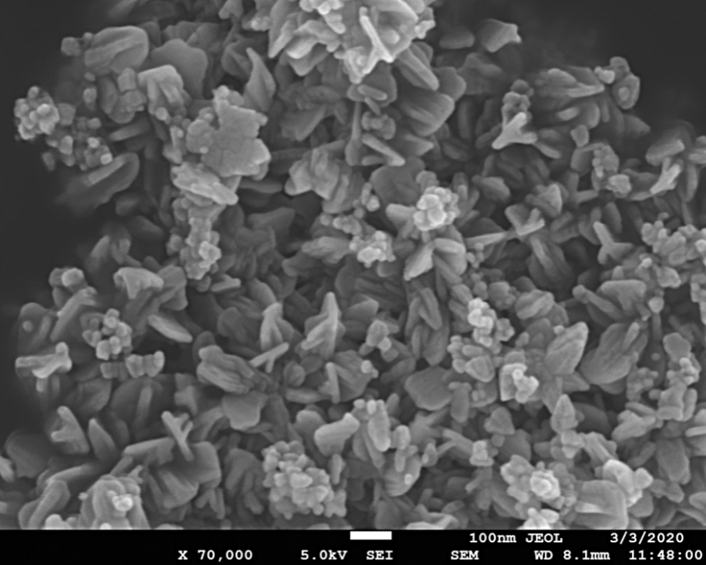 | Figure 6. FESEM of Zinc Oxide (ZnO) nanoparticles with different structural shapes and sizes |
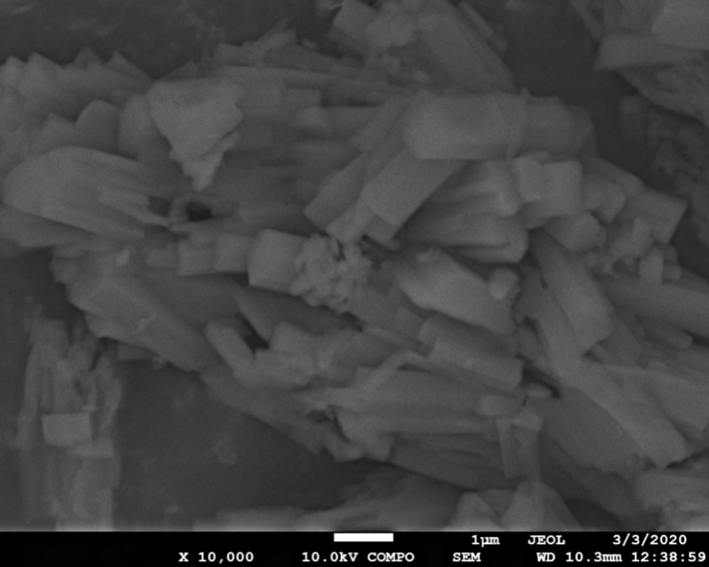 | Figure 7. FESEM of Alq3 yellow-green luminescent powder composed of planar micro structures |
 , c = 5.2057
 which then gives us an approximate hexagonal unit cell volume V = 47.60 Å3 when calculated using the formula shown in equation (1) below.
 | (1) |
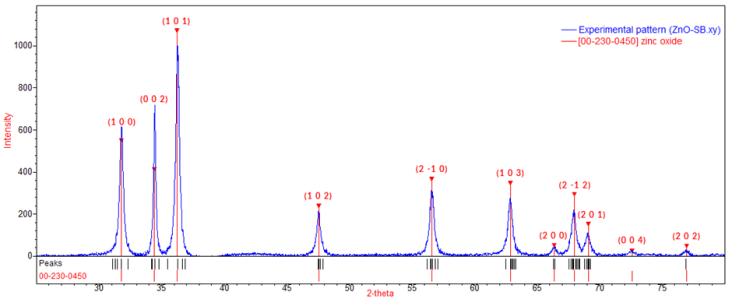 | Figure 8. XRD pattern of Zinc Oxide (ZnO) nanoparticles – Analysed using QUALX2.0 Software |
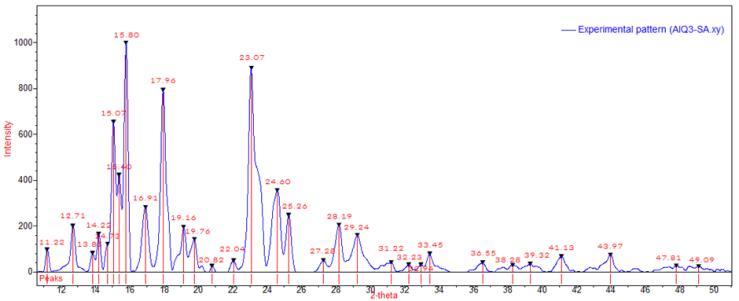 | Figure 9. XRD pattern of Alq3 yellow-green powder - Analysed using QUALX2.0 Software |
3.2. Elemental Analysis (EDS/XDS)
- Elemental analysis for the synthesized ZnO nanoparticles and Tris-(8-Hydroxyquinoline) Aluminium (Alq3) yellow-green powder was studied using Energy Dispersive X-Ray Spectroscopy (EDS/XDS) embedded to the FESEM. The actual elemental analysis of the ZnO and Alq3 was conducted on FESEM electron images of the respective samples aided by the Oxford Instruments software platform. The corresponding results were then determined as shown in Figure 10 and 11 below. For the ZnO nanoparticles, Zinc (Zn) constituted 79.8 Wt. % whereas Oxygen (O) constituted 20.2 Wt. % of the ZnO molecular weight. This result conforms to calculated theoretical atomic weight ratios of Zn and O atoms in ZnO molecule.
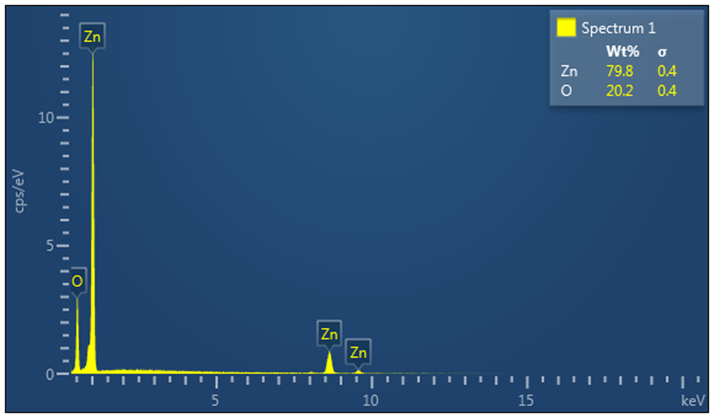 | Figure 10. EDS/XDS spectrum for elemental constituent analysis of ZnO nanoparticles |
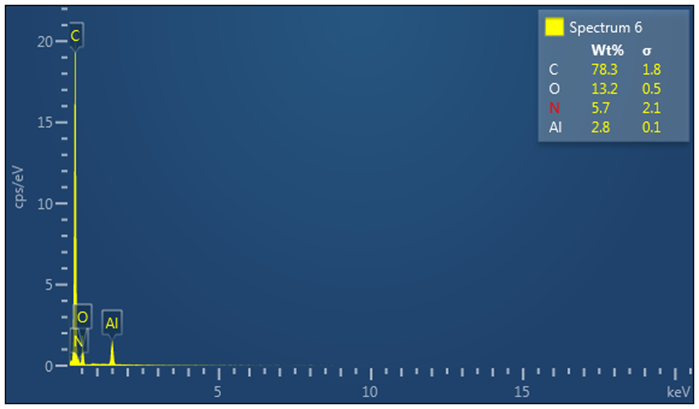 | Figure 11. EDS/XDS spectrum for elemental constituent analysis of Alq3 yellow-green powder |
3.3. Optical Measurements (FTIR & UV-Visible)
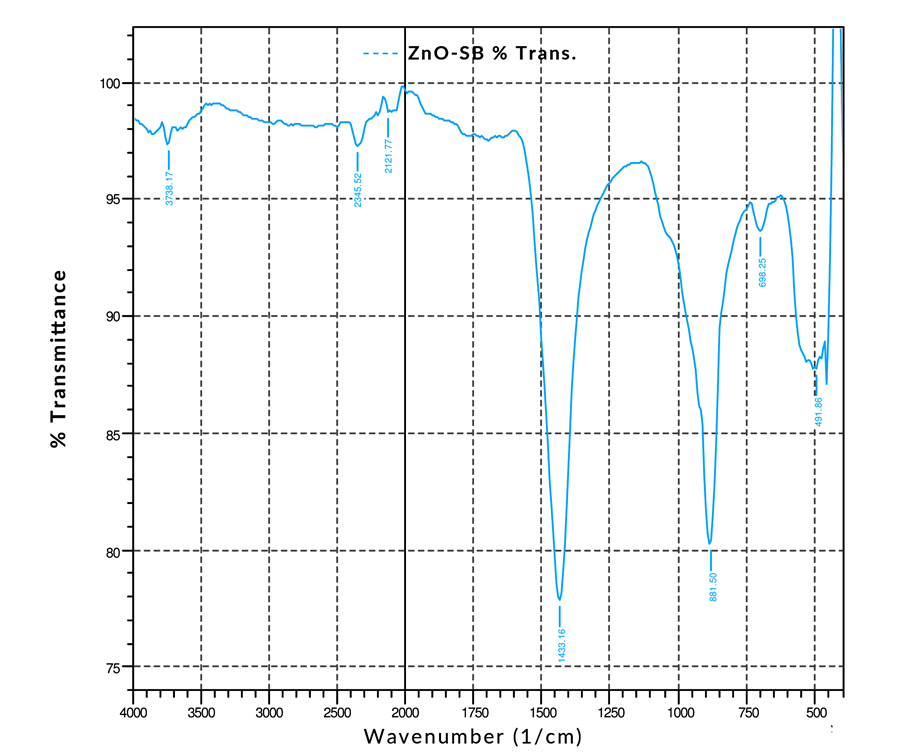
- Optical measurements were studied using Fourier Transform Infrared (FTIR) Spectroscopy and UV-Visible Spectroscopy as illustrated in Figure 12 and Figure 13. The transmittance spectrum of Alq3 yellow-green powder and ZnO nanoparticles are shown in Figure 12 and 13 respectively. The percentage transmittance FTIR spectrum of Alq3 yellow-green powder in Figure 12 displays the entire characteristic absorbance of quinoline and the Al+ ion with ligands. The observed characteristic bands within the range of 600-800 cm-1 have been reported to originate from the vibrations of quinoline, hence the band in the range of 400-600 cm-1 can be attributed to the stretching vibration of Al+ ion with ligands. In contrast with the normal FTIR absorption spectrum of quinoline, the intensive band of C-O at 1112.00 cm-1 and the weaken band at 1281.74 cm-1 is a direct indication that the Al-O bond had formed in the prepared Alq3 material [20].On the other hand, the peak shown in Figure 13 at 491 cm-1 for the ZnO nanoparticle absorbance spectrum is characteristic of the existence of Zn-O bond. The other absorption peaks registered along the FTIR spectrum indicates the presence of carboxylate and hydroxyl impurities in the synthesized ZnO nanoparticles which is in accordance with other results obtained from independent studies [21] [22].
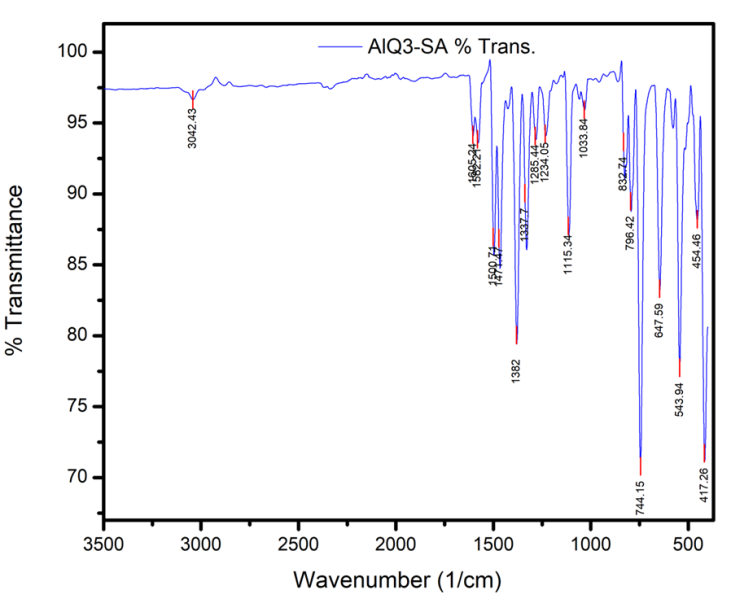 | Figure 12. FTIR Transmittance Spectrum for Alq3 yellow-green powder |
 | Figure 13. FTIR Transmittance Spectrum for ZnO nanoparticles |
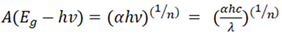 | (2) |
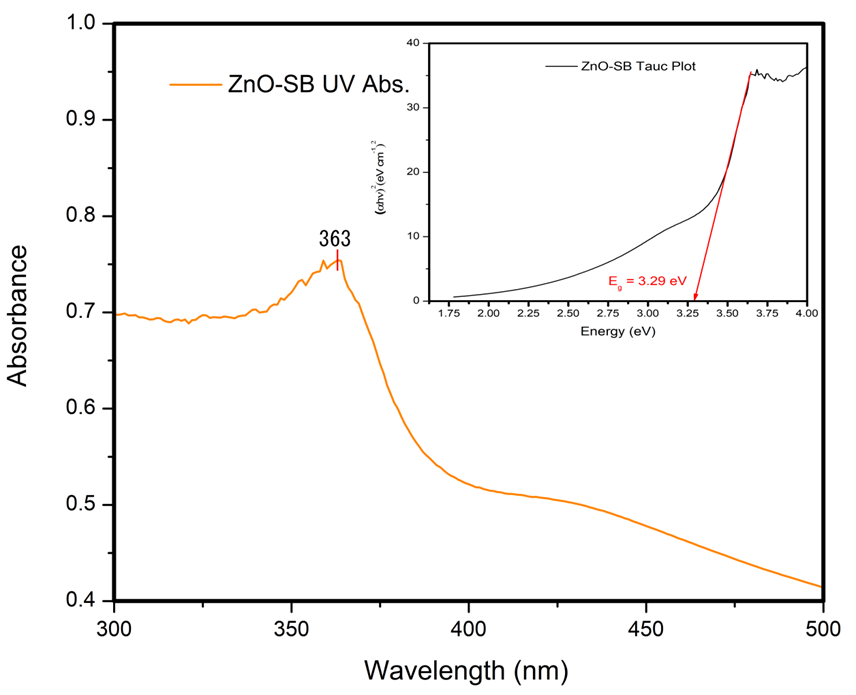 | Figure 14. UV-visible Absorbance Spectrum and Tauc Plot of ZnO nanoparticles |
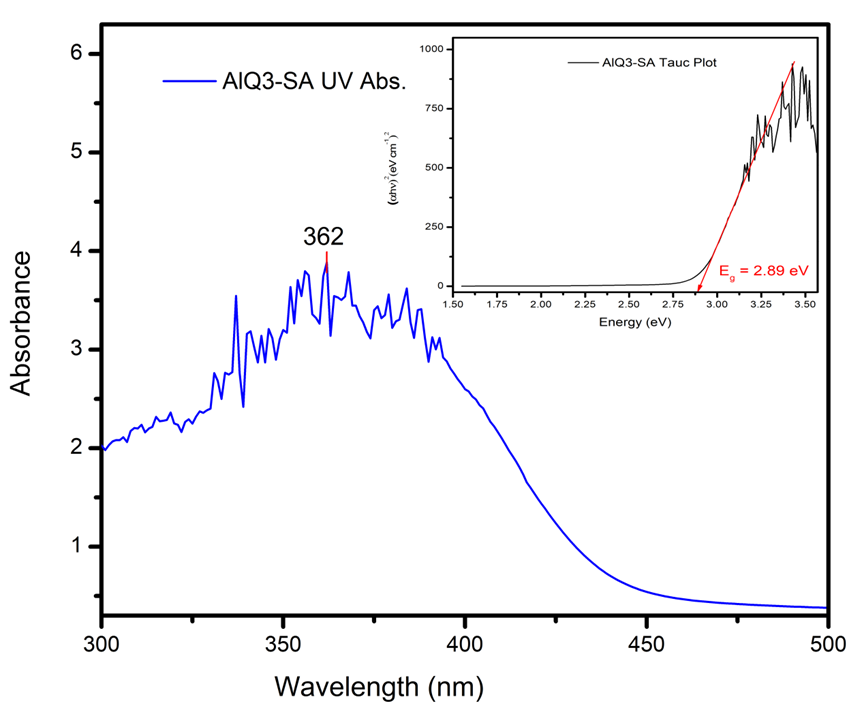 | Figure 15. UV-visible Absorbance Spectrum and Tauc Plot of Alq3 yellow-green powder |
3.4. Dielectric Measurements
- Dielectric properties of the Alq3 yellow-green luminescent powder and the fabricated Alq3/ZnO composites were studied as shown below in Figure 16 and 17. The general understanding from the results obtained is that the average capacitance of Alq3 yellow-green powder increased as the weight percentage of ZnO in Alq3/ZnO was increased. We also observed that the capacitive reactance at lower frequencies for each material composite of Alq3/ZnO was relatively higher compared to the reactance at higher frequency range. This meant that the capacitive reactance for the fabricated materials was inversely proportional to frequency as illustrated by the curve in Figure 16. The established observation is in agreement with the well-known relation between reactance and frequency as shown in equation (3) below.
 | (3) |
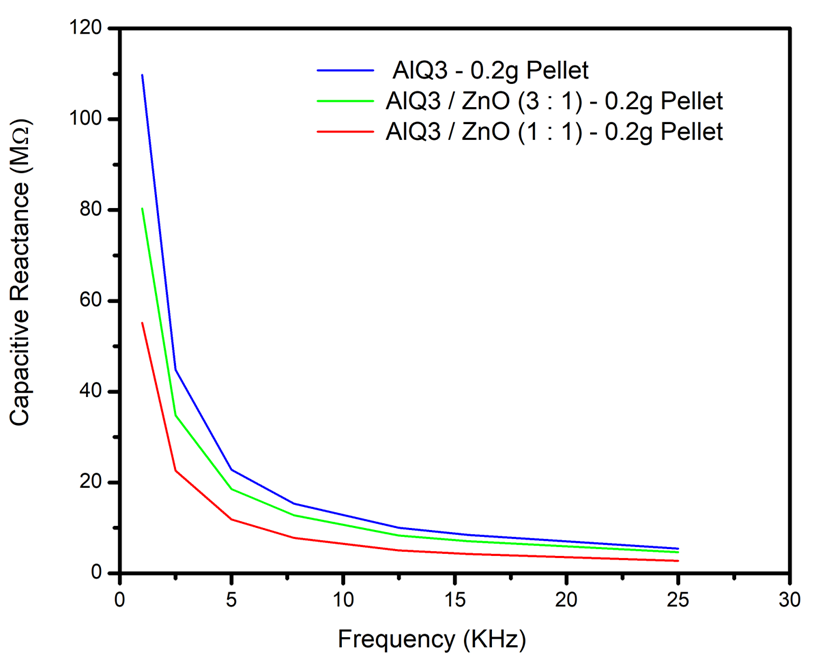 | Figure 16. Capacitive Reactance (MΩ) Vs. Frequency (KHz) of Alq3 & Alq3/ZnO nanocomposites |
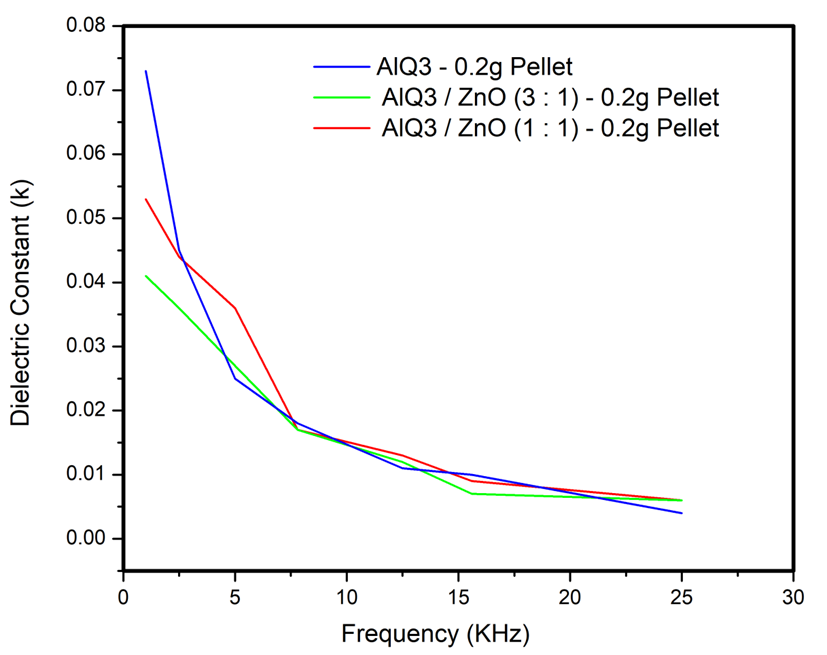 | Figure 17. Dielectric Constant (k) Vs. Frequency (KHz) of Alq3 & Alq3/ZnO nanocomposites |
4. Conclusions
- Zinc Oxide (ZnO) nanoparticles were prepared via aqueous sol-gel technique followed by the synthesis of Tris-(8-Hrdroxyquinoline) Aluminium (Alq3) yellow-green powder. XRD studies indicated the presence of a hexagonal crystal structure in ZnO nanoparticles with particle sizes ranging from ~23nm to ~110nm as observed on FESEM. Alq3 compound showed a cubic unit cell structure with planar shaped micro particles having impurity patterns due to carboxylate and hydroxyl impurities as suggested by FTIR observations. Both ZnO and Alq3 exhibited fluorescence of blue light and green light respectively when exposed to UV radiation. Further optical studies indicated the existence of a considerably wider optical band gap of ~3.29 eV for the ZnO nanoparticles as compared to the ~2.89 eV for Alq3 powder. Thus nanocomposites of Alq3/ZnO can be exploited as prospective blue-light luminophore in organic light emitting diodes (OLEDs) or as receptors in organic photovoltaic cells (OPVC) by fine-tuning their associated optical band gap characteristics hence shifting the emission spectra. Nanocomposites of Alq3/ZnO also revealed good dielectric properties. The capacitive reactance of Alq3/ZnO was greatly reduced by increasing the weight % composition of ZnO from 0% to 25% and then to 50% in fabricated Alq3/ZnO circular shaped pellets, each having an equal net pellet weight of 0.2 grams and an equal pellet radius of ~12 mm. Future studies can be conducted to exploit these promising material properties of Alq3/ZnO nanocomposites to improve optical device stability and quantum efficiency of OLEDs, OPVCs and organic electrolytic photo-capacitors (OEPCs).
ACKNOWLEDGEMENTS
- We would like to express our deepest appreciation to the management of the Department of Physics at Lovely Professional University (LPU), which is currently headed by Dr. Kailash Chandra Juglan, for the privilege of working in the Condensed Matter Physics (CMP) laboratory and also for providing us with experimental tools, materials and all necessary pieces of equipment. We also give thanks to Mr. Parminder Singh for his relentless commitment in assisting with experimental resource mobilization in the CMP Lab. Lastly we would like to thank the Division of Research and Development at LPU for their unmatched expertise in material characterization experiments like XRD, FESEM, EDS/XDS, UV visible and so on.