Ravikantha Prabhu1, Rahul M. P.1, Ajith Aeilias1, Bestin Sunny1, Alok J.1, Thirumaleshwara Bhat2
1Department of Mechanical Engineering, St Joseph Engineering College, Mangaluru, India
2Department of Mechanical Engineering, Shri Madhwa Vadiraja Institute of Technology and Management, Udupi, India
Correspondence to: Ravikantha Prabhu, Department of Mechanical Engineering, St Joseph Engineering College, Mangaluru, India.
| Email: |  |
Copyright © 2017 Scientific & Academic Publishing. All Rights Reserved.
This work is licensed under the Creative Commons Attribution International License (CC BY).
http://creativecommons.org/licenses/by/4.0/

Abstract
Many of our modern technologies require materials with unusual combination of properties that cannot be met by the conventional materials like metals, alloys, ceramics etc. For this purpose a new class of materials known as composite materials is being used. Among the different types of composite materials available, polymer matrix composites are very important and are used in many of the weight sensitive applications. They are known for their properties such as high strength-to-weight ratio, high stiffness-to-weight ratio, corrosion resistance etc. Through this work, the development and investigation of tribological property of epoxy glass composites filled with coconut shell powder (CSP). The CSP were reinforced in epoxy resin to prepare organic fiber reinforced composites of different compositions. Dry sliding wear and abrasive trials were conducted using a standard pin-on-disc test set up following a well-planned experimental schedule based on Taguchi’s orthogonal arrays. Taguchi’s technique helps in saving time and resources for large number of experimental trials and predicts the wear response of epoxy composites within the experimental domain. The findings of the experiments indicate that the wear rate is greatly influenced by various control factors. Analysis of variance (ANOVA) is performed on the measured data and signal-to-noise (S/N) ratios. An optimal parameter combination is determined which leads to minimization of the wear rate. The results showed that inclusion of the CSP in epoxy resin improved the wear resistance of the composites greatly. On the other hand presence of coconut shell powder (CSP) had a detrimental effect on the mechanical properties of the specimens.
Keywords:
Epoxy, Organic Fiber, Taguchi Method, Dry Sliding, ANOVA
Cite this paper: Ravikantha Prabhu, Rahul M. P., Ajith Aeilias, Bestin Sunny, Alok J., Thirumaleshwara Bhat, Investigation of Tribological Property of Coconut Shell Powder Filled Epoxy Glass Composites, American Journal of Materials Science, Vol. 7 No. 5, 2017, pp. 174-184. doi: 10.5923/j.materials.20170705.10.
1. Introduction
In the present world situation as a result of increasing demand for environment friendly materials and the desire to reduce the cost of traditional fiber reinforced petroleum based composites, new natural fiber reinforced composites have been developed. Researchers have begun to focus attention on natural fiber composites which are composed of natural or synthetic resins, reinforced with natural fibers. Natural fibers exhibit many advantageous properties; they are a low density material yielding relatively lightweight composites with high specific properties. These fibers also have significant cost advantages and ease of processing along with being a highly renewable resource, in turn reducing the dependency on foreign and domestic petroleum oil.J. Olumuyiwa et al. [4] found the possibility of using coconut shell reinforced polyethylene composite as a new material for engineering applications by conducting research on the morphology and mechanical properties of it. Coconut shell reinforced composite was prepared by compacting low density polyethylene matrix with 5% - 25% volume fraction coconut shell particles and the effect of the particles on the mechanical properties of the composite produced was investigated. The result shows that the hardness of the composite increases with increase in coconut shell content though the tensile strength, modulus of elasticity, impact energy and ductility of the composite decreases with increase in the particle content. Scanning Electron Microscopy (SEM) of the composites (with 0% - 25% particles) surfaces indicates poor interfacial interaction between the coconut shell particle and the low density polyethylene matrix.Chinthani et al. [7] conducted a study in which the coconut shell powder (CSP) has been analysed both physically and chemically to have a better understanding of the material its properties. Laser diffraction showed a broad distribution of sizes with a mean particle size of 34.2 microns, and by using scanning electron microscopy it was possible to recognize a variety of sizes, shapes and structures. The thermo-chemical character of CSP was studied over a temperature range of 30°C – 800°C using a thermogravimetric analyser. CSP was seen to pyrolyse best between 220°C - 380°C with a residue of 16.2% left at the end of the pyrolysis. In order to understand the thermo-chemical behavior of CSP more fully and to estimate the chemical composition, the lignin content was determined by the ASTM D 1106 – 96 method and a thermo gravimetric analysis (TGA) and a differential thermo gravimetric analysis (DTG) were done on the lignin as well. The CSP was pyrolysed at 550°C to determine the ash content and using atomic absorption spectroscopy the types of metal in ash were determined. Apart from silica which could not be measured, sodium, potassium, zinc, calcium and iron were found to be the main metals. Fourier transform infrared spectroscopy (FTIR) was used for a better understanding of the chemical structure of CSP.C. Sareena, et al. [8] focuses on the use of coconut shell powder as filler in natural rubber. Coconut, one of the food crops in the world, generates large amounts of waste material namely coconut shell. Modified and unmodified coconut shell powder–natural rubber composites with varying particle size and dosages were prepared by an open mill-mixing technique. The processing characteristics and the curing behavior of the composites were determined by Monsanto Rheometer. The technological performance was done by analyzing the tensile strength, tear strength and hardness of the vulcanizates. The swelling studies were carried out to observe the crosslink density and the reinforcement ability of the filler on natural rubber. The observed variation in mechanical properties has been supported by the fractography of the composites obtained by scanning electron microscopy. The results of the study show that the coconut shell powder is most effective filler in natural rubber at 10 parts per hundred loading. Reinforcement ability of modified coconut shell powder is more when compared to unmodified coconut shell powder, therefore modified coconut shell powder–natural rubber composites show better physicomechanical properties. Incorporation of coconut shell powder into natural rubber matrix enhances the thermal properties of the natural rubber—coconut shell powder composites.Neetesh Kumar et al. [15] stated that the rising cost of material is a matter of concern in this developing construction environment. The prices of building material such as cement, sand, gravel etc. are increasing day by day. The reason for increase in cost is high demand and less availability of material. Nowadays, most of the researchers are doing research on the material which can reduce the cost of construction as well as increase the strength. Research on waste material such as fly ash, rice husk, slag and sludge from treatment of industrial and domestic waste water demolished building material is being done. Use of coconut shell in concrete is not only useful economically but also environmentally useful for human being. Coconut shell is one of the main contributors of pollution problem as a solid waste. Coconut shell used as coarse aggregate in concrete encouraged sustainable and environmentally helpful material in the construction field. Since cement rate increases day per day and its availability is decreasing as per time so it can be useful to use coconut shell ash used as substitute of cement in concrete. Coconut shell can be used in the form of powder with epoxy resins or epoxy matrixes in concrete also. Composites are made by combining two or more natural or artificial materials to maximize their useful properties and minimize their weaknesses.Alif Syazani Leman et al. [16] conducted a study on chemical and physical properties of coconut shell powder as a filler material in concrete. The Coconut Shell Powder was obtained from coconut shell that had been discarded and grinded until it become in a form of powder. The study was conducted to determine the chemical and physical properties of coconut shell powder to be used as a filler material inside concrete. In order to do that, an experimental setup of X-Ray Fluorescence (XRF), Particle Size Distribution, Scanning Electron Microscopic (SEM), Density, and Specific Gravity were conducted. The coconut shell powder consist mostly carbon (C) and potassium oxide (K2O). The presents of silicon dioxide (SiO2) is crucial in order to be mix with concrete. The size of the coconut shell is ranging from 600μm and below. From all the testing, it is shown that the coconut shell powder can be used in mixing with concrete as a filler material.
2. Materials and Method
There are several techniques for the preparation of polymer matrix composites that are employed. They include spray lay-up technique, hand lay-up technique, vacuum bagging, filament winding, pultrusion etc. Out of these the hand lay-up technique is the simplest and the widely used technique for the processing of the laminates. In the current study the particulate filled composites were processed by the open mould casting technique while the laminates were fabricated by the hand lay-up technique.
2.1. Materials
The various materials that have been used for the processing of the composite materials are listed below:Coconut shell powder: In this study, the coconut shell powder was prepared by grinding the coconut shell into a fine powder. The raw material was obtained from a local supplier in Mangalore.Epoxy resin (matrix resin): Epoxy systems are the major composite material for low-temperature application [usually under 200ºF (93°C)] and generally provide outstanding chemical resistance, superior adhesion to fibers and superior dimensional stability. Epoxy can be formulated to a wide range of viscosities for different fabrication processes and cure schedules. They are free from void-forming volatiles, have long shelf lives and provide relatively low cure shrinkage. Araldite LY556 is the epoxy resin that was used for the processing of the composites in the presence study. Its density is around 1.15 to 1.20 g/cc with viscosity between 10000-12000MPa-s at 25°C.The hardener used Aradur HY951 for the epoxy resin was LY556 with a boiling point greater than 200°C and a density of 1g/cc at 20°C. The epoxy resin and the hardener were purchased from a local industrial supplier in Mangalore.
2.2. Steps Involved In Processing of Composites
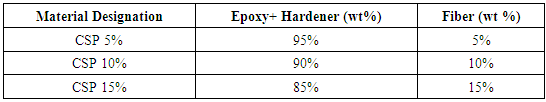
Neat epoxy sample: The weighed quantity of epoxy resin was taken in a cup. To this the hardener was added such that, for every ten parts of epoxy there was one part of hardener i.e. in the ratio 10:1. The mixture was stirred thoroughly using a glass rod so that the hardener and the epoxy were properly mixed together. Care was taken that the gel time was not exceeded before the pouring of the mixture into the mould cavity. Meanwhile the cavity was also prepared by applying the mould release wax in order to facilitate the easy removal of the composite after curing. As soon as the mixture being stirred began to show the initial signs of hardening, it was poured into the cavity and allowed to cure at room temperature for 24 hours.Epoxy glass composite with wt. 5%, 10%, & 15% CSP: In this case the weighed quantity of epoxy resin was taken in a cup to this the coconut shell powder was added and then mixed thoroughly for a time interval of 5mins. Then the hardener was added such that the epoxy to hardener ratio of 10:1 was maintained and thorough mixing was carried out. Once the mixture began to solidify it is applied over the glass mat, the stacking of the glass mat is done till we get required thickness of 3mm. Then it is kept for curing at room temperature for 24 hours.Table 1. Percentage constituent of the composite material
 |
| |
|
2.3. Preparation of the Samples for Testing
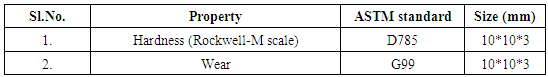
Once the composite materials had been prepared, the next important step was to cut them into test samples of sizes according to the ASTM standards. Cutting was carried out using a 24TPI hacksaw blade. Five samples of each type were cut and prepared for each of the tests. The list of ASTM standards used is mentioned in Table 2.Table 2. Sizes of specimens as per ASTM standards
 |
| |
|
3. Evaluation of Properties of the Composites
3.1. Hardness Test
Hardness is the ability of the material to resist indentation. The hardness of the different composite specimens was determined on a Rockwell hardness testing machine using M-scale. Here the major and the minor loads applied were 100N and 10N respectively. The loading was done for a short period of 10 seconds. First the specimens were cut into 10*10*3 mm. then the specimens were placed on the machine, and the load was applied. The readings were noted and the procedure was repeated for different specimens.
3.2. Abrasive and Dry Sliding Wear Test
The abrasive wear properties of different samples were tested on the Wear and Friction Monitor DUCOM TR-201C commonly known as Pin-on-Disc machine. The samples were cut according to the ASTM standard G99. The test samples were then glued to the mild steel pins of 10mm square cross-section and 50mm length. The track radius of 20mm was set, specimen is held stationary and the disc is rotated while a normal force is applied through a lever mechanism. A series of test are conducted with three sliding velocities of 210, 261 and 314 cm/sec under three different normal loading of 10N, 20N and 30N. The material loss from the composite surface is measured using a precision electronic balance with accuracy ±0.1 mg.The same procedure was adopted for the rest of the samples under the same test conditions.
4. Experimental Design
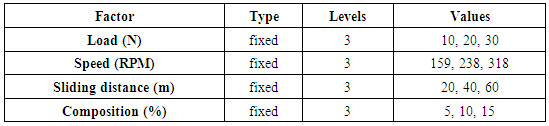
Design of experiment is the powerful analysis tool for modelling and analysing the influence of the control factors on the performance output. The most important stage in the design of experiment lies in the selection of the control factors. Therefore, a large number of factors are included so that non-significant variables can be identified at the earliest opportunity. The operating conditions, under which wear tests carried out, are given in Table 3, 4 under room temperature.Table 3. Control factors and levels used in the Abrasive wear experiment
 |
| |
|
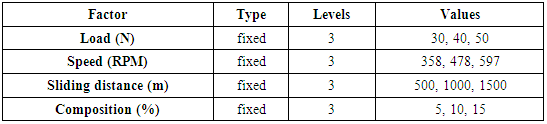
Table 4. Control factors and levels in the Dry Sliding wear experiment
 |
| |
|
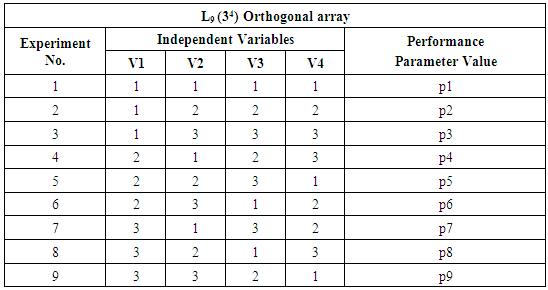
Four parameter Load, Speed, sliding distance and Composition each at three levels, are considered in this study in accordance with L9 (34) orthogonal array design. In table, each column represented a test parameter and row gives a test condition, which is nothing but a combination of parameter levels.Four parameter each at three levels would require 34=81 runs in a full factorial experiment, whereas, Taguchi’s factorial experiment approach reduces it to 9 runs only offering a great advantage.The experimental observations are transformed into signal-to-noise (S/N) ratio. There are several S/N ratios available depending on the type of characteristic, which can be calculated as logarithmic transformation of the loss function as below.Lower is the better characteristic,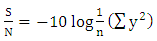 | (1) |
Where n is the number of observations, and y the observed data. “Lower is the better” (LB) characteristic, with the above S/N ratio transformation, is suitable for minimization of wear rate. Table 5. Orthogonal array for L9 (313) Taguchi design
 |
| |
|
5. Results and Analysis
5.1. Hardness
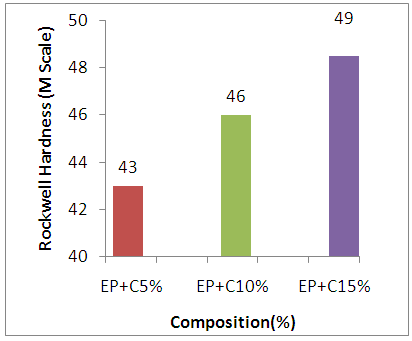 | Figure 1. Comparison of hardness with different composite specimen |
Harness test was conducted on various specimens and it was found hardness increases with increase in the coconut shell powder content and for the C15% hardness found to be maximum of 49RHN.
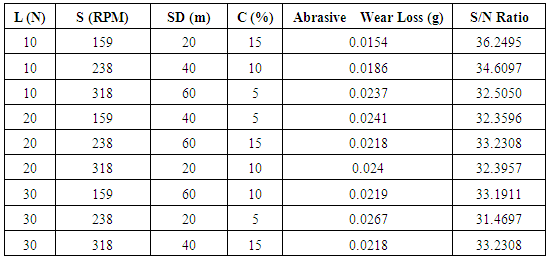
5.2. Abrasive Wear Characteristics Analysis Using MINITAB
The experimental results are analyzed using Taguchi method and the significant parameters affecting material erosion have been identified. The results of the Taguchi analysis are also presented here.From Table 6, the overall mean for the S/N ratio of the wear rate is found to be 33.24db. Figure 2 shows graphically the effect of the control factors on abrasive wear loss. The analyses are made using the popular software specifically used for design of experiment applications known as MINITAB 14. The S/N ratio response are given in Table 7, from which it can be concluded that among all the factors, composition is the most significant factor followed by normal load, speed and sliding distance. Analysis of the results leads to the conclusion that factor combination of A1, B1, C2 and D3 gives minimum wear loss. Table 6. Test conditions with results using L9 array (Abrasive Wear Test, Wear Loss)
 |
| |
|
Table 7. Response table for signal to noise ratios
 |
| |
|
 | Figure 2. Effect of control factors on wear loss (Mean) |
In order to understand a concrete visualization of impact of various factors effect on the output performance, it is desirable to develop analysis of variance (ANOVA) table to find out the order of significant factors. Table 8, shows the results of the ANOVA with the abrasive wear loss. This analysis is undertaken for a level of significance of 5% i.e. for level of confidence 95%. The 7th column of the Table 8 indicates the order of significance among factors. Table 8. ANOVA table for S/N Ratio
 |
| |
|
From Table 8, one can observe that the Filler content (p=0.047) have greater static influence of 42.7%, Normal load (p= 0.049) have an influence of 40.7% and Speed (p=0.126) have an influence of 14.5%.The figure 3 shows the contour plots of wear loss, which gives the clear picture of variation of wear loss with control factors.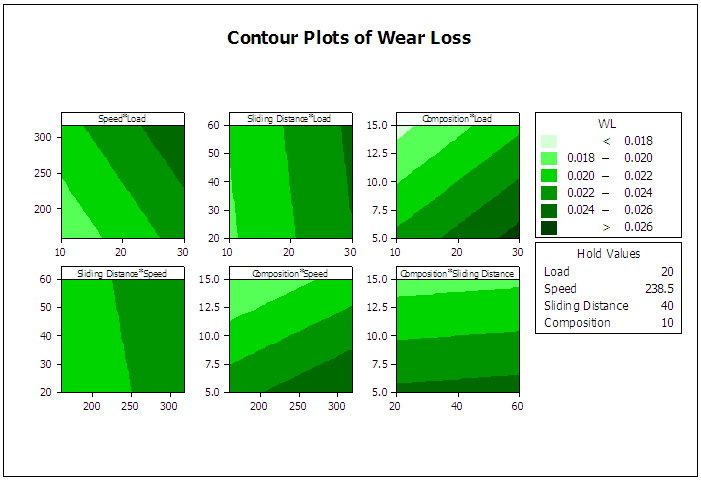 | Figure 3. Contour plot of wear loss |
5.3. Dry Sliding Wear Characteristics Analysis Using MINITAB
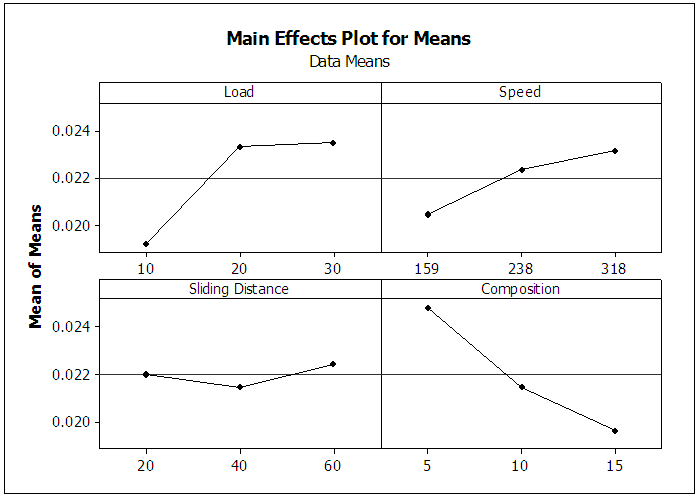
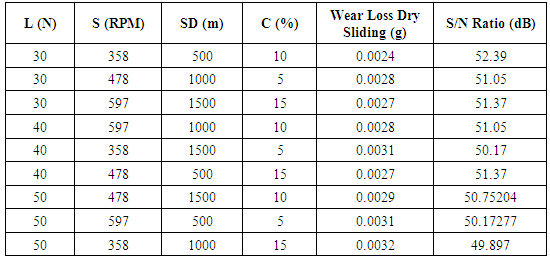
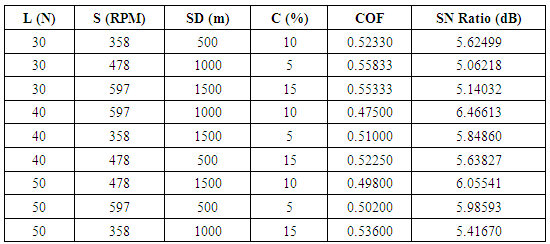
From Table 9, the overall mean for the S/N ratio of the wear rate is found to be 50.91db. Figure 4 shows graphically the effect of the control factors on dry sliding wear loss. Table 9. Test conditions with output results using L9 array (Dry Sliding Wear Loss)
 |
| |
|
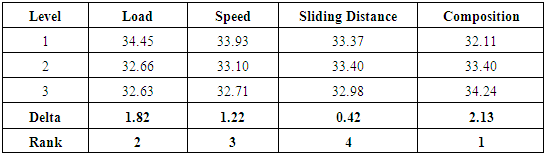
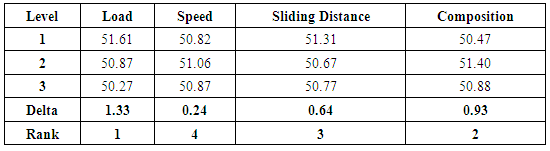
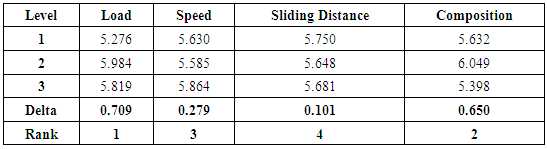
The S/N ratio response are given in Table 10, from which it can be concluded that among all the factors, load is the most significant factor followed by composition, sliding distance and speed. Analysis of the results leads to the conclusion that factor combination of A1, B2, C1 and D2 gives minimum dry sliding wear loss.Table 10. Response table for signal to noise ratios
 |
| |
|
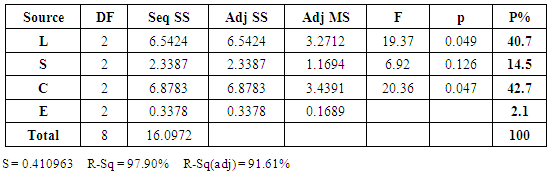
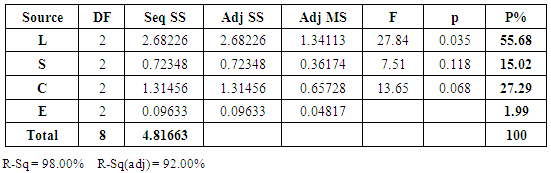
From Table 11, one can observe that the Normal load (p=0.035) have greater static influence of 55.68%, composition (p= 0.068) have an influence of 27.29% and Speed (p=0.118) have an influence of 15.02%.Figure 5 gives contour plots of dry sliding wear loss, which indicate the variation of wear loss with the control factors.Table 11. ANOVA table for S/N Ratio
 |
| |
|
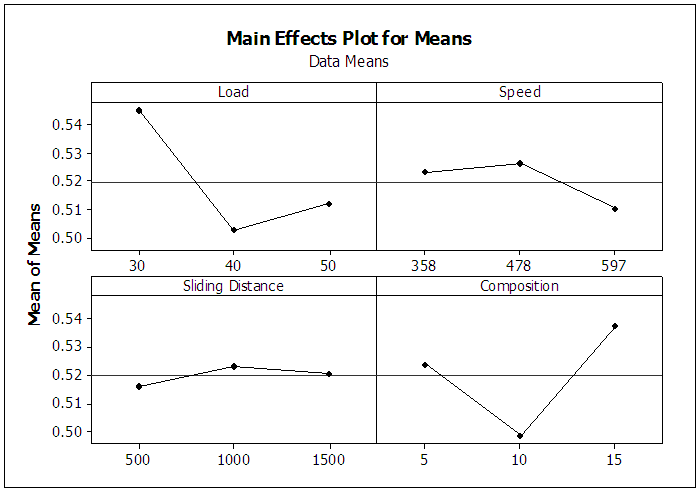
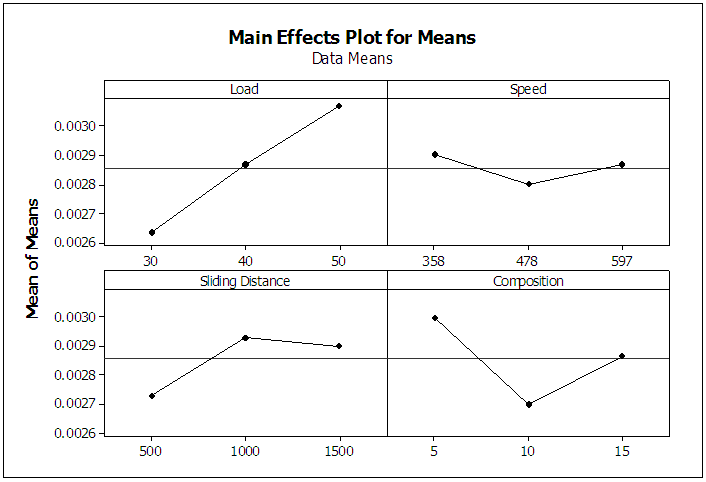 | Figure 4. Effect of control factors on wear loss (Mean) |
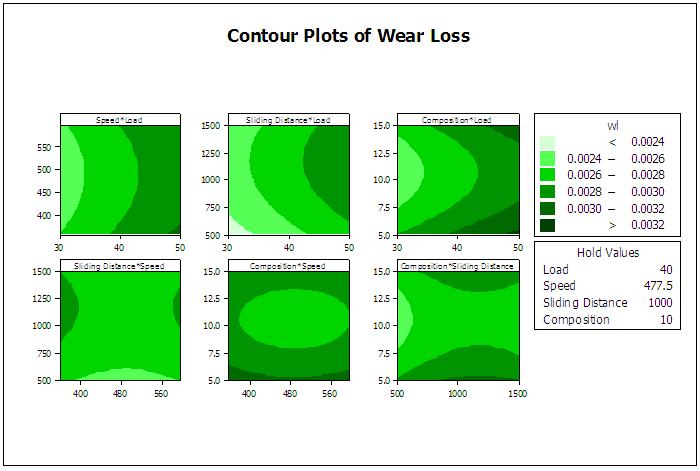 | Figure 5. Contour plots of wear loss |
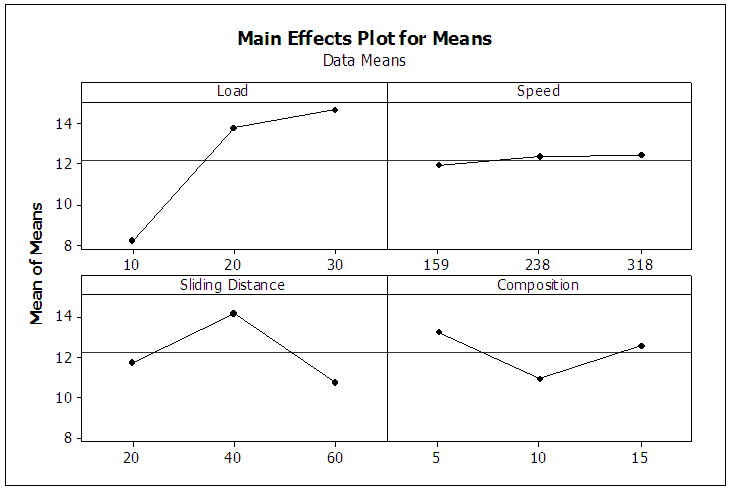
5.4. Analysis of COF (Dry Sliding Wear Test)
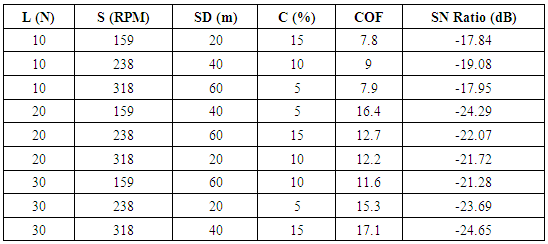
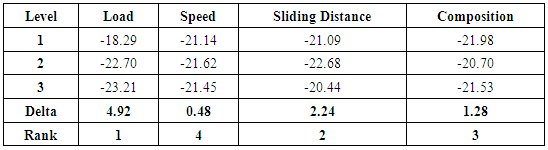
From Table 12, the overall mean for the S/N ratio of the wear rate is found to be 5.69 db. Figure 6, shows graphically the effect of the control factors on COF. The S/N ratio response are given in Table 13, from which it can be concluded that among all the factors, load is the most significant factor followed by composition, speed and sliding. Analysis of the results leads to the conclusion that factor combination of A2, B3, C1 and D2 gives minimum COF. Table 12. Test conditions with output results using L9 array (Dry Sliding Wear, COF)
 |
| |
|
Table 13. Response table for signal to noise ratios
 |
| |
|
 | Figure 6. Effect of control factors on COF (Mean) |
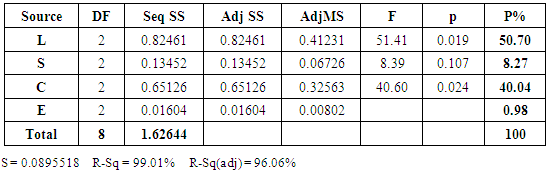
From Table 14, one can observe that the Normal load (p=0.019) have greater static influence of 50.70%, composition (p= 0.024) have an influence of 40.04% and Speed (p=0.107) have an influence of 8.27%.Table 14. ANOVA table for S/N Ratio
 |
| |
|
Figure 7 gives contour plots of COF under dry sliding condition, which indicate the variation of COF with the control factors. | Figure 7. Contour Plots of COF (Dry Sliding Wear Test) |
5.5. Analysis of COF (Abrasive Wear Test)
From Table 15, the overall mean for the S/N ratio of the wear rate is found to be -38.52 dB. Figure 8 shows graphically the effect of the control factors on COF. The S/N ratio response are given in Table 16, from which it can be concluded that among all the factors, load is the most significant factor followed by speed, composition and sliding distance. Analysis of the results leads to the conclusion that factor combination of A1, B1, C3 and D2 gives minimum COF. Table 15. Test conditions with output results using L9 array (Abrasive Wear Test, COF)
 |
| |
|
Table 16. Response table for signal to noise ratios
 |
| |
|
 | Figure 8. Effect of control factors on wear rate (SN Ratio) |
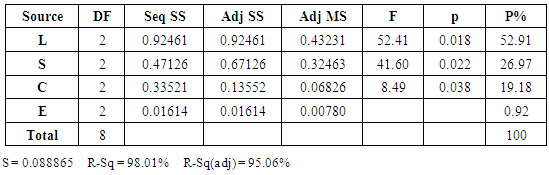
From Table 17, one can observe that the Normal load (0.018) have greater static influence of 56.84%, speed (p= 0.022) have an influence of 26.97% and composition (p=0.038) have an influence of 19.18%.Table 17. ANOVA table for S/N Ratio
 |
| |
|
Figure 9 gives contour plots of COF under abrasive wear condition, which indicate the variation of COF with the control factors.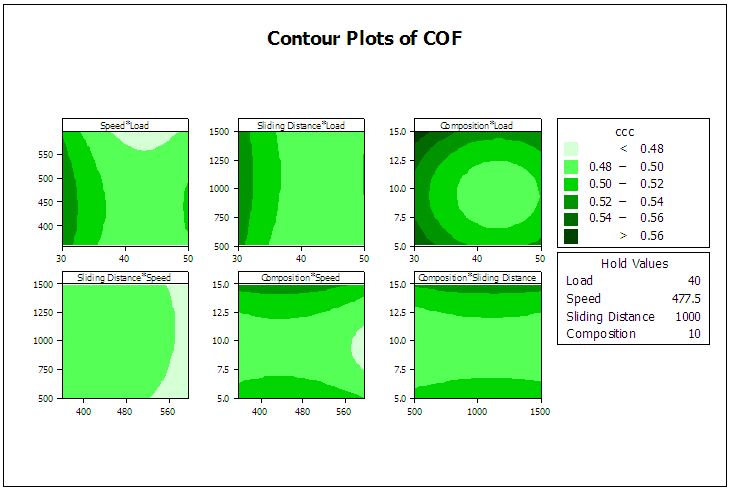 | Figure 9. Contour Plots of COF (Abrasive Wear Test) |
6. Conclusions
Through the current study, it can be concluded that the 1. It was found that hardness increases with increase in the coconut shell powder content and for the C15% composite hardness found to be maximum of 49RHN. 2. It was found that Filler content (p=0.047) have greater static influence of 42.7% on abrasive wear loss followed by Normal load (p= 0.049) 40.7%, Speed (p=0.126) 14.5% and sliding distance.3. It was observed that the Normal load (p=0.019) have greater static influence of 50.70% on dry sliding wear loss followed by composition (p= 0.024) 40.04%, Speed (p=0.107) 8.27% and sliding distance.4. It is also clear that frictional force increases as the load increases. As the percentage of reinforcement of coconut shell powder in the epoxy increases, the frictional force also increases this is because of the resistance offered by the coconut shell powder to the wear.
ACKNOWLEDGEMENTS
The authors extend heartfelt thanks and appreciations to Director and Principal of St Joseph Engineering College, Mangaluru for their continuous support and encouragement during research work.
References
| [1] | Faris M., AL-Oqla, Sapuan S.M., Natural fiber reinforced polymer composites in industrial applications: feasibility of date palm fibers for sustainable automotive industry, Journal of Cleaner Production 66, November 2013, pp.347-354. |
| [2] | Saira Taj, Munawar Ali, Shafiullah Khan, A review on natural fiber polymer reinforced composites, Institute of Chemistry, University of Punjab, Lahore, Pakistan, Pakistan Academy of Science 44(2)144, March 2007. |
| [3] | Nguong C.W, Lee S.N.B, Sujan D, A review on natural fiber polymer reinforced composites, World Academy Of Science, Vol.72, May 2013, pp.1123-1130. |
| [4] | J. Olumuyiwa Agunsoye, Talabi S. Isaac, Sanni O. Samuel, Study of Mechanical Behaviour of Coconut Shell Reinforced Polymer Matrix Composite, Journal of Minerals and Materials Characterization and Engineering, 2012, 11, pp.774-779. |
| [5] | Ramakrishna Mulkapuran, Vivek Kumar, Yuvraj Singh Negi, Recent Development in Natural Fiber Reinforced Polypropylene Composites, Journal of reinforced plastics and composites Vol. 28, No. 10, November 2009, pp.1170-1189. |
| [6] | Deepa B, Laly A Pothan, Rubie Maveli-Sam, Structure, properties and recyclability of natural fiber reinforced polymer composites, Recent Developments in Polymer Recycling, Trivandrum, Kerala, Vol.2, 2011, pp.101-120. |
| [7] | Chinthani D. Liyanage. & Mevan Pieris, A Physico-Chemical Analysis of Coconut Shell Powder, Procedia Chemistry Volume 16, 2015, Pages 222-228. |
| [8] | C. Sareena, M.T. Ramasan, E. Purushothaman, Utilization of coconut shell powder as a novel filler in natural rubber, Journal of Reinforced Plastics and Composites, Vol 31, Issue 8, 2012. |
| [9] | Verma D, Gope P.C and Gupta A, A review on fiber reinforcement and its applications in polymer composites, Journal of Materials and Environmental Science 4(2), October 2013, pp.263-276. |
| [10] | [Begum K, Islam M.A, A review on natural fibers as a substitute of synthetic fibers in polymer composites, Shahjalal University of Science and Technology, Bangladesh, Research Journal of Engineering Sciences, Vol.2 (3), April 2013, pp.46-53. |
| [11] | Prakash Inamdar, Dr. Shivanand , Santhosh Kumar, Studies on tensile properties of natural fiber polymer matrix composites, International Journal of Engineering Research and Technology, Vol.2 issue 3, March 2013. |
| [12] | Chandramohan D, Marimuthu K, Tensile and Hardness Tests on Natural Fiber Reinforced Polymer Composite Material, International journal of advanced engineering sciences and Vol.6, Issue No. 1, June 2011, pp.97 – 104. |
| [13] | Singha A.S , Vijay Kumar Thakur, Tensile properties, National Institute of Technology, Hamipur, Indian Academy of Science, vol.31 no5, April 2008, pp. 791–799. |
| [14] | Raju G.U, Kumarappa S, Gaitonde V.N, Mechanical and physical characterization of agricultural waste reinforced polymer composites, Journal of Materials and Environmental Science 3 (5), June 2012 , pp.907-916. |
| [15] | Neetesh Kumar, Dilip Kumar, Utilization of Coconut Shell in Different Forms in Concrete, IJSRD - International Journal for Scientific Research & Development| Vol. 2, Issue 07, 2014 | ISSN (online): 2321-0613. |
| [16] | Alif Syazani Leman, Shahiron Shahidan, Mohamad Syamir Senin and Nurul Izzati Raihan Ramzi Hannan, A Preliminary Study On Chemical And Physical Properties Of Coconut Shell Powder As A Filler In Concrete, IOP Conference Series: Materials Science and Engineering Vol.160, No.1, (2016) 012059 doi:10.1088/1757-899X/160/1/012059. |

 Abstract
 Reference
 Full-Text PDF
 Full-text HTML