-
Paper Information
- Previous Paper
- Paper Submission
-
Journal Information
- About This Journal
- Editorial Board
- Current Issue
- Archive
- Author Guidelines
- Contact Us
American Journal of Materials Science
p-ISSN: 2162-9382 e-ISSN: 2162-8424
2016; 6(5): 135-146
doi:10.5923/j.materials.20160605.03

Use of Biocomposite Adsorbents for the Removal of Methylene Blue Dye from Aqueous Solution
 Abstract
 Reference
 Full-Text PDF
 Full-text HTML
Ahmed A. Moosa, Ali Mousa Ridha, Noor Ali Kadhim
Department of Materials Engineering Technology, Engineering Technical College, Baghdad, Middle Technical University, Baghdad, Iraq
Correspondence to: Ali Mousa Ridha, Noor Ali Kadhim, Department of Materials Engineering Technology, Engineering Technical College, Baghdad, Middle Technical University, Baghdad, Iraq.
| Email: |  |
Copyright © 2016 Scientific & Academic Publishing. All Rights Reserved.
This work is licensed under the Creative Commons Attribution International License (CC BY).
http://creativecommons.org/licenses/by/4.0/

In this study, chitosan was extracted from locally shrimp shell waste as low cost raw materials by using chemical methods including deproteinization, demineralization and deacetylation. The adsorbents were characterized by (FTIR) and (BET). The degree of deacetylation (DDA) is one of the main characterizing parameters of the chitosan. Chitosan with a high degree of deacetylation (73.4%) was obtained by deacetylation with 60% NaOH for 1 hour at 80°C. The chitosan was impregnated with granular activated carbon to be used as adsorbents for the removal of methylene blue dye MB from aqueous solution by adsorption technique. The optimum condition for batch adsorption of the methylene blue dye MB with the maximum adsorption efficiency were found to be 85.85% for Chitosan (CH), 91.7% for chitosan impregnated granular activated carbon with different amounts of chitosan (10 wt.%) CHGAC1, 95.81% for chitosan impregnated granular activated carbon with different amounts of chitosan (20 wt.%) CHGAC2 and 87.75% for Granular activated carbon (GAC) at adsorbent dosage 0.8 g, pH 6, 7 and contact time 6 hrs respectively. The equilibrium isotherm of Chitosan impregnated granular activated carbon with different amounts of chitosan (10 wt.% and 20 wt.%) (CHGAC) for the methylene blue dye MB shows that the Freundlich isotherm fits the experimental data better than Langmuir and Temkin adsorption. The equilibrium isotherm of (Chitosan CH and Granular activated carbon GAC) for the methylene blue dye MB shows that the Langmuir isotherm fits the experimental data better than Freundlich and Temkin adsorption.
Keywords: Chitosan, Biocomposite Adsorbents, Granular Activated Carbon, Adsorption, Methylene Blue Dye Removal
Cite this paper: Ahmed A. Moosa, Ali Mousa Ridha, Noor Ali Kadhim, Use of Biocomposite Adsorbents for the Removal of Methylene Blue Dye from Aqueous Solution, American Journal of Materials Science, Vol. 6 No. 5, 2016, pp. 135-146. doi: 10.5923/j.materials.20160605.03.
Article Outline
1. Introduction
- Water pollution caused by toxic metals and organic compounds is still a serious problem for the general environment. Therefore, water pollution has become a major source of concern and a priority for most industries. Heavy metal ions and dyes are common contaminants in wastewater because they are widely used. Many of these contaminants in wastewater are known to be toxic or carcinogenic [1].The dyes are organic compound that imparts color to different substances and they have many industrial applications such as the textile, ceramics, leather, printing, carpets, paper, food processing and others. They cause pollution of natural water resources and environmental problems. The dyes are the most apparent indicator in water pollution. The discharge of colored waste may be toxic to the human body and aquatic life [2-4]. Where that most of the countries specify the maximum allowable concentration for some dyes in the effluent streams less than 1 ppm [5].The methylene blue dye is a cationic dye and toxic material [6]. Methylene Blue is the most common material used in many industries such as substance for dyeing cotton, wood, silk, and other industries. Methylene blue dye pollutants that affect human health because of their many uses and their applications are considered as causing difficulty in breathing, nausea, profuse sweating and mental confusion and other effects seriously [7].Therefore, there are several operations to remove methylene blue dye from the wastewater such as Precipitation, Ion exchange, Coagulation, Flocculation and Chemical oxidation, but they are expensive and cause pollution [8]. Adsorption is widely method which used to remove various types of dyes from the wastewater because it gives good results, high removal efficiency, uncontaminated, applicability, low cost, ease of operation and simplicity of design [9].Chitosan a natural polysaccharide comprising copolymer of Glucosamine and N-acetylglucosamine. Chitosan is obtained on an industrial scale by alkaline partial deacetylation of the chitin [10]. The chemical structure of chitin and chitosan is shown in Figure 1 [11]. The chitosan is extracted from the shells of shrimp, prawns, crabs, insects and other crustaceans.
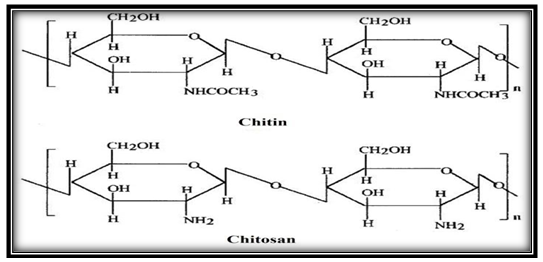 | Figure 1. Chemical structure of chitin and chitosan [11] |
2. Material and Methods
2.1. Adsorbate
- Methylene blue, a cationic dye was chosen as an adsorbate (MW=373.90 g/mol). A stock solution of MB dye was prepared by dissolving 1gm of methylene blue MB into 1 L distilled water. Solutions of different initial concentration of methylene blue MB were prepared by serial dilution of the stock solution. The equilibrium concentrations of methylene blue were measured using a UV spectrophotometer at a maximum wavelength of 663 nm. The initial pH is modified with 1 M HCl and 1 M NaOH solutions.
2.2. Adsorbents
2.2.1. Granular Activated Carbon GAC
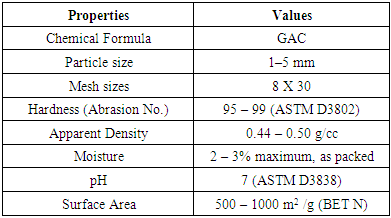
- Granular activated carbon GAC was utilized in this work as an adsorbent. High purity 99.9% GAC supplied by Panreac, Barcelona, Espana. The typical properties of GAC are shown in the Table 1.
|
2.2.2. Chitosan
- Fresh shrimp was collected from local market of Basrah. Head, tail and skin was separated from shrimp by using sharp knives. The collected shrimp wastes were washed with warm water for several times to remove soluble organics, adhesion proteins and other impurities, and then crushed with mortar pestle. Crushed shrimp waste was kept in a polyethylene bags at 25°C and 24 hours for partial autolysis to facilitate chemical extraction of chitosan and to enhance the quality of chitosan [15]. The chitosan was prepared from the chemical processes, including Deproteinization, Demineralization, and Deacetylation. a. Deproteinization was carried out by soaking the shrimp shells (from pretreatment) in 1 M NaOH solution for 24 hours and 25°C in order to remove the protein. The solid to NaOH solution ratio is fixed at 1:10 (w/v) and slow mixing. The resulted material was washed with distilled water several times to remove the base. After rinsing the deproteinzed material was obtained by filtration under vacuum and then dried into oven at 70°C [16].b. Demineralization of shrimp shell (obtained from deproteization process) was done by immersing into 0.25 M HCl solution in order to remove minerals (mainly calcium carbonate). The ratio of deproteinzed material to acid solution is maintained at 1:10 (w/v) for 15 minutes and 25°C. Then, the solid was washed with distilled water several times to remove excess acid and pH 7 was reached. After washing and filtration under vacuum, the material free of minerals was dried in an oven at 90°C for 1 hour to obtain Chitin [16]. c. Deacetylation is the process to convert chitin to Chitosan by removal of acetyl groups. It is generally achieved by treatment with concentrated sodium hydroxide solution 60% with shaker water bath at 80°C for 1hour and ratio of chitin to the solution (1:10), to remove the acetyl groups from the polymer and then dried into the oven at the 80°C for 2 hours. The solid was then crushed to obtain the Chitosan [17].
2.2.3. Chitosan treating of GAC
- CHGAC was prepared as an alternative adsorbent by treating the chitosan with the GAC. The stock solution of the chitosan was prepared by adding 10 g/L of chitosan into 1% (v/v) of the acetic acid solution. The granular activated carbon (GAC) was immersed in the stock solution of chitosan with the granular activated carbon (GAC) to solution ratio 10:50 (w/v) at the temperature 25°C for 24 hours. After washing the chitosan granular activated carbon composite CHGAC with distilled water for several times and filtering under vacuum for removing of the excess chemicals and to obtain of the neutral pH. Then the adsorbent was soaked in 0.1 M of the NaOH solution for 3 hours so as to precipitate the adsorbed Chitosan on GAC. After that, the adsorbent was washed with distilled water for several times to remove the base, and then dried in an oven at the temperature 102°C for 2 hours and stored in a dryer for experimental use [18].
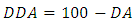
2.3. Determination of Degree of Deacetylation
- Degree of deacetylation (DD) is one of the main parameters characterizing chitosan. Chitosan is characterized by either the degree of acetylation (DA), which corresponds to the N-acetylamine groups, or the degree of deacetylation DDA [19]. The degree of deacetylation (DD) determined by FTIR (infrared spectroscopic) analysis because they are widely available, low-cost and required little time for analysis [20]. The Degree of deacetylation refers to the removal of acetyl group from the chain this is determined by FTIR spectroscopy have been performed in the transmission mode, with chitosan contained in potassium bromide (KBr) tablets. The spectra of chitosan samples were obtained within a frequency range of λ (400 – 4000) cm-1. The following equation of degree of deacetylation of chitosan was used, where the absorbance at A1650 and A3450 cm-1 are the absolute heights of absorption bands of amide and hydroxyl groups respectively [21]. The DA can be expressed as [22]
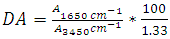 | (1) |
 | (2) |
2.4. Batch Adsorption Experiments
2.4.1. Effect of Adsorbent Dosage
- The effect of adsorbent dosage on the adsorption of methylene blue dye onto each bioadsorbents Chitosan (CH), Chitosan impregnated granular activated carbon with different amounts of chitosan (10 wt.%) CHGAC1, Chitosan impregnated granular activated carbon with different amounts of chitosan (20 wt.%) CHGAC2 and Granular activated carbon (GAC) were investigated. Different dosage (0.2, 0.4, 0.6, 0.8 and 1 g) for each (CH, CHGAC1, CHGAC2 and GAC) were added to 50 ml with initial concentration of 105 mg/L of methylene blue MB dye. The initial pH of the methylene blue MB dye solution was maintained at 6 and 7 respectively. The pH of each solution was adjusted by 1M of HCl and 1M NaOH solutions. The samples were placed in the bottles and then agitated for about 5 hours in a shaker water bath. This process of agitation speed was fixed at 120 rpm and the temperature was maintained at 25°C. After shaking the solutions were then separated by filtration using 0.45 μm filter paper. The remaining concentrations of methylene blue dye in the filtrate were measured by using the Ultraviolet–visible (UV-Vis) spectrophotometer. The best dosage of each bioadsorbent Chitosan (CH), Chitosan impregnated granular activated carbon with different amounts of chitosan (10 wt.% and 20 wt.%) (CHGAC) and Granular activated carbon (GAC) was selected at maximum adsorption efficiency.
2.4.2. Effect of pH
- The effect of pH on the methylene blue dye ion adsorption onto bioadsorbents Chitosan (CH), Chitosan impregnated granular activated carbon with different amounts of chitosan (10 wt.% and 20 wt.%) (CHGAC) and Granular activated carbon (GAC) was studied with different initial pH (2, 3, 4, 5, 6, 7, 8, 9 and 10) of the methylene blue MB dye solution. The best dosage of each (Chitosan CH, Chitosan impregnated granular activated carbon with different amounts of chitosan (10 wt.%) CHGAC1, Chitosan impregnated granular activated carbon with different amounts of chitosan (20 wt.%) CHGAC2 and Granular activated carbon (GAC) was added to 50 ml of methylene blue MB solution. The initial concentration of the methylene blue MB dye solution was kept at 105 mg/L. The pH of adsorbate solutions was adjusted by 1M of HCl and 1M NaOH solutions. The samples in the bottles were put in the shaker water bath and then agitated for about 5 hours. This process of agitation speed was fixed at 120 rpm and the temperature was maintained at 25°C. After shaking the solutions were then separated by filtration using 0.45 μ filter paper. The remaining concentration of methylene blue dye in the filtrate was measured by using the Ultraviolet–visible (UV-Vis) spectrophotometer. The best pH of each bioadsorbents (CH, CHGAC1, CHGAC2 and GAC) was obtained at maximum adsorption efficiency.
2.4.3. Effect of Contact Time
- In order to obtain the best contact time for adsorption of methylene blue dye (MB) adsorption onto bioadsorbents Chitosan (CH), Chitosan impregnated granular activated carbon with different amounts of chitosan (10 wt.% and 20 wt.%) (CHGAC) and Granular activated carbon (GAC), a series of experiments were achieved at different contact time (2, 4, 6, 8 and 10hrs) with best adsorbent dosages and the best pH of adsorbate solutions. The solution of the methylene blue MB dye was adjusted to the best pH with the initial concentration 105 mg/L. A volume 50 mL of methylene blue MB solution was placed in the bottles. The best dosage of each Chitosan CH, Chitosan impregnated granular activated carbon with different amounts of chitosan (10 wt.%) CHGAC1, Chitosan impregnated granular activated carbon with different amounts of chitosan (20 wt.%) CHGAC2 and Granular activated carbon GAC were added to each bottle. The solution in the bottles was agitated for different times in a shaker with water bath at agitation speed of 120 rpm and the temperature was maintained at 25°C and then filtered. The equilibrium concentration of MB dye was determined by the Ultraviolet–visible (UV-Vis) spectrophotometer. The best time for methylene blue MB dye was then obtained at maximum adsorption efficiency.
2.5. Adsorption Isotherm
- Equilibrium isotherm experiments were conducted out using the best condition of (adsorbent dosage, pH and contact time) for adsorption of methylene blue MB onto each of bioadsorbents Chitosan (CH), Chitosan impregnated granular activated carbon with different amounts of chitosan (10 wt.%) CHGAC1, Chitosan impregnated granular activated carbon with different amounts of chitosan (20 wt.%) CHGAC2 and Granular activated carbon (GAC). The solution of methylene blue MB dye with different initial concentration (20, 40, 60, 80, 100, 150 and 200 mg/L) were adjusted to the best pH of the methylene blue MB dye solution. A 50 ml of the methylene blue MB dye solution was placed in the bottles. Best dosage of each bioadsorbent (CH, CHGAC1, CHGAC2) and GAC were added to each bottle. The samples in bottles were agitated at a best adsorption period in a shaker with water bath at agitation speed 125 rpm and the temperature was maintained at 25°C. The samples were then filtered and the remaining concentration of methylene blue MB dye was measured by the Ultraviolet–visible (UV-Vis) spectrophotometer.The amount of adsorption at equilibrium, qe (mg/g), is given by Equation 3 [9].
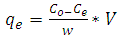 | (3) |
 | (4) |
2.5.1. Langmuir Isotherm Model
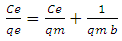
- The Langmuir adsorption isotherm assumes that adsorption takes place at specific homogeneous sites within the adsorbent and has found successful application to many sorption processes of monolayer adsorption. The Langmuir isotherm enters into absorbing the monophonic layer on the surface has a limited number of identical sites. The Langmuir isotherm can be written as [23].
 | (5) |
 | (6) |
2.5.2. Freundlich Isotherm Model
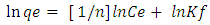
- The Freundlich isotherm is an empirical equation employed to describe heterogeneous surfaces with interaction occurring between the adsorbed molecules and is not restricted to the formation of a monolayer [24]. The Freundlich Equation is.
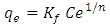 | (7) |
 | (8) |
2.5.3. Temkin Isotherm Model
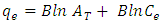
- This isotherm contains at the factor that explicitly taking into the account of adsorbent and adsorbate interactions. By ignoring the extremely low and large values of concentrations this model assumes that the heat of adsorption (function of temperature) of all the molecules in the layer would reduce the linear no logarithmic with coverage. As is clear from the equation, its derivation is characterized by a uniform distribution of binding energies (up to some maximum binding energy) was carried out by plotting the quantity sorbed qe against ln Ce and the constants were determined from the slope and intercept. The model is given by the following of the equation [25].
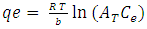 | (9) |
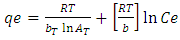 | (10) |
 | (11) |
 | (12) |
3. Results and Discussion
3.1. Calibration Standard Curve of Methylene Blue Dye (MB)
- The concentrations of methylene blue (MB) in the supernatant solutions were determined by measuring absorbance of the methylene Blue dye by using a UV spectrophotometer at a maximum wavelength (λmax= 663 nm) using the calibration curve shown in Figure 2. The calibration curve of absorbance against MB concentration was obtained by using standard MB solutions at pH 6. The experimental data reported in Figure 2 were fitted by a straight line with a high regression coefficient value (R2 = 0.994).
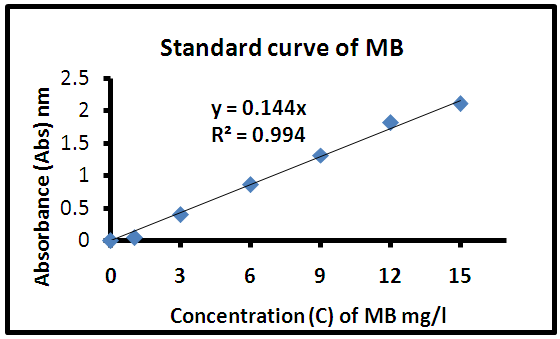 | Figure 2. The calibration curve of absorbance (Abs) against MB concentrations (C) |
3.2. Characterization of the Adsorbents
3.2.1. FTIR Analysis
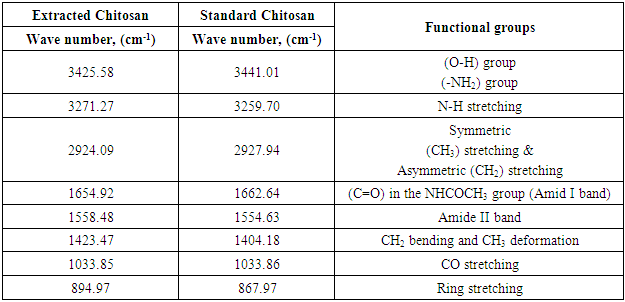
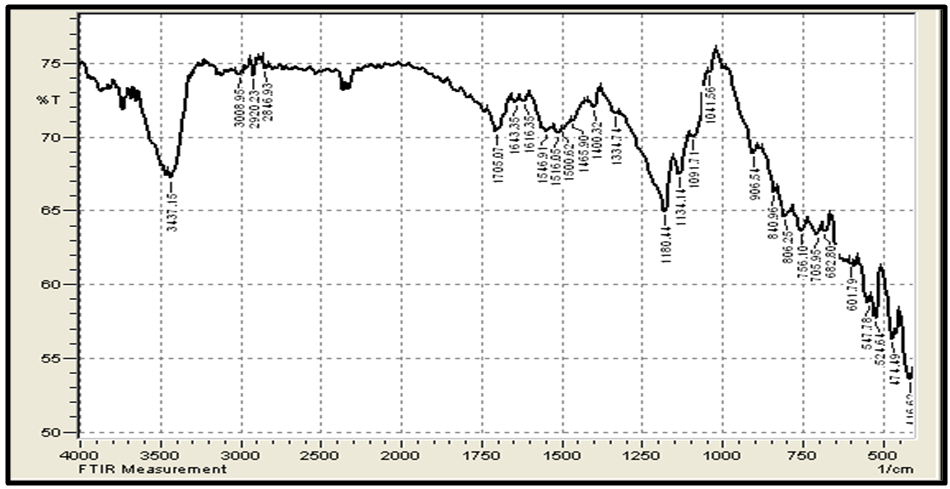
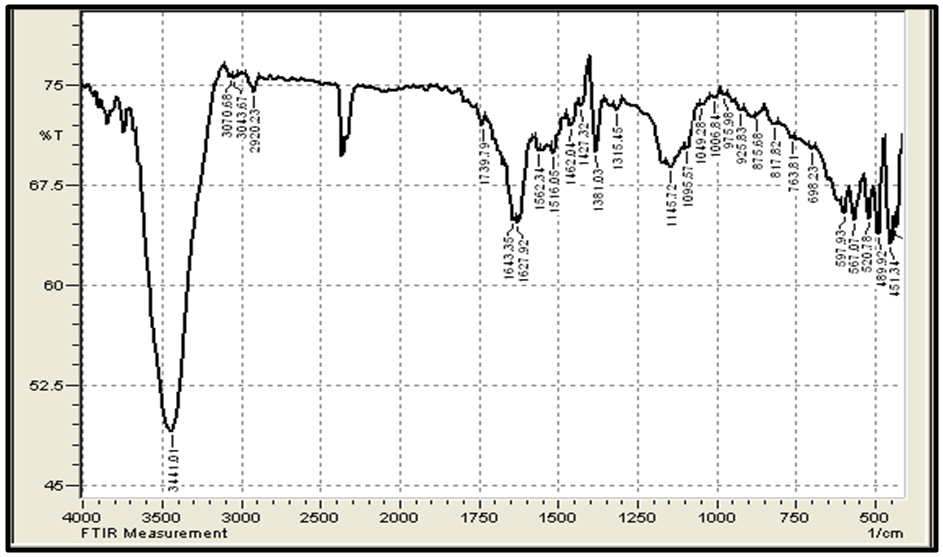
- Figure 3 (a,b) shows the FTIR spectra (IRTracer-100, Shimadzu Co. Japan) with various ranges from 4000-400 cm-1 of the extracted Chitosan and compared with standard chitosan. The functional groups in the adsorbent are presented in Table 2. The functional groups like C=O (H bonded) and N–H (1 amide) bending vibrations are responsible for the increase in adsorption efficiency for removal methylene blue dye MB from aqueous solution. These results are in agreement with the work of (Y. S. Puvvada et al, 2012) [26] and (D. Zvezdova 2010) [27].
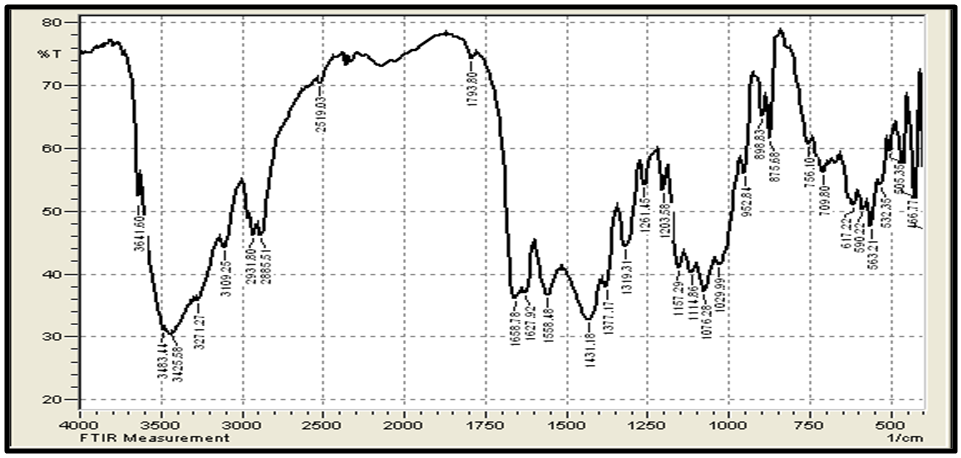 | Figure 3(a). FTIR of the chitosan extracted from shrimp shell |
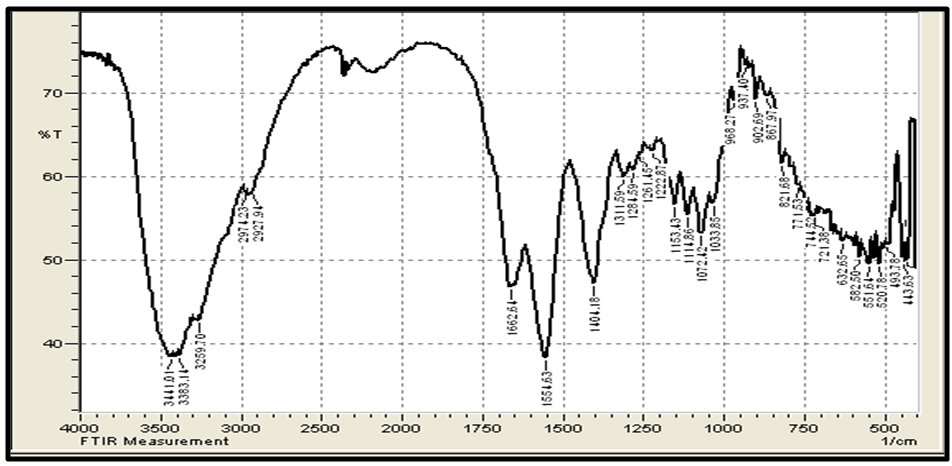 | Figure 3(b). FTIR spectra of standard chitosan |
|
 | Figure 4. FTIR of Granular Activated Carbon |
 | Figure 5. FTIR of CHGAC Composites |
3.2.2. Specific Surface Area Analysis
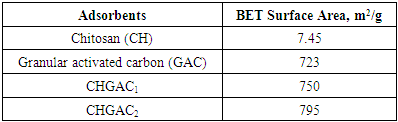
- The surface area characterization of chitosan, granular activated carbon, and chitosan impregnated granular activated carbon with different amounts of chitosan (10 wt.% and 20 wt.%) (CHGAC) are listed in Table 3. The process of immobilizing chitosan onto granular activated carbon resulted in the homogeneous dispersion of the Chitosan polymer matrix onto the granular activated carbon surface. These results are in agreement with the work of (C. Futalana et al, 2011) [30]. The (CHGAC1 & CHGAC2) have the superior properties improved adsorption properties over chitosan and GAC alone in terms of high surface area These results are in agreement with the work of (M. Wan et al, 2010) [31].
|
3.2.3. Effect of Degree of Deacetylation DDA of Extracted Chitin
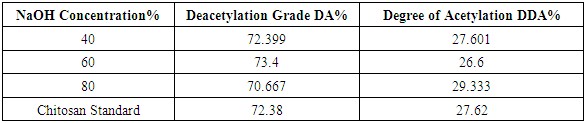
- Based on the Table 4, it is referred to that the degree of deacetylation (DD) is affected by NaOH concentration. The acetyl groups bounded in chitin is very difficult to be removed. So, it needs high concentration of NaOH and high temperature to enhance the quality of the chitosan. These results are in agreement with the work of (M. Hossain and A. Iqbal 2014) [17]. In this case, used a different concentration of NaOH (40%, 60% &80%) treated with chitosan extracted from shrimp shell at 80 OC and compared with standard chitosan to determine the degree of deacetylation by FTIR analysis was investigated. The increased of NaOH concentration addressed to optimize of the deacetylation grade, where obtained of the highest deacetylation grade (73.4%) reached at 60% of the NaOH concentration. The degree of deacetylation of the shrimp chitosan samples ranged from 26.6% to 29.333% based on different concentration on of the NaOH treatment. DA of chitosan ranges from 70.667% to 73.4%.
|
3.3. Adsorption Studies
3.3.1. Effect of Adsorbents Dosage
- The effect of different adsorbent dosage in the range (0.2, 0.4, 0.6, 0.8, 1gm) on the adsorption efficiency for methylene blue MB onto each of Chitosan (CH), Chitosan impregnated granular activated carbon with different amounts of chitosan (10 wt.%) CHGAC1, Chitosan impregnated granular activated carbon with different amounts of chitosan (20 wt.%) CHGAC2 and Granular activated carbon (GAC) was investigated at 105 mg.L-1 initial concentration and 25°C as shown in Figure 6. The adsorption efficiency, increased with increased of adsorbent dosage. A further increased in all adsorbents dosage after 0.8 g showed that not significant affected in the adsorption efficiency due to reach of equilibrium between the adsorbent and adsorbate.
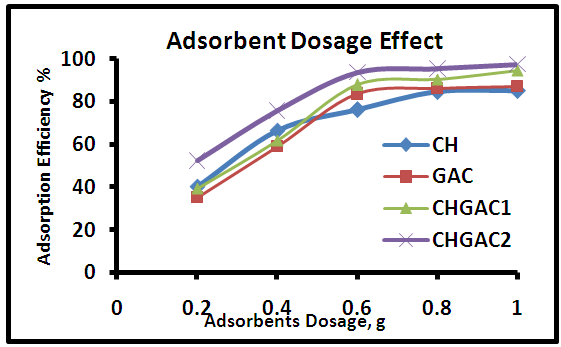 | Figure 6. Effect of adsorbents dosage on the efficiency adsorption of MB dye onto (CH, CHGAC1, CHGAC2 and GAC) |
3.3.2. Effect of pH Solution
- PH is an important factor in controlling the adsorption of dye onto adsorbent. The effect of methylene blue MB solution pH by varying from 2 to 10 on the adsorption efficiency at different adsorbents Chitosan (CH), Chitosan impregnated granular activated carbon with different amounts of chitosan (10 wt.%) CHGAC1, Chitosan impregnated granular activated carbon with different amounts of chitosan (20 wt.%) CHGAC2 and Granular activated carbon (GAC) are shown in the Figure 7.
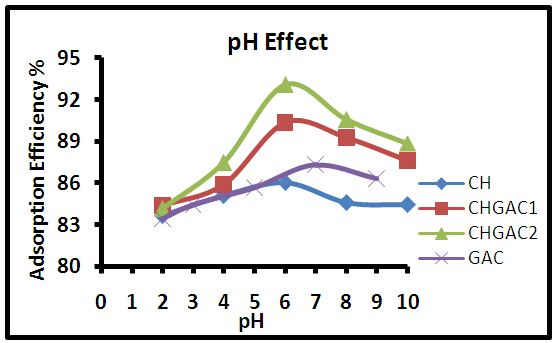 | Figure 7. Effect of initial pH of adsorption of the MB dye solution onto (CH, CHGAC1, CHGAC2 and GAC) adsorbents |
 6 the adsorption efficiency decreased slightly with increasing of pH. The adsorption efficiency of methylene blue MB onto Granular activated carbon GAC increased from pH 2 to 7, then at pH
 7 the adsorption efficiency decreased slightly with increasing pH.This behavior can be explained at low pH, the surface positive functional groups of CH, CHGAC1, CHGAC2 and GAC adsorbents carrying the oxyanions (negatively charged) of the methylene blue MB solution by electrostatic repulsion. Where making H+ reacts with functional groups (amino and hydroxyl groups) may exert electrostatic repulsion with methylene blue MB dye thereby decreasing the adsorption efficiency. These results are in agreement with the work of (E.Oyelude and F. Appiah-Takyi 2012) [33].Whereas at pH 6&7 the adsorption efficiency was significantly increased for methylene blue MB dye due to the amino groups become free from protanation, which reduces to a decrease in the concentration of hydrogen ions leading to the decrease in competition of H+ with MB solution for sorption sites by electrostatic force of attraction, resulting increased of the adsorption efficiency. These results are in agreement with the work of (T. Santhi and S. Manonmani 2009) [34]. Then at higher pH, the increased negative charges on the adsorbent surface decreased the attraction of oxyanions of methylene blue MB dye on the adsorbent, leading to decreased slowly of the adsorption efficiency because it became more complex compound. These results are in agreement with the work of (S. Sugashini and K. Begum 2013) [35].
 3.3.3. Effect of Contact Time
- The effect of contact time on the adsorption efficiency of methylene blue MB dye adsorbed onto each of adsorbents Chitosan (CH), Chitosan impregnated granular activated carbon with different amounts of chitosan (10 wt.%) CHGAC1, Chitosan impregnated granular activated carbon with different amounts of chitosan (20 wt.%) CHGAC2 and Granular activated carbon (GAC) has been experimentally studied by varying time ranging (2, 4, 6, 8 and 10 hours). These results were shown in Figure 8. It is evident from the results that increasing the time from 2 to 6 hours leads to increase rapidly in adsorption efficiency for methylene blue MB dye onto each of (CH, CHGAC1, CHGAC2 and GAC). Then, with the increase of contact time beyond 6 hours, the adsorption efficiency of methylene blue MB dye onto each of adsorbents became constant and increased slowly even reached to adsorption equilibrium between the adsorbate and adsorbent due to saturation of the active site which do not allow more of adsorption to take place.
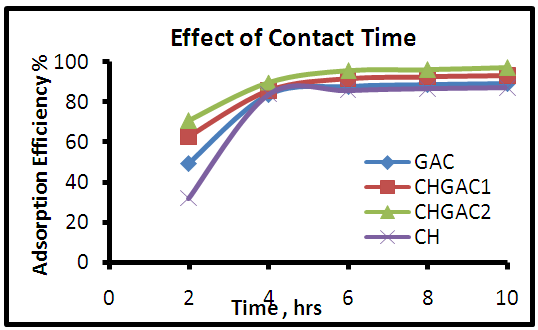 | Figure 8. Effect of contact time for adsorption of MB dye onto (CH, CHGAC1, CHGAC2 & GAC) adsorbents |
3.4. Adsorption Isotherms
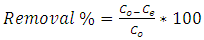
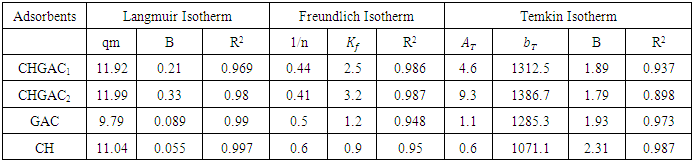
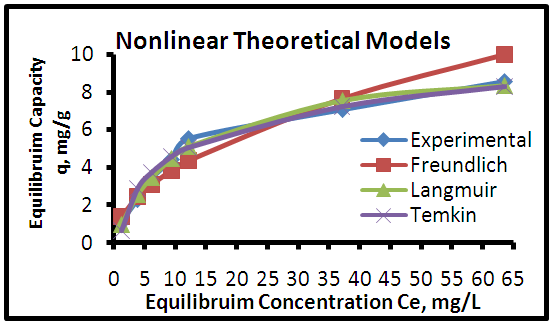
- The adsorption isotherm curves of methylene blue MB dye onto each of Chitosan (CH), Chitosan impregnated granular activated carbon with different amounts of chitosan (10 wt.%) CHGAC1, Chitosan impregnated granular activated carbon with different amounts of chitosan (20 wt.%) CHGAC2 and Granular activated carbon (GAC) GAC at 25°C were conducted by plotting adsorption capacity (mass of adsorbate per unit mass of adsorbent) verses the equilibrium concentration. The adsorption efficiency of the methylene blue MB dye adsorbed was determined using Eq.(4). Figures 9, 10, 11 and 12 show the adsorption isotherm curves for methylene blue MB dye removal onto (CH, CHGAC1, CHGAC2 and GAC) respectively. These Figures describe the experimental data and the theoretical data obtained from Langmiur, Freundlich and Temkin isotherm. All constants and correlation coefficients for Langmiur, Freundlich and Temkin isotherm theoretical model are listed in Table 5.
|
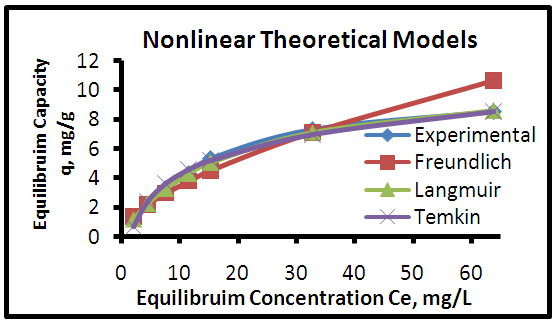 | Figure 9. Adsorption isotherms of experimental and theoretical models of the MB dye onto CH at (25°C, 0.8 g, pH 6.0 & 6 hours) |
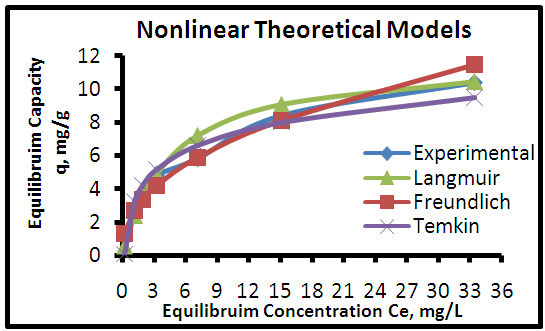 | Figure 10. Adsorption isotherms of experimental and theoretical models isotherm of the MB dye onto CHGAC1 at (25°C, 0.8 g, pH 6.0& time 6 hours) |
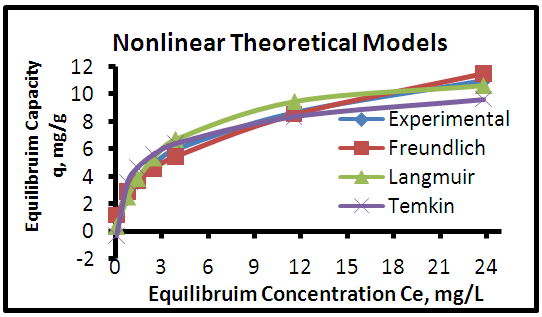 | Figure 11. Adsorption isotherms of experimental and theoretical models of the MB dye onto CHGAC2 at (25°C, 0.8 g, pH 6.0& time 6 hours) |
 | Figure 12. Adsorption isotherms of experimental and theoretical models of the MB dye onto GAC at (25°C, 0.8 g, pH 7.0 & time 6 hours) |
4. Conclusions
- Natural biopolymer “Chitosan” was extracted using locally low cost raw materials (Shrimp Shells), by chemical methods including deproteinization, demineralization, and deacetylation, were investigated. The Chitosan CH will be treated with Granular Activated Carbon GAC by impregnation to be used as adsorbents for the removal of methylene blue dye MB from aqueous solution. The adsorbents were characterized by (FTIR) and (BET). For batch adsorption, the maximum adsorption efficiency of the methylene blue dye MB were found to be 85.85% for Chitosan (CH), 91.7% for chitosan impregnated granular activated carbon with different amounts of chitosan (10 wt.%) CHGAC1, 95.81% for chitosan impregnated granular activated carbon with different amounts of chitosan (20 wt.%) CHGAC2 and 87.75% for Granular activated carbon (GAC) at best adsorbent dosage 0.8 g, best pH 6, 7 and best contact time 6 hrs respectively, and 25°C. The surface of chitosan (CH) possessed highly efficient in the adsorption of dyes by 87.095% compared to the surface of the Granular activated carbon (GAC) the rate was 89.257% of the methylene blue dye (MB) with the adsorption efficiency remained constant and increased slowly. The equilibrium isotherm data for methylene blue dye MB dye adsorption onto (Chitosan CH & Granular Activated Carbon GAC) shows that the Langmuir isotherm fits the experimental data better than Freundlich and Temkin adsorption isotherm. The equilibrium isotherm of methylene blue dye MB adsorption onto Chitosan impregnated granular activated carbon with different amounts of chitosan (10 wt.%) CHGAC1 and Chitosan impregnated granular activated carbon with different amounts of chitosan (20 wt.%) CHGAC2 shows that the Freundlich isotherm fits the experimental data better than Langmuir and Temkin adsorption isotherm.
ACKNOWLEDGEMENTS
- I would first like to thank God for helping me during my studies.I would thank Prof. Dr.Ahmed Ali Moosa and Dr.Ali Mousa. For their kind supervision, advice, reading and criticizing this study,Finally, my best regards to chemistry lab/ University of Technology/Baghdad for there kind support through this study.