American Journal of Materials Science

p-ISSN: 2162-9382    e-ISSN: 2162-8424

2016;  6(5): 115-124

doi:10.5923/j.materials.20160605.01


Adsorptive Removal of Lead Ions from Aqueous Solution Using Biosorbent and Carbon Nanotubes

Ahmed A. Moosa, Ali Mousa Ridha, Noor Amir Hussien

Department of Materials Engineering Technology, Engineering Technical College– Baghdad, Middle Technical, University Baghdad, Iraq

Correspondence to: Noor Amir Hussien, Department of Materials Engineering Technology, Engineering Technical College– Baghdad, Middle Technical, University Baghdad, Iraq.

Email:

Copyright © 2016 Scientific & Academic Publishing. All Rights Reserved.

This work is licensed under the Creative Commons Attribution International License (CC BY).
http://creativecommons.org/licenses/by/4.0/

Abstract

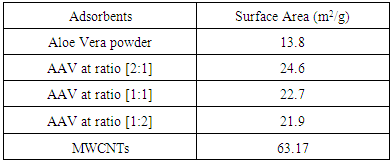
In this work, the removal of poisonous Pb (II) from aqueous solution by different adsorbents was investigated. Aloe Vera plant (AV), activated Aloe Vera leaves powder (AAV) and multi walled carbon nanotubes (MWCNTs) were used as different adsorbents. The modification of Aloe Vera plants was carried out by acid activation. The adsorption process was characterized by FTIR and BET. The results of (BET) showed improvement in surface area of Aloe Vera (AV) after activation from (13.8 m2/g) to (24.6 m2/g). The results of (FT-IR) exhibited new the functional groups such as (C=C, C-Hs, C-Os) of acid activated Aloe Vera. Also the results of (BET) showed MWCNTs have (63.9 m2/g) surface area. The results of (FT-IR) showed MWCNTs have functional groups are (O-H, C=H, C=C). The effect of different parameters such as adsorbent dosage, pH of adsorbate solution and contact time was studied for removing of pb2+ from aqueous solutions onto each of adsorbent of AV, AAV and MWCNTs. The maximum adsorption efficiency of pb2+ onto each of adsorbents at best conditions were selected to be (97.29%) for AV at (2.2 g, pH 5and 6 hr), (97.28%) for AAV at (1.6 g, pH 5 and 6hr) and for MWCNTs are (97.55%) at (0.06 g, pH 5 and 6hr). The equilibrium data characterized by the models. The Freundlich isotherm correlates well with the experimental data than Langmuir and Temkin adsorption isotherm when using AV, AAV and MWCNTs as adsorbent.

Keywords: Adsorption, Heavy metals, Isotherm, Bioadsorption, Carbon Nanotube

Cite this paper: Ahmed A. Moosa, Ali Mousa Ridha, Noor Amir Hussien, Adsorptive Removal of Lead Ions from Aqueous Solution Using Biosorbent and Carbon Nanotubes, American Journal of Materials Science, Vol. 6 No. 5, 2016, pp. 115-124. doi: 10.5923/j.materials.20160605.01.

1. Introduction

Heavy metals are conventionally defined as metallic elements an atomic number >20. The most common heavy metal contaminants are Cd, Cr, Cu, Hg, Pb, and Zn. It was reported by many authors that heavy metals is a term which applies to the group of metals and metalloids with atomic density greater than 4 g/cm3, or 5 times or more, greater than water (Duruibe et al. 2007).
Lead is one the major metal ions hazardous to the human body through inhalation, skin contact or with diet, and can produce adverse effects on virtually every system in the body. Low levels of Pb(II) have been identified with anemia while high levels cause severe dysfunction of the kidneys, liver, the central and peripheral nervous system (Eren et al. 2009). The maximum concentration in drinking water standards identified by 0.05 mg. L−1 for lead (Bala et al. 2008).
Several treatment processes are used For removing heavy metals from wastewater include reduction, precipitation, ion exchange, electrochemical reduction, and reverse osmosis (Annadurai et al. 2012). These processes are expensive, not eco-friendly, high power requirement, incomplete metal removal (Sabat et al 2012).
Adsorption technique is successively alternative process that utilized for removing heavy metals from industrial wastewater, which can be performed in batch mode or continuous process. Adsorption processes have offered flexibility in design and operation and in many cases will produce high-quality treated effluent. Also adsorption is sometimes reversible process, adsorbents can be reformed by the suitable desorption process therefore adsorption mostly method applied to remove metals (Fu and Wang 2011).
Biosorption which applies biological materials, thus process can considered as a relatively modern technology for removing even trace concentrations of heavy metals from wastewater (Matei et al. 2015).
Agricultural and plant waste based by-products have good demonstrated bio-sorption potential for heavy metal ions (Gupta 2015).
CNTs as a good adsorbents have attracted increasing attention of many researchers because of their highly porous and hollow structure, large specific surface areas, capable of π-π electrostatic interaction, light density and strong interaction between CNTs and heavy metal ions and organic compounds (Ren et al 2010), (Chen et al 2009) and (Augusto 2010).
The aim of this work is to study the removal of Pb+2 from wastewater using different adsorbents: Aloe Vera (AV), activated Aloe Vera (AAV) and multi walled Carbon nanotube (MWCNTs) and compare their adsorption efficiency. The influence of adsorbent dosage, pH and contact time on the adsorption efficiency of Pb+2 were investigated to obtain the better operating conditions of adsorption process. The adsorption isotherm models, namely Langmuir, Freundlich and Temkin were studied to describe the adsorption equilibrium.

2. Materials and Methods

1) Adsorbate
Lead Nitrate salt Pb(NO3)2 was used to prepare 1000 mg/L standard stock solution of Pb (II) solution. A 50 ml of distilled water was added to 50 ml of HNO3 in a 100 ml beaker and stirred using a magnetic stirrer. Distilled water was then added to get 1000 ml of acidic solution of lead nitrate with stirring. This acidic solution was added to 1.78gm of Pb (NO3)2. Distilled water was then added to get 1000 ml of acidic solution of lead ions with stirring. Atomic absorption spectrometer showed that the concentration of lead ion solution is 1000 ppm. The pH of the lead ions initial concentration was adjusted to a certain pH by adding NaOH or HCl.
2) Adsorbents
A) Aloe Vera Plant
Fresh green Aloe Vera leaves were collected from local gardens. The collected leaves were washed extensively with distiller water for several times to remove dust. These leaves were cut into equal sized pieces and allowed to dry in the sun for 5 days so as to remove the water and the keeping of the Aloe Vera components. Then the leaves were dried in an oven at 50°C for 2 hours. The dried Aloe Vera leaves were then ground using a home electrical grinder into fine powder. Finally, the bioadsorbent powder was sieved to obtain [75-125μ] particle sizes and kept in an airtight container.
A.1) Acid Activation of Aloe Vera Powder (AAV)
Aloe Vera powder was acid activation by using [HNO3: H2SO4] at different ratio [2:1], [1:2] and [1:1]. 1 g of Aloe Vera powder was added to 20 ml of acid solution and then mixed using a magnetic stirrer for 6 hrs at 120 rpm. After that Aloe Vera acid solution was left for 24 hours at room temperature followed by washing several times with distal water until pH reached a constant value. After this processing, the modified Aloe Vera was dried in a furnace at 80°C for 6 hrs and the acquired acid activation Aloe Vera (AAV).
B) Multi Walled Carbon Nanotube (MWCNTs)
High Purity 99%, Multi Wall Carbon Nanotubes (MWCNTs), Intelligent Materials Pvt. Ltd., Punjab, India will be used as an adsorbent. MWCNTs have length 10-20 nm and a diameter between 3-8 µm.
B.1) Functionalization of MWCNTs
CNTs are materials practically insoluble, or difficult to disperse, in any kind of solvent. Chemical functionalization is used to attache different functional groups on the side wall or end caps of nanotubes without significantly changing their desirable properties (Dobrzański et al. 2010). 0.5 g of MWCNTs was immersed in 500 ml of mixture of concentrated (HNO3:H2SO4) (1:3 by volume) at room temperature. The MWCNTs solution with acid was ultrasonicated using ultrasonic path at (frequency 60 KHz, power 140 W) for 40 min at 40°C. The solution was then diluted 15 times with deionized water and then filtered using vacuum filtration system with 0.2 μm pore size filter papers. This washing operation was repeated until the pH became the same as that of deionized water. The MWCNTs on the filter paper was then left to dry at room temperature for 12 hours. After drying a sharp blade is used to remove CNTs from the filter paper and then dried in an oven at 60°C for 6 hrs (Moosa et al. 2010) (Moosa et al. 2015).
C) Characterization of Adsorbents
The specific surface area of AV, AAV, and MWCNTs were measured using the BET analysers (model 9600, USA). AV, AAV and MWCNTs were characterized using the Fourier-Transformation Infrared Spectra (FT-IR) (IRTracer-100 / Shimadzu Co. / USA).
D) Batch Adsorption System
D.1) Adsorbent Dosage
The best of adsorbent dosage for adsorption of Pb(II) ions onto Aloe Vera, acid treated Aloe Vera powder and MWCNTs were obtained experimentally. Different dosage (0.2, 0.4, 0.6, 0.8, 1, 1.2, 1.4, 1.6, 1.8, 2, 2.2, 2.4g) for Aloe Vera and activated Aloe Vera powder, (0.02, 0.04, 0.06, 0.08 and 0.1g) for MWCNTs was added to 50 mL with initial concentration of 100mg/L of pb2+ solution. The pH of each solution was adjusted to desired 5.45 using dilute of NaOH or HCl. The solution was then shaken for about 5hrs in a rotary shaker at fixed speed 125 rpm and temperature of 25°C. The samples were then filtered and the remaining concentration of pb2+ was measured by atomic-absorption spectrophotometer. The best dosage of AV, AAV and MWCNTs were chosen at maximum adsorption efficiency (maximum removal).
D.2) Effect of pH
In order to obtain the optimum pH for adsorption of Pb(II) onto AV, AAV, and MWCNTs a series of batch experiments were conducted at various pH in the range of (1, 2, 3, 4, 5, 6 and 7) for Pb(II). The best dosage of AV, AAV and MWCNTs were added to 50 mL with initial concentration of 100mg/L of pb2+. The pH of solutions was adjusted to desired value using dilute of 1M NaOH or 1M HCl. The solution was placed in bottles and then agitated for about 5 hrs in a shaker at 125 rpm and 25°C. The samples were then filtered and the remaining concentration of Pb2+ was measured by atomic-absorption spectrophotometer. The best pH of lead solution was then obtained at maximum adsorption efficiency (maximum removal).
D.3) Effect of Contact Time
The effect of contact time on the adsorption of Pb(II) onto AV, AAV and MWCNTs was investigated using various adsorption times from 2hr to 10hr. The solutions of Pb+2 was adjusted to the best pH with the initial concentration 100 mg/L. A volume 50 mL of Pb(II) solutions was placed in the bottles. The best dosage of each AV, AAV and MWCNTs were added to each bottle. The solution in the bottles was agitated for different times in a shaker with water bath at 125 rpm and 25°C and then filtered. The equilibrium concentration of lead ions was determined by atomic-absorption spectrophotometer. The best time was then obtained at maximum adsorption efficiency (maximum removal).
E) Equilibrium Isotherms
The equilibrium isotherms for adsorption of Pb+2 ions onto AV, AAV and MWCNTs were performed experiments using the best dosage for each adsorbents, the best pH of Pb+2 ions solutions and best adsorption period. The solutions of Pb+2 ions with different initial concentration (20, 40, 60, 80, 100, 150 and 200 mg/L) were adjusted to the best pH of Pb+2 ion solutions. A 50 mL of Pb+2 ion solutions was placed in the bottles. Best dosage of AV, AAV and MWCNTs were added to each the bottle. The samples in the bottles were agitated at 125 rpm and at 25°C. The samples were then filtered and the remaining concentration of lead ions was measured by atomic-absorption spectrophotometer.
E.1) Langmuir Isotherm Model
The Langmuir model considered the first theoretical of nonlinear sorption, which sorption occur on a homogenous surface without interaction between adsorbed molecules. These models depend on three conditions: adsorption process works on monolayer only, every surface of his ability on the adsorption equality and the ability of active side to adsorb was changed from one to another (Dada et al. 2012).
The Langmuir isotherm equation is (Dada et al. 2012)
(1)
To use should be derived into linear
(2)
Where
Ce is the equilibrium concentration of adsorbate (mg/L)
qe is a capacity of adsorption process at equilibrium (mg/g)
Is a maximum capacity of active site (mg/g)
KL is the Langmuir constant (L/mg).
E.2) Freundlich Isothermal
The Freundich (1906) is an equation depended on adsorption on a heterogeneous surface, this model is applied to calculate the adsorption intensity of the adsorbate on the adsorbent (Kalalagh et al. 2011).
The Freundlich model equation is (Kalalagh et al. 2011)
(3)
The above equation can be rewritten in the logarithmic form as
(4)
n is the Freundich exponent constant.
KF is the adsorption capacity of adsorbent (L/g).
E.3) Temkin Isotherm
The Temkin (Temkin, 1940) isotherm equation supposes that the heat of adsorption of all the molecules in layer reduces linearly with covering due to adsorbent-adsorbate interactions, and that the adsorption is described by a uniform distribution of the binding energies, until some maximum binding energy (Kalalagh 2011).
Temkin model was used to measure the adsorption potentials of the adsorbent for adsorbates.
Temkin model represented by (Kalalagh 2011).
(5)
The linearization of equation obtained
(6)
Where
T is an absolute temperature (K)
R is a gas constant (8.314 J/mol.K)
KT is the equilibrium binding constant (L/mg)
bT is the adsorption energy (KJ/Mol)
BT is the Temkin constant (KJ/Mol).

3. Results and Discussion
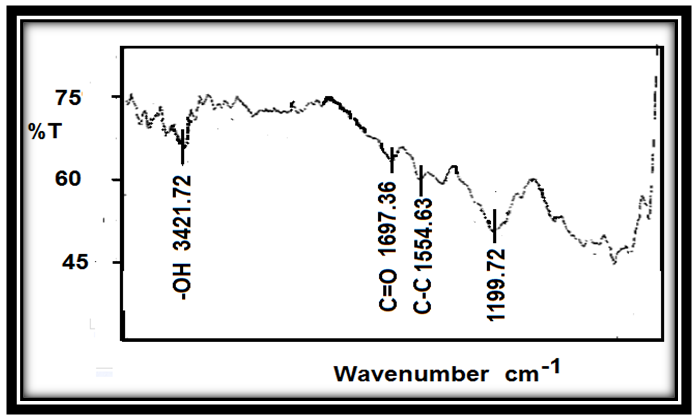
A) FT-IR
The Fourier Transform Infrared Spectrophotometer, FTIR, spectra of Aloe Vera is shown in Figure 1. The presence of strong and broad intensity band around (3410.15 cm-1) was assigned to phenolic OH stretching (Ray and Gupta 2013) and (Ray et al. 2013). The peak at 2924.09 cm-1 corresponds to -CH stretching that might be due to H-bond formation at higher concentrations. The absorbance bands were seen in the range of 1732.08 cm-1 and 1269.16 cm−1 which attributed to C=O and C-O-C stretching of acetyl groups present in the sample (Kiran and Rao 2014). Moreover, the bands at 1650–1578 cm−1 implied the presence of C=O stretching and indicated the presence of carboxyl components and phenolic compounds which are polar in nature (Ray and Gupta. 2013) and (Ray et al. 2013). The absorbance spectrum at around 1732.08 cm−1, 1597.06 cm−1, and 1269 cm−1 can be accounted for the presence of C=O, COO-, and C-O-C stretches of acetyl groups (Hulle et al. 2014) and (Femenia et al. 2003). The CH3 and COO (corresponds to 1431.18 cm−1). The identification of strong bands in the range of 1076.26-1033.85 cm-1 due to the presence of polysaccharide sugars, such as galactose and glucans (Barandozi & Enferadi 2012).
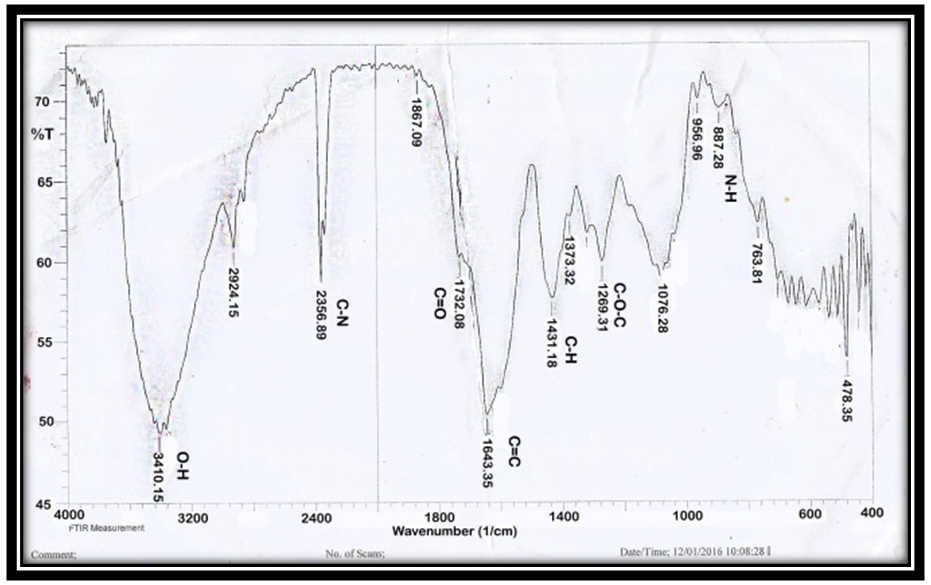
Figure 1. FT-IR of Aloe Vera
The FT-IR spectra of Aloe Vera powder were acid activated with a mixture of [HNO3: H2SO4] at different ratio [1:2], [2:1] and [1:1] at 25°C are shown in Figure 2, 3, 4. At 3430 cm-1 peaks represent the O-H stretching vibration, after modification these peaks change to 3491.16, 3290.56, 3452.58 cm-1 of [2:1] [1:1] and [1:2] respectively. At 2920 cm-1 peaks corresponds to C-H stretching vibrations which appear in [2:1] and [1:2]. At 1730 cm-1 give induction for C=O stretching vibration of carboxyl groups, then variation to 1735.93, 1732.08, 1743.65 cm-1 of [2:1] [1:1] [1:2] respectively. While peaks at 1620 cm-1 represent to C=C of alkenes, this appearance in each one at peaks 1643.35, 1643.35, 1639.49 cm-1 of [2:1] [1:1] [1:2] respectively. The peaks at 1230 cm-1 corresponds to –O-H bending vibration and at 1030 cm-1 represent to C –O stretching vibration of carboxylic acid (Shouman and Khedr 2015).
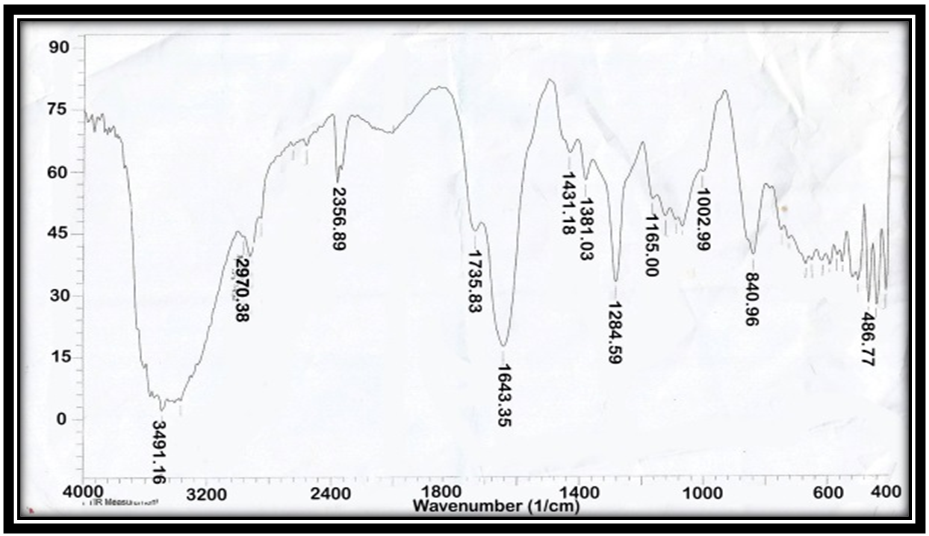
Figure 2. FT-IR of AAV at [2:1]
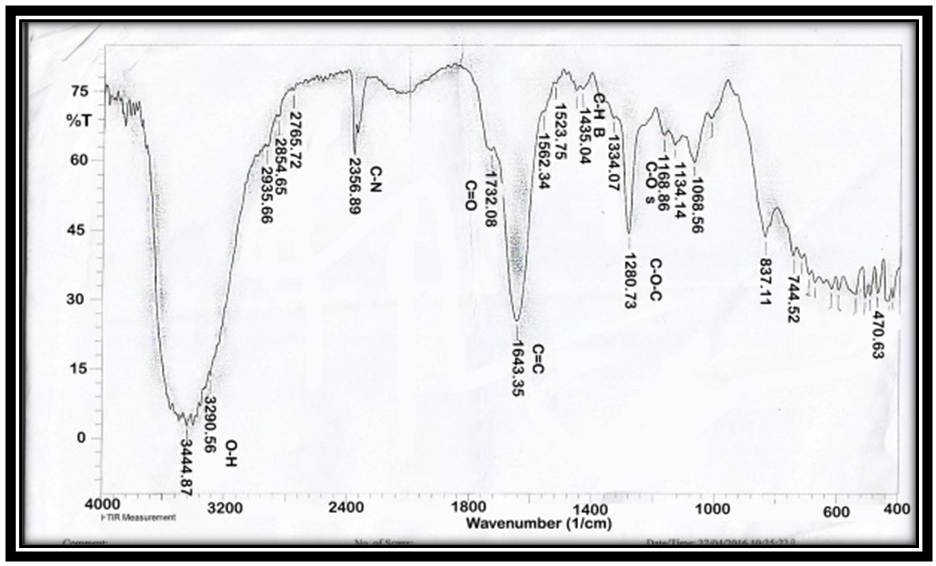
Figure 3. FT-IR of AAV at ratio [1:1]
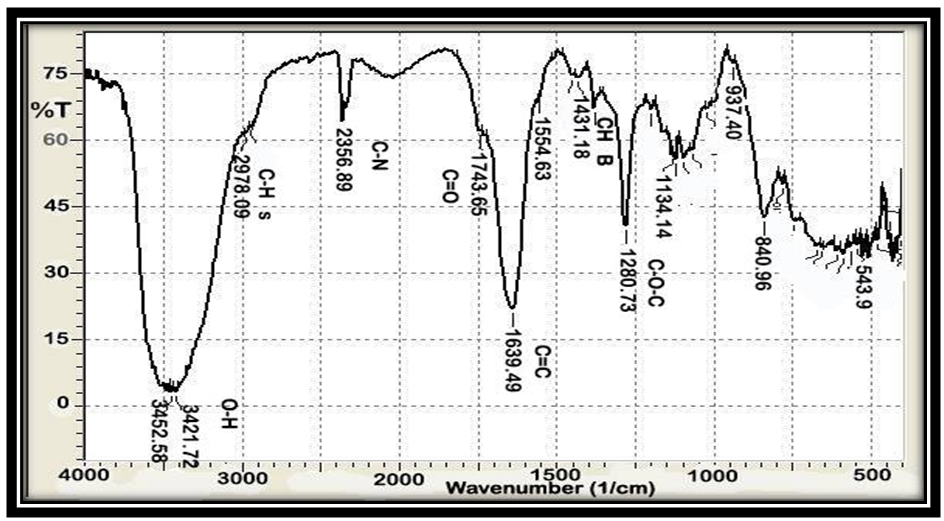
Figure 4. FT-IR of AAV at [1:2]
The FTIR spectra of the acid functionalized MWCNTs is shown in Figure 5. The spectra show a broad peak at ~3421.72 cm−1 which is assigned to the O-H stretch of the hydroxyl group from carboxyl groups (O=C−OH and C−OH) on the surfaces of acid functionalized MWCNTs. The peak signal appeared at 1554.63 cm-1 is associated with the carbon nanotubes backbone stretching mode. The peak at 1199.72 cm−1 may be associated with C–O stretching in the same functionalities. The presence of this peak gave an idea that the structure of MWCNTs was preserved after under has gone acid treatment (Ovejero et al. 2006).
Figure 5. FT-IR of MWCNTs
B) Surface Area of Biosorbents and MWCNTs
Aloe Vera leaves powder was acid activated with a mixture [HNO3:H2SO4] at different ratio [1:2], [2:1] and [1:1] at 25°C. The surface area of acid activation of the Aloe Vera leaves powder using the BET analysis as shown in Table 1. The results show that the acid activation of the Aloe Vera caused some modifications in the structure of the Aloe Vera may be increase irregular surface and porous structure. The surface area of Aloe Vera powder is 13.8 m2/g. The results offer that the surface area increased as the concentration of the acid treatment increased thereafter decreased with further increase in the concentration of acid activation (Ajemba 2013). At ratio [2:1] observed large surface area (24.6 m2/g) compare with other activation ratio.
Table 1. Surface Area of Different Biosorbents and MWCNT by BET Analysis
     
The specific surface area of MWCNTs was measured by BET method. MWCNTs have large surface area 63.17 (m2/g) compare with the Aloe Vera plant.
C) Effect of Adsorbents Dosage
The effect of different dosages (0.2, 0.4, 0.6, 0.8, 1, 1.2, 1.4, 1.6, 1.8, 2.2, 2.4 g) of each AV and AAV as shown in Figures 6. From Figure 6, it can be seen that the adsorption efficiency was increased gradually when the AV dosage increase, which varied from 30.18% to 97.64% of Pb ions. The adsorption efficiency of Pb increased gradually up to 2.2 g of AV. A further increase in AV dosage beyond 2.2g shows no enhancement in the adsorption efficiency of Pb due to reach the equilibrium state between the solid (adsorbent) and liquid (adsorbate). This behavior can be explained by the available number of adsorption sites and the surface area increases with increasing the adsorbent weight. This is in agreement with (Abudaia et al. 2013). The best dosage of AV was obtained at 2.2 g for removing lead ions.
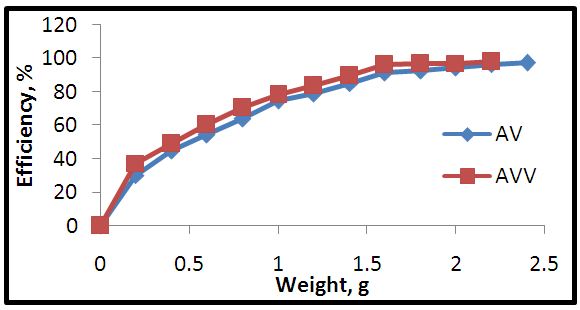
Figure 6. Effect of different adsorbent dosage on the adsorption process
From Figure 6, it can be seen that the adsorption efficiency was increased greatly when the AAV dosage increase, which varied from 37.36% to 98.18% of Pb. The adsorption efficiency of Pb graded up to 2.2 g of AAV. This behavior can be explained by the available number of adsorption sites and the surface area increases with increasing the adsorbent weight. This is in agreement with the work of (Khichi et al. 2011). The best dosage of AAV was obtained at 1.6 g of lead.
The effect of different dosages (0.02, 0.04, 0.06, 0.08, 0.1) g of MWCNTs as shown in Figures 7. The adsorption efficiency was increased rapidly when the MWCNTs dosage increase, which varied from 94.25 % to 98.66 % for Pb ions. This is due to the amount of ions bounds to the adsorbent and the rate of free ions becomes constant with the increase of adsorbent dose and the functional site on the adsorbent surfaces increase with increasing adsorbent dosage therefore the efficiency of removal metal ions increase. This is in agreement with the work of (Atieh 2011) and (Wang et al. 2013). The best dosage of MWCNTs was obtained at 0.06 g for lead.
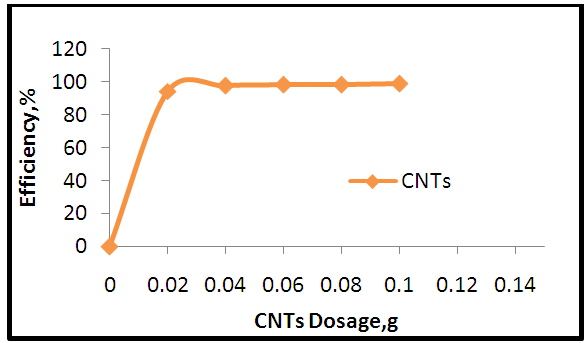
Figure 7. Effect of MWCNT dosage on the adsorption process
D) Effect of pH Lead Solutions on the Adsorption Process
The effect of different pH (2, 3, 4, 5, 6 and 7) of lead solution as shown in Figure 8. From Figure 8 it is evident from the results that the adsorption efficiency started to be gradually increased with increase pH from 2 to 5 onto AV. The maximum adsorption efficiency was acquired 92.96% at pH 5. Whereas at pH 6 and above the adsorption efficiency was decreased due to high concentration of proton in Pb+2 solution and this proton contend with metal ions in forming a bond with the functional groups on the surface of the adsorbent. These bonded functional groups be saturated and was inaccessible to other ions (Pavasant et al. 2006).
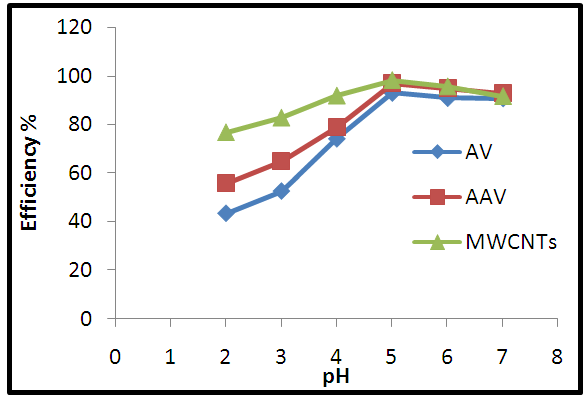
Figure 8. Effect of pH on adsorption process
The maximum adsorption efficiency of AAV was obtained 96.98% at pH 5 as shown in Figure 8. This result can be explained by negative charge on the active site of AAV and the ionic state of ligands is such to elevate the adsorption of metal ions. Whereas at pH 6 and above the adsorption efficiency was significantly decreased for Pb ions may be by mechanism precipitation. This is in agreement with the work of (Malik et al. 2015).
It is evident from the results that the adsorption efficiency of MWCNTs started to be greatly increased from 76.66% to 98.08% with increase pH from 2 to 5. At lower pH, the minimum uptake occurs due to higher concentration and mobility of H+, then the adsorbent's surface be more positively charged so that the attraction between active sites and metals cations is decreased. The maximum adsorption efficiency was obtained 98.08% at pH 5. Whereas at pH 6 and above the adsorption efficiency was significantly decreased for each metals due to the low solubility of hydrolyzed metal species could have resulted into precipitation. The above results are confirmed by (Onundi et al. 2011).
E) Effect of Contact Time on the Adsorption Process
The effect of different time (2, 4, 6, 8 and 10) hrs on the adsorption process as shown in Figure 10. It can be seen that the adsorption efficiency of AV was increased gradually when the contact times increase reached to maximum adsorption 98.13% after 6 h because of contact time process provides the energy required to bring metal ions from solution to the active sites of the adsorbent. A further increase in contact times shows no enhancement in the adsorption efficiency of Pb due to reach the equilibrium state. The above results are confirmed by (Rajoriya and Kaur, 2014).
It can be seen that the adsorption efficiency of AAV was increased greatly when the contact times increase. The adsorption efficiency of Pb increased rapidly up to 97.35% after 6 hours. A further increase in contact times shows no enhancement in the adsorption efficiency of Pb due to reach the equilibrium state. Through the initial stage of adsorption process, great number of vacant surface site is obtainable for adsorption. Then these vacant sites may be occupied difficulty because of the repulsive force between the solute molecules on the adsorbent surface and metal ions (Zhang et al. 2014).
It can be seen that the adsorption efficiency of MWCNTs was increased rapidly when the contact times increase as shown in Figure 9. The efficiency of removal increases with increasing time due to the initial concentration gradient between the adsorbate in solution and the number of vacant sites available on the CNT surface. The adsorption efficiency of Pb increased rapidly up to 98.89% at contact time 6 hours. A further increase in contact times shows no enhancement in the adsorption efficiency of Pb due to reach the equilibrium state because of reduction in the available active sites on the adsorbent due to limit mass transfer of the adsorbate molecules from the bulk liquid to the external surface of MWCNTs (Onundi et al. 2011).
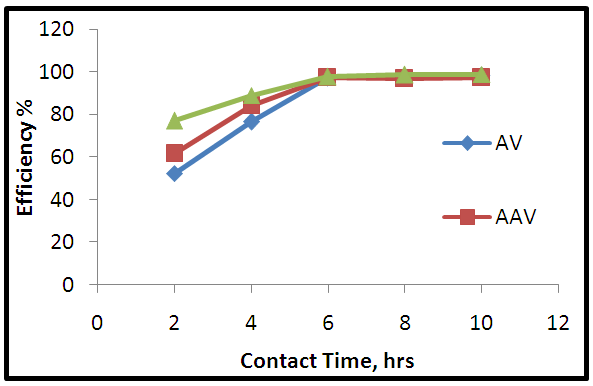
Figure 9. Effect of contact time in adsorption process
F) Equilibrium Isotherm
The experimental results of the adsorption isotherm curves were obtained by plotting capacity of adsorption against the equilibrium concentration of the adsorbate. Figures 10, 11, 12 show the adsorption isotherm curves for Pb+2 ions onto AV, AAV and MWCNTs respectively at 25°C.
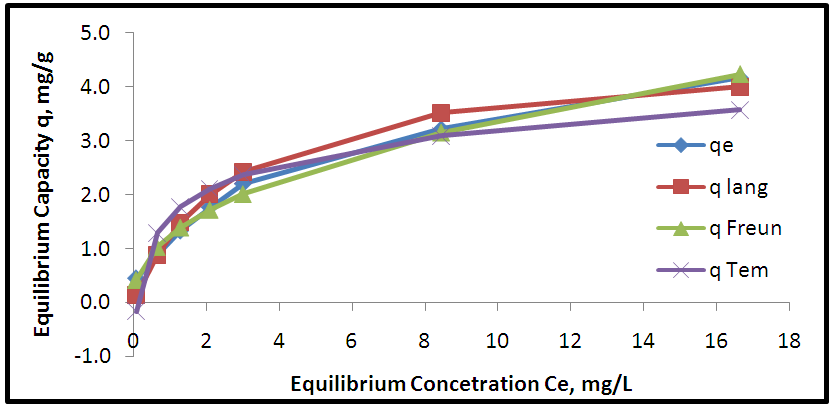
Figure 10. Adsorption isotherms of experimental and theoretical models for adsorption of Pb onto AV
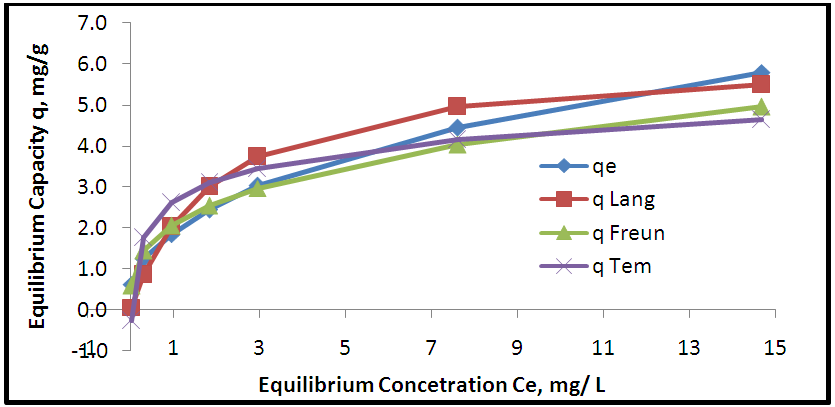
Figure 11. Adsorption isotherms of experimental and theoretical models for removal Pb onto AAV
The results from Figure 10 indicate that the adsorption capacity of Pb+2 ions increases with increasing the solution concentration. This behavior could be explained by very strong surface interaction between metal ions Pb+2 and adsorbents. The above results are confirmed by by (Yarkandi 2014). After comparison between the values of correlation coefficients from Table 2 for various isotherms for Pb adsorption onto AV, it can be concluded that the Freundlich isotherm is a better model to describe the experimental adsorption data than Langmuir and Temkin isotherms.
Table 2. Langmuir, Freundlich, Temkin Isothermal Constants for Pb Adsorption onto Different Adsorbent
     
According to Figure 11 and to the values of the correlation coefficients from Table 2, it can be concluded that the Freundlich isotherm is a better model to describe the experimental adsorption data than Langmuir and Temkin isotherms. This indicated that the surface of the adsorbent was nonuniform. The above results are confirmed by (Zhang, et al. 2014).
From Figure 12 and the value of correlation coefficients R2 from Table 2, it can be concluded that the Freundlich model gives a better fit to the experimental data than the Langmuir and the Temkin adsorption isotherm for lead ion metal. This indicates that CNTs have great potential to be used as a good adsorbent for the removal of Pb(II) ions in water treatment than AV and AAV.
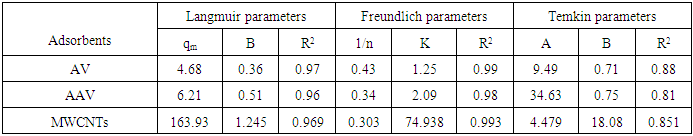
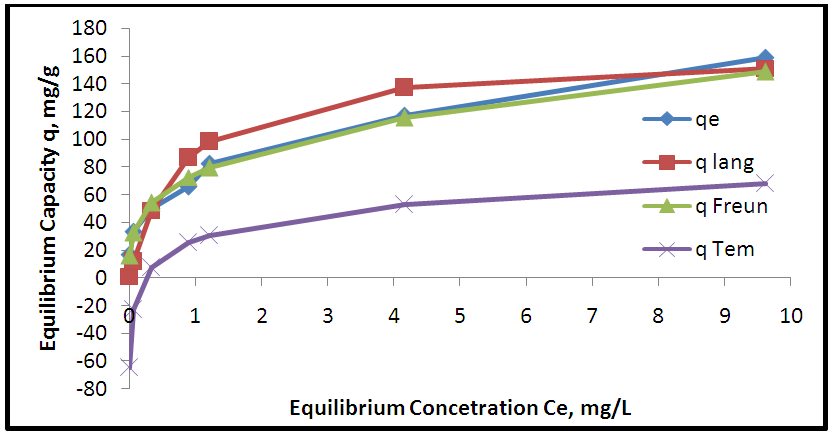
Figure 12. Adsorption isotherms of experimental and theoretical models for the removal of Pb onto MWCNTs

4. Conclusions

Aloe Vera is a cheap, available and effective adsorbents for removal Pb+2 from aqueous solution. The maximum adsorption efficiency of removing lead ions is (96.49%) at 2.2 g of Aloe Vera. Acid activation Aloe Vera with acid [HNO3: H2SO4]. After activation of Aloe Vera leaves powder observe improvement in surface area from 13.8 m2/g to 24.6 m2/g and gave better removal efficiency of lead ions (96.27%) at 1.6 g. The functionaliztion of MWCNTS is an effective adsorbent for removing Pb+2 ion from aqueous solution. MWCNTs have large surface area (63.17 m2/g). The maximum adsorption efficiency (98.07%) at 0.06 g of MWCNTs. The maximum adsorption occurred at pH5 for lead. The maximum adsorption efficiency occurs after 6 hours for all adsorbent. The equilibrium data characterized by the Langmuir, Freundlich and Temkin isotherm. Isotherm equations and correlation coefficient R2 showed that Freundlich isotherm fits the experimental data better than Langmuir and Temkin for lead ions when using AV, AAV, MWCNTs as an adsorbent.

ACKNOWLEDGEMENTS

The authors would like to acknowledge the Engineering Technical College-Baghdad for their encouragement, help and their interest in my project.

References

[1]  A. Moosa, A. M. Ridha and I. N. Abdullha, Chromium Ions Removal from Wastewater Using Carbon Nanotubes, Int. J. of Innovative Rese. in Sci. Eng. and Tech., Vol. 4, pp. 275- 282, 2015.
[2]  A. Moosa, A. Q. Faisal and R. M. Namus, Surface Modification of Multiwall Carbon Nanotubes for Metal Matrix Nanocomposite Applications, Eng. and Tech. J. , Vol.32, Part (A), No.7, pp.1859- 1869, 2014.
[3]  A. Ray and S. Dutta Gupta, ''A panoptic study of antioxidant potential of foliar gel at different harvesting regimens of Aloe Vera L''. Industrial Crops and Products .Vol. 51, pp.130–137, 2013.
[4]  Augusto, F., E. Carasek and R. Gomes, ''New Sorbents for Extraction and Microextraction Techniques'', J. Chromat. A., Vol. 1217, pp. 2533-2542, 2010.
[5]  Bala, M, S. R. A. and Lawal and M., ''Determination of Level of Some Heavy Metals in Water Collected from Two PollutionـــProne Irrigation Areas Around Kano Metropolis'', Vol. 1, No.1, pp. 35-38 , 2008.
[6]  C.L. Chen, J. Hu, D.D. Shao, J.X. Li and X.K. Wang, ''Adsorption Behavior of Multiwall Carbon Nanotube/Iron Oxide Magnetic Composites for Ni(II) and Sr(II)'', J. Hazard. Mat., Vol. 164, pp. 923–928, 2009.
[7]  D. S. Khichi, S. Bhati, A. Gupta, Adsorption of Methylene Blue Dye by Using Chemically Activated Low Cost Adsorbent: Azadirecta Indica Leaves, Inv. Rap.Wat.& Envir., pp.1-3, 2011.
[8]  Dada, A.O, Olalekan, A.P, Olatunya, A.M., DADA and O, ''Langmuir, Freundlich, Temkin and Dubinin–Radushkevich Isotherms Studies of Equilibrium Sorption of Zn2+ Unto Phosphoric Acid Modified Rice Husk'', IOSR J. of App. Chem., Vol. 3, pp.38-45, 2012.
[9]  E. Eren, B. Afsin, Y. Onal, ''Removal of Lead Ions by Acid Activated and Manganese Oxide-Coated Bentonite'', J. of Hazard. Mat., Vol.61, pp. 677–685, 2009.
[10]  F. Fu and Q. Wang, ''Removal of Heavy Metal Ions From Wastewaters'', J. of Env. Mang., Vol. 92, pp.407-418, 2011.
[11]  F. N. Barandozi and S. T. Enferadi, ''Organic and Medicinal Chemistry'', http://www.orgmedchemlett.com/content/2/1/3, Vol. 2, pp.33, 2012.
[12]  G. Annadurai, R.S. Juang and D.J. Lee, ''Adsorption of Heavy Metals From Water Using Banana And Orange Peels'', Wat. Sci and Tech., Vol.47, No.1, pp.185-190, 2002.
[13]  G. Annadurai, R.S. Juang and D.J. Lee, ''Adsorption of Heavy Metals From Water Using Banana And Orange Peels'', Wat. Sci and Tech., Vol.47, No.1, pp.185-190, 2002.
[14]  G. Ovejero, J. L. Sotelo, M. D. Romero, A. Rodrıguez, M. A. Ocana, G. Rodrıguez, and J. Garcıa, ''Multiwalled Carbon Nanotubes for Liquid-Phase Oxidation'', Functionalization, Characterization, and Catalytic Activity, Ind. Eng. Chem. Res., Vol.45, No 7, pp. 2206–2212, 2006.
[15]  J. A. Abudaia, M. O. Sulyman, K. Y. Elazaby, and S. M. Ben-Ali, Adsorption of Pb (II) and Cu (II) from Aqueous Solution onto Activated Carbon Prepared from Dates Stones, Int. J. of Env. Sci. and Devel., Vol. 4, No. 2, 2013.
[16]  J. Wang, P. Liu, Z. Li, W. Qi, Y. Lu, W. Wu and Th, ''Adsorption onto Oxidized Multi-Walled Carbon Nanotubes in the Presence of Hydroxylated Fullerene and Carboxylated Fullerene, doi:10.3390/ma6094168, Vol. 6,pp. 4168-4185, 2013.
[17]  J.O. Duruibe, M.O.C. Ogwuegbu and J.N. Egwurugwu "Heavy Metal Pollution and Human Biotoxic Effects'', Int. J. of Phy. Sci., Vol. 2, No. 5, pp.112 -118, 2007.
[18]  J.O. Duruibe, M.O.C. Ogwuegbu and J.N. Egwurugwu "Heavy Metal Pollution and Human Biotoxic Effects'', Int. J. of Phy. Sci., Vol. 2, No. 5, pp.112 -118, 2007.
[19]  L.A. Dobrzański, M. Pawlyta, A. Krztoń, B. Liszka and K. Labisz, Synthesis And Characterization of Carbon Nanotubes Decorated With Platinum Nano Particles, J. of Achieve. in Mat. and Manufact. Eng., Vol. 39, No. 2, pp. 184-189, 2010.
[20]  M. A. Atieh, ''Removal of Zinc from Water Using Modified and Non-Modified Carbon Nanofibers'', Int. Conf. on Envir. Sci. and Tech., Vol. 6, pp.220-223, 2011.
[21]  M. A. Shouman and S. A. A. Khedr, ''Removal of Cationic Dye from Aqueous Solutions by Modified Acid - Treated Pomegranate Peels (PUNICA GRANATUM): Equilibrium and Kinetic Studies'', Asian J. of App. Sci., Vol.3, pp. 1-15, 2015.
[22]  Mr. G.M. Matei, Dr. J.K. Kiptoo, Prof. N. Oyaro and Dr. A. O. Onditi, Biosorption of Selected Heavy Metals by Green Algae, Spirogyra, Chem. and Mat. Rese., Vol.7 No.7, 2015.
[23]  N. H. Yarkandi, ''Removal of Lead (II) From Waste Water by Adsorption'', Int. J. Curr. Microbiol. App.Sci, Vol. 3, no.4, pp. 207-228, 2014.
[24]  N. R. S. Hulle, K. Patruni and P. S. Rao, ''Rheological Properties of Aloe Vera (Aloe Baradensis Miller) Juice Concentrates'' J. of Food Pro. Eng., pp.1-13, 2013.
[25]  N.A. Buang, F. Fadil, Z. A. Majis and S. Shahir, ''Characterization of Mild Acid Functionalized Multiwalled Carbon Nanotubes Towards High Dispersion With Low Structural Defects'', Digest J. of Nanomaterials and Bio., Vol. 7, No. 1, pp. 33 – 39, 2012.
[26]  P. Pavasant, R. Apiratikul, V. Sungkhum, P. Suthiparinyanont, S. Wattanachira and T. F. Marhaba, ''Biosorption of Cu2+, Cd2+, Pb2+, and Zn2+ Using Dried Marine Green Macroalga Caulerpa lentillifera'', Bio. Tech., Vol. 97, pp. 2321–2329, 2006.
[27]  P. Kiran and P.S. Rao, ''Rheological and Structural Characterization of Prepared Aqueous'', Food Rese. Int., Vol. 62, pp. 1029-1037, 2014.
[28]  R. Malik, S. Lata and S. Singhal, ''Removal of Heavy Metal From Wastewater by the Use of modified Aloe Vera leaf powder'', Int. J. of Basic and App. Chem.Sci.,Vol.5, No.2, pp. 6-17, 2 015.
[29]  R. O. Ajemba, Alteration of Bentonite from Ughelli by Nitric Acid Activation: Kinetics And Physicochemical Properties, Ind. J. of Sci. and Tech., Vol.6, pp.102-109, 2013.
[30]  Ray, A., Aswatha and S. M., ''An Analysis of the Influence of Growth Periods on Physical Appearance, and Acemannan and Alemental Distribution of Aloe Vera L. gel''., Industrial Crops and Products, Vol. 48, pp.36–42, 2013.
[31]  S. Rajoriya and B. Kaur, “Adsorptive Removal of Zinc from Waste Water by Natural Biosorbents,” Int. J. Eng. Sci. Invent., Vol. 3, No. 6, pp.60-80, 2014.
[32]  S. Sabat, R.V. Kavitha, S. S.L, G. Nair, M. Ganesh and N. Chandroth, ''Biosorption: An Eco-Friendly Technique for the Removal of Heavy Metals'', Ind. J. of App. Rese., Vol. 2, pp. 1-8, 2012.
[33]  S. Mukesh, M.B. Patil, S. Shalini and B.V ishnu. ''Alea Vera: Plant of Immortality'', Int. J. of Phar. Sci. and Rese..Vol. 1, No.1, pp. 7-10, 2010.
[34]  Sh. S.-Kalalagh, H. Babazadeh1, A. H. Nazemi and M. Manshouri, ''Isotherm and Kinetic Studies on Adsorption of Pb, Zn and Cu by Kaolinite'', J. Env. Sci., Vol. 9, No.2, pp. 243-255, 2012.
[35]  V. K. Gupta, A. Nayak and S. Agarwal, ''Bioadsorbents for Remediation of Heavy Metals: Current Status and Their Future Prospects'', Environ. Eng. Rese. , Vol. 20, No. 1, 2015.
[36]  X. Ren, C. Chen, M. Nagatsu and X. Wang, ''Review Carbon Nanotubes As Adsorbents in Environmental Pollution Management'', Chem. Eng. J., 2010.
[37]  Y. B. Onundi, A. A. Mamun, M. F. Al Khatib, M. A. Al Saadi and A. M. Suleyman, ''Heavy metals removal from synthetic wastewater by a novel nano-size composite adsorbent'', Int. J. Environ. Sci. Tech., Vol.8, No. 4, pp. 799-806, 2011.
[38]  Y. Zhang, R. Zheng, J. Zhao, F. Ma, Y. c. Zhang and Q. Meng, Characterization of H3PO4-Treated Rice Husk Adsorbent and Adsorption of Copper(II) from Aqueous Solution, Bio. Med. Rese. Int., doi.org/10.1155/2014/496878, 2014.