-
Paper Information
- Paper Submission
-
Journal Information
- About This Journal
- Editorial Board
- Current Issue
- Archive
- Author Guidelines
- Contact Us
American Journal of Materials Science
p-ISSN: 2162-9382 e-ISSN: 2162-8424
2016; 6(4): 95-104
doi:10.5923/j.materials.20160604.03

Use of Biopolymer Adsorbent in the Removal of Phenol from Aqueous Solution
 Abstract
 Reference
 Full-Text PDF
 Full-text HTML
Ahmed A. Moosa, Ali Mousa Ridha, Noor Ali Kadim
Department of Materials Engineering Technology, Engineering Technical College–Baghdad, Middle Technical, University, Baghdad, Iraq
Correspondence to: Noor Ali Kadim, Department of Materials Engineering Technology, Engineering Technical College–Baghdad, Middle Technical, University, Baghdad, Iraq.
| Email: |  |
Copyright © 2016 Scientific & Academic Publishing. All Rights Reserved.
This work is licensed under the Creative Commons Attribution International License (CC BY).
http://creativecommons.org/licenses/by/4.0/

In this work, chitosan was extracted from local shrimp shell waste as low cost raw materials by chemical methods. The chitosan was impregnated with granular activated carbon to be used as adsorbents for the removal of phenol from aqueous solution by adsorption technique. The adsorbents were characterized by (FTIR) and (BET). The optimum condition for batch adsorption of the phenol and the maximum adsorption efficiency were found to be 78.4% for Chitosan (CH), 90.49% for chitosan impregnated granular activated carbon with different amounts of chitosan (10 wt.%) CHGAC1, 94.47% for chitosan impregnated granular activated carbon with different amounts of chitosan (20 wt.%) CHGAC2 and 85.91% for Granular activated carbon (GAC) at 1.2 g, pH 7 and 6 hrs respectively. The equilibrium isotherm of (Chitosan CH, Chitosan impregnated granular activated carbon with different amounts of chitosan (10 wt.%) CHGAC1 and Chitosan impregnated granular activated carbon with different amounts of chitosan (20 wt.%) CHGAC2) for the phenol shows that the Langmuir isotherm fits the experimental data better than Freundlich and Temkin adsorption. The equilibrium isotherm of Granular Activated Carbon (GAC) for the phenol shows that the Freundlich isotherm fits the experimental data better than Langmuir and Temkin adsorption.
Keywords: Adsorption, Phenol Removal, Chitosan, Biocomposite Adsorbents, Granular Activated Carbon
Cite this paper: Ahmed A. Moosa, Ali Mousa Ridha, Noor Ali Kadim, Use of Biopolymer Adsorbent in the Removal of Phenol from Aqueous Solution, American Journal of Materials Science, Vol. 6 No. 4, 2016, pp. 95-104. doi: 10.5923/j.materials.20160604.03.
Article Outline
1. Introduction
- The presence of poly aromatic hydrocarbons, heavy metals and synthetic materials cause serious threat to human health, living resources, and ecological systems. For being non-biodegradable and tend to accumulate in living organisms. These pollutants accumulate in living organisms, which caused serious health problems such as cancer, brain damage [1].Phenol is one of the most abundant organic pollutants in industrial wastewater and is considered as one of the priority pollutants by US Environmental Protection Agency [2]. Phenol is introduced in wastewater by many industries such as petroleum refining, coal tar, pharmaceuticals, resin, plastic, yarn, petrochemical, coal, ceramic, glue, leather, and food processing [3]. Environmental Protection Agency, EPA has set a limit of 0.1mg/lit of phenol in wastewater [4].There are many methods for removal of the phenol from aqueous solution such as ion exchange, precipitation, coagulation, flocculation, chemical oxidation and adsorption [5-7]. Adsorption is considered as highly effective, inexpensive, easy to operate among the physic chemical treatment, and insensitivity to toxic pollutants [8].Chitosan is the most abundant biopolymer in nature after cellulose, which is produced by a deacetylation procedure from chitin and is extracted from the shells of shrimp, prawns, crabs, insects and other crustaceans. Chitosan is useful in a wide application in various industries such as food biotechnology, biomidicine, cosmetics and pharmaceuticals. In addition the chitosan used in environment and agriculture, such as water treatment, seed treatment and other applications. Chitosan has many characterization such as biocompatibility, biodegradability, non-toxicity and adsorption properties [9]. Chitosan derivative has gained wide attention as effective biosorbent due to low cost and high contents of amino and hydroxyl functional groups which show significant adsorption potential for the removal of various aquatic pollutants [10].The objective of this work is to extract chitosan from shrimp shells and impregnated it with granular activated carbon as biocomposite adsorbents for the removal of phenol from aqueous solution by adsorption. Using different adsorbents, the effects of adsorbent dosage, pH value and contact time on the adsorption process of the phenol for chitosan (CH), chitosan impregnated granular activated carbon with different amounts of chitosan (10 wt.% and 20 wt.%) (CHGAC) and granular activated carbon (GAC) were investigated. The equilibrium isotherms Langmuir, Freundlich and Temkin models were studied.
2. Material and Methods
2.1. Materials
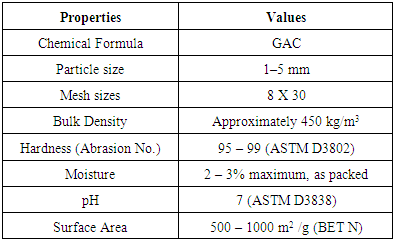
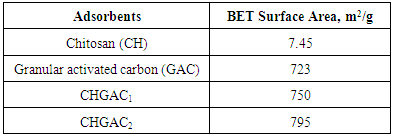
- Preparation of Stock Solution of PhenolPhenol was chosen as an adsorbate (MW=94.11g/mol). A stock solution of phenol was prepared by adding 1gm of phenol into 1L distilled water. The test solution of desired concentration was then prepared by diluting the stock solution. The equilibrium concentrations of phenol were measured using a UV spectrophotometer at a maximum wavelength of 263 nm. The pH of the solution was adjusted to the required value using 1 M HCl and 1 M NaOH solutions.Granular Activated Carbon GACGranular activated carbon (GAC) was utilized in this work as an adsorbent. High purity 99.9% GAC supplied by Panreac, Barcelona, Espana. The typical properties of GAC are shown in the Table 1.
|
2.2. Batch Adsorption Experiments
- Effect of Adsorbent DosageTo determine the optimum weight of (CH, CHGAC1, CHGAC2) and GAC as an adsorbent of phenol solution. Different dosage (0.2, 0.4, 0.6, 0.8, 1, 1.2, 1.4, and 1.6 g) mg of Chitosan (CH), Chitosan impregnated granular activated carbon with different amounts of chitosan (10 wt.%) (CHGAC1), Chitosan impregnated granular activated carbon with different amounts of chitosan (20 wt.%) (CHGAC2) and Granular activated carbon (GAC) were mixed with 50 mL of phenol solution. The solution was then shaken for about 5hrs in a water bath shaker at fixed speed 120 rpm and temperature of 25°C. After shaking the solutions were then separated by filtration using 0.45 μm filter paper. The remaining concentrations of phenol in the filtrate were measured by using the Ultraviolet–visible (UV-Vis) spectrophotometer. All experiments were performed at the pH 7 of the solution and 102.29 mg/L initial concentration of phenol solution. The desired pH was adjusted using 1 M HCl and 1 M NaOH.Effect of pH To obtain the optimum pH of the phenol solution adsorption onto Chitosan (CH), Chitosan impregnated granular activated carbon with different amounts of chitosan (10 wt.%) (CHGAC1), Chitosan impregnated granular activated carbon with different amounts of chitosan (20 wt.%) (CHGAC2) and Granular activated carbon (GAC), a different pH (2, 3, 5, 7 and 9) were used with 50 mL of the phenol solution with an initial concentration of 102.29 mg/L. The pH of each samples was adjusted by 1M of concentrated HCl acid and 1M NaOH by pH meter. The phenol solution of different pH was added to the bottles containing the optimum weight of onto Chitosan (CH), Chitosan impregnated granular activated carbon with different amounts of chitosan (10 wt.%) (CHGAC1), Chitosan impregnated granular activated carbon with different amounts of chitosan (20 wt.%) (CHGAC2) and Granular activated carbon (GAC). The bottles were then shaken in a water bath shaker for 5 hrs at 120 rpm and 25°C. The phenol solution was separated by filtration using 0.45 μm filter paper. The remaining concentration of phenol in the filtrate was measured by using the Ultraviolet–visible (UV-Vis) spectrophotometer. The best pH of each bioadsorbents Chitosan (CH), Chitosan impregnated granular activated carbon with different amounts of chitosan (10 wt.%) (CHGAC1), Chitosan impregnated granular activated carbon with different amounts of chitosan (20 wt.%) (CHGAC2) and Granular activated carbon (GAC) for phenol was obtained at maximum adsorption efficiency.Effect of Contact TimeIn order to obtain the best contact time for adsorption of phenol adsorption onto bioadsorbents Chitosan (CH), Chitosan impregnated granular activated carbon with amounts of chitosan (10 wt.%) (CHGAC1), Chitosan impregnated granular activated carbon with different amounts of chitosan (20 wt.%) (CHGAC2) and Granular activated carbon (GAC), a series of experiments were achieved at different contact time (2, 4, 6, 8 and 10 hrs) with best adsorbent dosages and the best pH of adsorbate solutions. The phenol solution was adjusted to the best of dosage and pH with the initial concentration 102.29 mg/L onto bioadsorbents Chitosan (CH), Chitosan impregnated granular activated carbon with different amounts of chitosan (10 wt.%) (CHGAC1), Chitosan impregnated granular activated carbon with different amounts of chitosan (20 wt.%) (CHGAC2) and Granular activated carbon (GAC) respectively. A volume 50 ml of the phenol solution was placed in the bottles. The solution in the bottles was agitated for different times in a shaker with water bath at agitation speed of 120 rpm and the temperature was maintained at 25°C and then filtered. The equilibrium concentrations of phenol were determined by the Ultraviolet–visible (UV-Vis) spectrophotometer. The best time for phenol was then obtained at maximum adsorption efficiency.
2.3. Characterization of Adsorbents and Adsorbate
- CH, CHGAC and GAC were characterized using the Fourier-Transformation Infrared Spectra (FT-IR) (Model IRTracer-100, Shimadzu Co., Japan). The specific surface area of Chitosan (CH), Chitosan impregnated granular activated carbon with different amounts of chitosan (10 wt.% and 20 wt.%) (CHGAC) and Granular activated carbon (GAC) were measured using the BET analyzers (Model 9600, USA). The Ultraviolet–visible (UV-Vis) spectrophotometer (Model UV - 160 A, Shimadzu Co, Japan) was used to measure the equilibrium concentrations of phenol.
2.4. Adsorption Isotherm
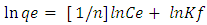
- Equilibrium isotherm experiments were carried out using the optimum condition of adsorbent dosage, pH and contact time for adsorption of phenol onto each of bioadsorbents Chitosan (CH), Chitosan impregnated granular activated carbon with different amounts of chitosan (10 wt.% and 20 wt.%) (CHGAC) and Granular activated carbon (GAC). The phenol solution with different initial concentration (20, 40, 60, 80, 100, 150 and 200 mg/L) were adjusted to the best pH of phenol solution. A 50 ml of the phenol solution was placed in the bottles. Best dosage of each bioadsorbent Chitosan impregnated granular activated carbon with different amounts of chitosan (10 wt.% and 20 wt.%) (CHGAC) and Granular activated carbon (GAC) were added to each bottle. The samples in bottles were agitated at a best adsorption period in a shaker with water bath at agitation speed 125 rpm and the temperature was maintained at 25°C. The samples were then filtered using 0.45 μm filter paper and the remaining concentration of phenol was measured by Ultraviolet–visible (UV-Vis) spectrophotometer.The amount of adsorption at equilibrium, qe(mg/g), is given by Equation 1 [15].
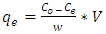 | (1) |
 | (2) |
 | (3) |
 | (4) |
 | (5) |
 | (6) |
 | (7) |
 | (8) |
 | (9) |
 | (10) |
3. Results and Discussion
3.1 Characterization of the Adsorbents
- FTIRThe spectra of extracting chitosan from the local shrimp were obtained using an FTIR spectrophotometer (IRTracer-100, Shimadzu Co. Japan). FTIR was carried out in the various ranges from 4000-400 cm-1 to study the conformation of the extracted Chitosan with standard chitosan. FTIR spectra of extracting chitosan and standard Chitosan are presented in Figure 1 (a) and (b) respectively. The peaks at 3425.58 cm-1 due to the presence of the (O-H), and (-NH2) groups of position of glucosamine, a major group present in chitosan. The vibrational band observed between 2924.09 -2885.51 cm-1 is due to the typical C-H stretch vibrations. These results are in agreement with the work of (Alhosseini S. et al, 2012) [20] and (Y. S. Puvvada et al, 2012) [21]. In the FTIR spectra, two characteristic bands for NH2COCH3 group were observed at 1654.92 and at 15558.48 cm-1. The peak at 1654.92 cm-1 is known as Amide I band which is attributed to the occurrence of (C=O) in the NH2COCH3 group (Amide I band). The peak at 1558.48 cm-1 due to the secondary amine groups (Amide II). This band can be detected within the 1570-1530 cm-1 interval, depending` on the degree of intermolecular association between C=O and N-H groups. These results are in agreement with the work of (D. Zvezdova 2010) [22]. The peak at 1153.43 cm-1 due to (NH) free amino groups. The peaks at 1083.99, 1072.42, and 1033.85 cm-1 due to the presence of three distinct vibrational modes of C–C, C-O-C, and -CO is stretching vibrations. The peak at 894.97 cm-1 due to ring stretching. These results are in agreement with the work of (Y. S. Puvvada et al, 2012) [21], where the prepared Chitosan by processing shrimp waste (shell) and involved partial deacetylation of chitin.
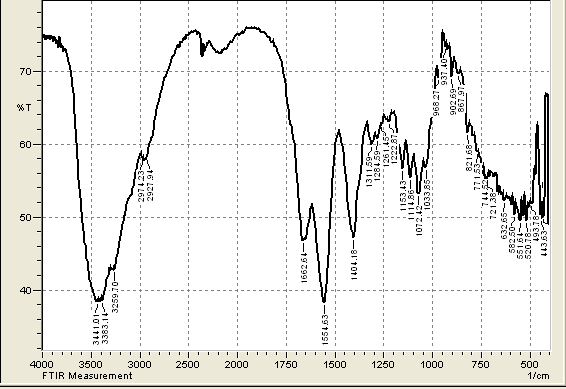 | Figure 1(a). FTIR of chitosan extracted from shrimp shell |
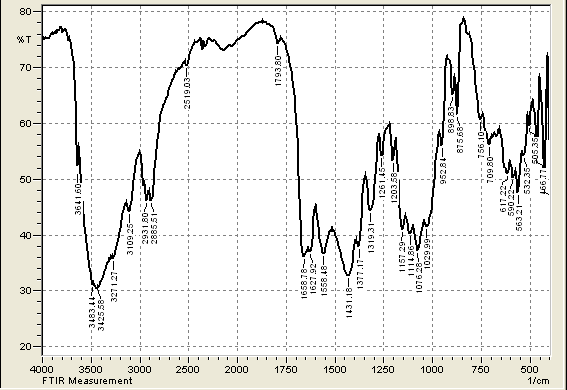 | Figure 1(b). FTIR of standard chitosan |
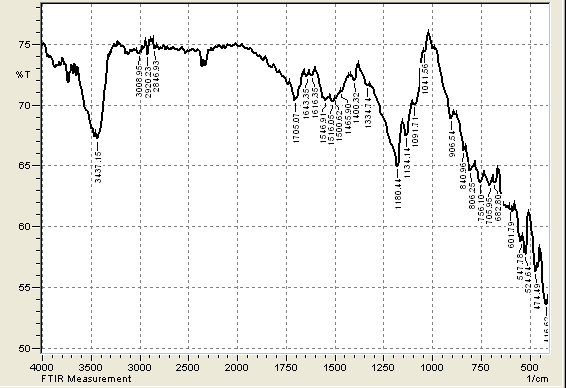 | Figure 2. FTIR of Granular Activated Carbon |
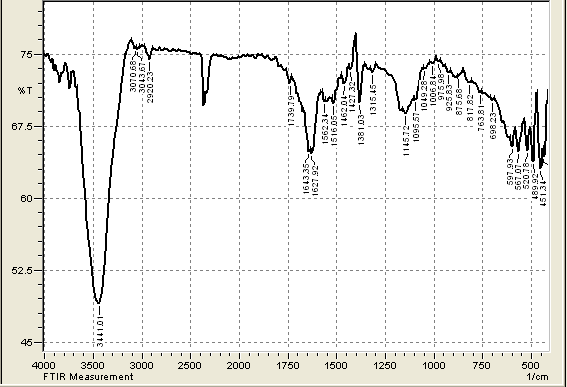 | Figure 3. FTIR of CHGAC Composites |
|
3.2. Batch Adsorption Studies
- Effect of Adsorbents DosageThe effect of adsorbent dosage on the adsorption efficiency for phenol removal was performed at different dosages (0.2, 0.4, 0.6, 0.8, 1, 1.2, 1.4 and 1.6 gm), 25°C and 102.29 mg.L-1 initial concentration as shown in Figure 4. It can be seen that the adsorption efficiency increased with increased of adsorbent dosage. Then the adsorption efficiency remained constant and increased slowly with increased in adsorbent dosage and reached to the equilibrium nearly at 1.2 g for each adsorbent Chitosan (CH), Chitosan impregnated granular activated carbon with different amounts of chitosan (10 wt.% and 20 wt.%) (CHGAC) and Granular activated carbon (GAC). This may be due to greater availability of the surface area of higher concentration of the adsorbent and the complete utilization for all active sites in the adsorbent dosage by phenol ions. These results are in agreement with the work of (P. Hariani et al, 2015) [27] and (S. Sugashini, K. Begum 2013) [28].
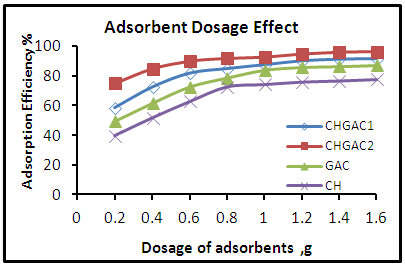 | Figure 4. Effect of adsorbents dosage on the adsorption efficiency of phenol onto (CH, CHGAC1, CHGAC2 and GAC) adsorbents |
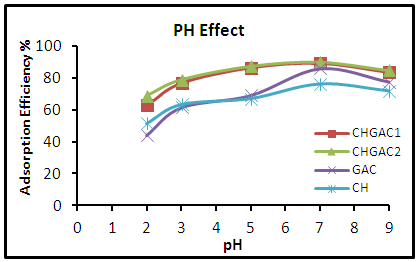 | Figure 5. Effect of pH of adsorption of the phenol solution onto (CH, CHGAC1, CHGAC2 and GAC) adsorbents |
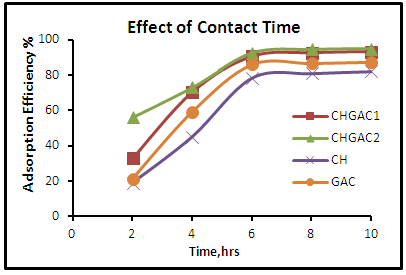 | Figure 6. Effect of contact time for adsorption of phenol onto (CH, CHGAC1, CHGAC2 & GAC) adsorbents |
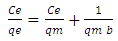
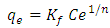
3.3. Adsorption Isotherms
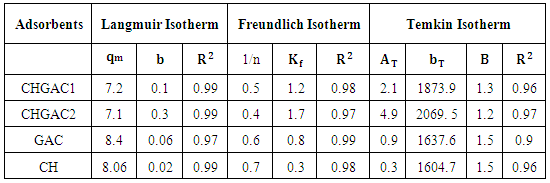
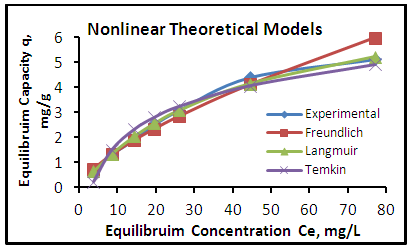
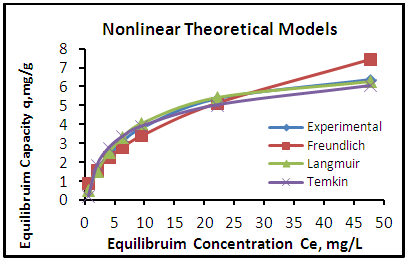
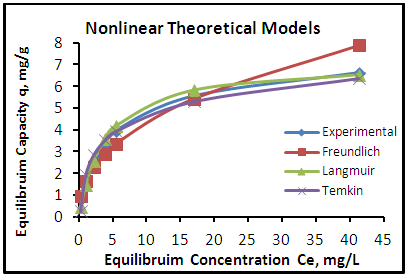
- The adsorption isotherm curves of phenol onto each of CH, CHGAC1, CHGAC2 and GAC are shown in Figures 7, 8, 9 and 10 respectively. These Figures describe the experimental data and the theoretical data obtained from Langmiur, Freundlich and Temkin isotherm. All constants and correlation coefficients for Langmiur, Freundlich and Temkin isotherm theoretical model are listed in Table 3.
|
 | Figure 7. Adsorption isotherms of experimental and theoretical models of the phenol onto CH at (25°C, 1.2 gm, pH 7.0 & time 6 hours) |
 | Figure 8. Adsorption isotherms of experimental and theoretical models of the phenol onto CHGAC1 at (25°C, 1.2 gm, pH 7.0 & time 6 hours) |
 | Figure 9. Adsorption isotherms of experimental and theoretical models of the phenol onto CHGAC2 at (25°C, 1.2 gm, pH 7.0 & time 6 hours) |
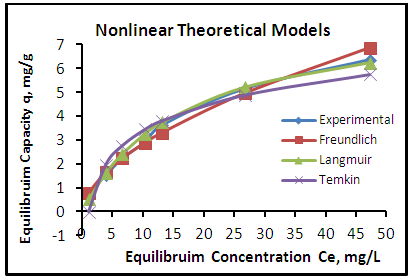 | Figure 10. Adsorption isotherms of experimental and theoretical models of the phenol onto GAC at (25°C, 1.2 gm, pH 7.0 & time 6 hours) |
4. Conclusions
- In the present work, the bioadsorption of phenol from aqueous solution onto each of Chitosan (CH), Chitosan impregnated granular activated carbon with different amounts of chitosan (10 wt.% and 20 wt.%) (CHGAC) and Granular activated carbon (GAC) lead to the following conclusions:1. Natural biopolymer “Chitosan” was synthesized using local low cost shrimp shells as raw materials by chemical methods involving deproteinization, demineralization, and deacetylation. Then Chitosan (CH) will be treated with Granular activated carbon GAC by impregnation to be used as adsorbents for the removal of phenol from aqueous solution. 2. For batch adsorption, the maximum adsorption efficiency of phenol onto each of Chitosan (CH), Chitosan impregnated granular activated carbon with different amounts of chitosan (10 wt.% and 20 wt.%) (CHGAC) and Granular activated carbon (GAC), were found to be 78.4% for Chitosan (CH), 90.49% for chitosan impregnated granular activated carbon with different amounts of chitosan (10 wt.%) CHGAC1, 94.47% for chitosan impregnated granular activated carbon with different amounts of chitosan (20 wt.%) CHGAC2 and 85.91% for Granular activated carbon (GAC) at 3. The equilibrium isotherm of phenol adsorption onto each of (Chitosan CH, Chitosan impregnated granular activated carbon with different amounts 1.2 g, pH 7 and 6 hrs, respectively and 25°C. of chitosan (10 wt.%) CHGAC1 and Chitosan impregnated granular activated carbon with different amounts of chitosan (20 wt.%) CHGAC2) shows that the Langmuir isotherm fits the experimental data better than Freundlich and Temkin adsorption isotherm. The equilibrium isotherm of phenol adsorption onto Granular activated carbon GAC shows that the Freundlich isotherm fits the experimental data better than Langmuir and Temkin adsorption isotherm.
ACKNOWLEDGEMENTS
- Authors wish to acknowledge the, chemistry lab/ University of Technology/Baghdad, and iraq Institute of Science Education and Research, analytical facilities for characterization of the pre-pared materials.