-
Paper Information
- Paper Submission
-
Journal Information
- About This Journal
- Editorial Board
- Current Issue
- Archive
- Author Guidelines
- Contact Us
American Journal of Materials Science
p-ISSN: 2162-9382 e-ISSN: 2162-8424
2015; 5(5): 97-105
doi:10.5923/j.materials.20150505.01

Study the Precipitation of Sb in Pb Based Alloys Using Stress-Strain Characteristics and Positron Annihilation Technique
 Abstract
 Reference
 Full-Text PDF
 Full-text HTML
S. El-Gamal 1, Gh. Mohammed 1, E. E. Abdel-Hady 2
1Physics Department, Faculty of Education, Ain Shams University, Roxy, Cairo, Egypt, Current addresses: Physics Department, Faculty of Science, Northern Border University, Arar, KSA
2Physics Department, Faculty of Science, Minia University, Minia, Egypt
Correspondence to: S. El-Gamal , Physics Department, Faculty of Education, Ain Shams University, Roxy, Cairo, Egypt, Current addresses: Physics Department, Faculty of Science, Northern Border University, Arar, KSA.
| Email: |  |
Copyright © 2015 Scientific & Academic Publishing. All Rights Reserved.
This work is licensed under the Creative Commons Attribution International License (CC BY).
http://creativecommons.org/licenses/by/4.0/

The effect of Sb-content and strain rate (ε•) on the work hardening characteristics of Pb-1-5wt% Sb alloys were studied by stress-strain measurements and positron annihilation lifetime spectroscopy (PALS). Annealing of the samples was made in the air for 2 hours at 423 ±2 K and then they were quenched in water at room temperature (RT). The samples were stretched at ε• of 5.4x10⁻⁵, 6.7x10⁻⁴ and 1.2x10⁻³ s-1 at RT up to fracture. It was found that, (i) at constant ε• increasing Sb-content, increases σF and work hardening coefficient  while εf decreases (ii) for each alloy, σF and
  decreases with increasing ε• while εf increases (iii) with increasing Sb-content, the lifetime component τ1 is nearly constant and its value is about 0.195 ns, which agrees with the positron lifetime in bulk Pb (0.198 ns). Also, τ2 is invariable with a value about 0.288 ns (iv) the intensity I1 decreases with increasing Sb-content while I2 and the mean lifetime (τm) increase. The microstructure of Pb-Sb alloys were investigated using scanning electron microscope (SEM) and energy dispersive X-ray spectroscopy (EDS).
Keywords: Positron annihilation, Pb-Sb alloy, Fracture stress, Strain rate
Cite this paper: S. El-Gamal , Gh. Mohammed , E. E. Abdel-Hady , Study the Precipitation of Sb in Pb Based Alloys Using Stress-Strain Characteristics and Positron Annihilation Technique, American Journal of Materials Science, Vol. 5 No. 5, 2015, pp. 97-105. doi: 10.5923/j.materials.20150505.01.
Article Outline
1. Introduction
- Pb alloys have many applications in industry. They are the best stable materials for the production of battery grids in Pb-acid electric accumulators. The main alloying system used in these grids was Pb-Sb alloy. The addition of Sb strengthens and hardens the Pb grids for improved handling and casting, also it enhances the conductive properties [1-3]. Such enhancement in the mechanical properties is due to some significant segregation of Sb at grain boundaries and also to the increase in the concentration of the alloying vacancies which could modify the viscous flow processes along the grain boundaries [4].Positron annihilation spectroscopy (PAS) can provide important information about the concentration, configuration and internal structure of the lattice defects in solids [5-8]. It has particular advantages compared to other traditional tools in resolving small vacancy clusters, voids, dislocation lines or loops, and jogs. Also, PAS was used deeply to study the precipitation kinetics in different alloys [9, 10] and to investigate the recovery stages and recrystallization processes [11, 12].The thorough surveying of the literature has revealed that there are only three papers handled the topic of positron annihilation study in Pb based alloys. Menai et al. [13] studied positron annihilation in quenched and irradiated pure Pb and in quenched Pb (Ag) alloys. They found that, the precipitation of Ag atoms in dilute alloys should be understood in terms of Ag-Pb interstitially migrating pairs. The presence of di-interstitial (Ag-Ag) or complexes (Ag(s)-Vacancies) as mobile defects responsible for the Ag transport process in concentrated alloys. Belaidi et al. [14] investigated the defects and their diffusion, which induce grain boundary migration in a Pb-Sn system. Dorikens-Vanpraet et al. [15] determined the activation energy for the recovery of the dislocations in deformed Pb at liquid nitrogen temperature by PAS. Its value was found to be equal 0.43 ± 0.03 eV. As was noticed, little attention has been given to the topic of studying the effect of Sb-content on the work-hardening characteristics in Pb based alloy by PAS which represents a gap that has to be filled.
2. Experimental Procedures
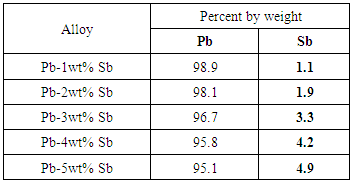
- Pb-1-5wt%Sb alloys were prepared from high purity Pb (99.99%) and Sb (99.99%) by melting a mixture of the appropriate weights under vacuum in a high purity graphite crucible, in a high frequency induction furnace. The obtained ingot was homogenized at 553 K for 4 hours, and then cold drawn into two forms, wires of diameter 0.6 mm and sheets of thickness 1 mm. Chemical analysis was made for the different samples as presented in Table (1). It is obvious that the alloy composition is very close to the required one. Annealing of the samples was made in the air for two hours at 423±2 K then quenched in water at RT.The tensile test was performed using a computerized locally made tensile testing machine. More details about this machine were already mentioned before [16]. The samples were stretched at different strain rates (ε•) of 5.4x10⁻⁵, 6.7x10⁻⁴ and 1.2x10⁻³ s-1 at RT up to fracture. The microstructure of Pb-Sb alloys was investigated using scanning electron microscope (SEM) (JEOL, JSM-5400). Prior to microscopic investigations, the samples were carefully cleaned, mechanically polished then electrochemically polished.
|
 and
and  with relative intensities I1 and I2 taking into consideration the source corrections which gives single lifetime component (0.368 ns) with intensity 16%. The variation in lifetime values is relevant to defect type, while changes in the intensities reflect the defect concentration. Positron mean lifetime,
  can be calculated using the formula
  | (1) |
3. Experimental Results and Observations
- Typical engineering stress-strain curves of Pb-1-5wt % Sb alloys at different strain rates (5.4x10⁻⁵, 6.7x10⁻⁴ and 1.2x10⁻³ s-1) are shown in Fig.(1). The levels of the stress–strain curves were found to be sensitive to the values of ε• and Sb-content. The maximum stress applied to the sample at the fracture point was taken as the fracture stress (σF) and the corresponding strain is the fracture strain (ɛF). The dependence of σF and ɛF on the Sb-content at different ε• is shown in Figs. (2) and (3), respectively. From these figures, it is clear that, (i) at constant ε•, with increasing Sb-content, σF increases while ɛF decreases (ii) for each alloy, σF decreases with increasing ε• while ɛF increases. The work-hardening coefficient, predicted by the Mott's model [18], is given by;
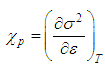 | (2) |
 was found from the parabolic part of the stress-strain curve, after the elastic part, by drawing the squared-value of stress
  with strain
  then calculating the slope of these straight lines.
  is related to the shear modulus, grain size and fatigue [19]. Figure (4) shows the dependence of
  on the Sb-content at different ε•. It is obvious that
  increases as Sb-content increases while it decreases with increasing ε•. Figure (5) shows the micrographs of two samples, Pb-1wt% Sb and Pb-5wt% Sb alloys, obtained by SEM. The pictures reveal the effect of Sb content on the microstructure of the samples. Such micrographs revealed two phases, one of them is dark while the other is white. The white phase was detected to be Sb-phase embedded in dark phase (Pb) and this was confirmed by EDS investigation. The variations of the lifetime components
  and their intensities (I1 and I2) with increasing Sb-content for Pb-1-5wt% Sb alloys are shown in Figs. (6 & 7). It is clear that, (i) the lifetime component τ1 is nearly constant and its value is about 0.195 ns. Also, τ2 is invariable with a value about 0.288 ns (ii) the intensity I1 decreases with increasing Sb-content while I2 increases. The mean lifetime τm as a function of Sb-content is shown in Fig. 8. It is clear that τm increases as Sb-content increases.
4. Discussions
- It should be mentioned that, the engineering stress-strain curves were considered as raw experimental data in the present work. So, it is more appropriate to discuss the parameters extracted from these curves (σF, ɛF and
 ) as shown in Figs (2-4). According to the phase diagram [20] of Pb-Sb system, Pb-1-5wt% Sb consists of two phases, namely α-solid solution (Pb-rich phase) and considerable amounts of β-phase (Sb-rich phase) formed at the boundaries of α-phase [3, 21]. Increasing the content of Sb in Pb based alloys leads to an increase in the hardness of the alloy. This is because Sb segregates at grain boundaries of Pb phase forming Sb-rich phase also there will be more interfaces between α and β phases which hinder the dislocation motion [4]. The SEM micrographs (Figure 5) indicate that there are more interfaces as Sb increases. These interfaces could modify the viscous flow processes along the grain boundaries which causes an increase in the alloy hardness, i.e, σF and
  increases, but ɛF decreases [22].
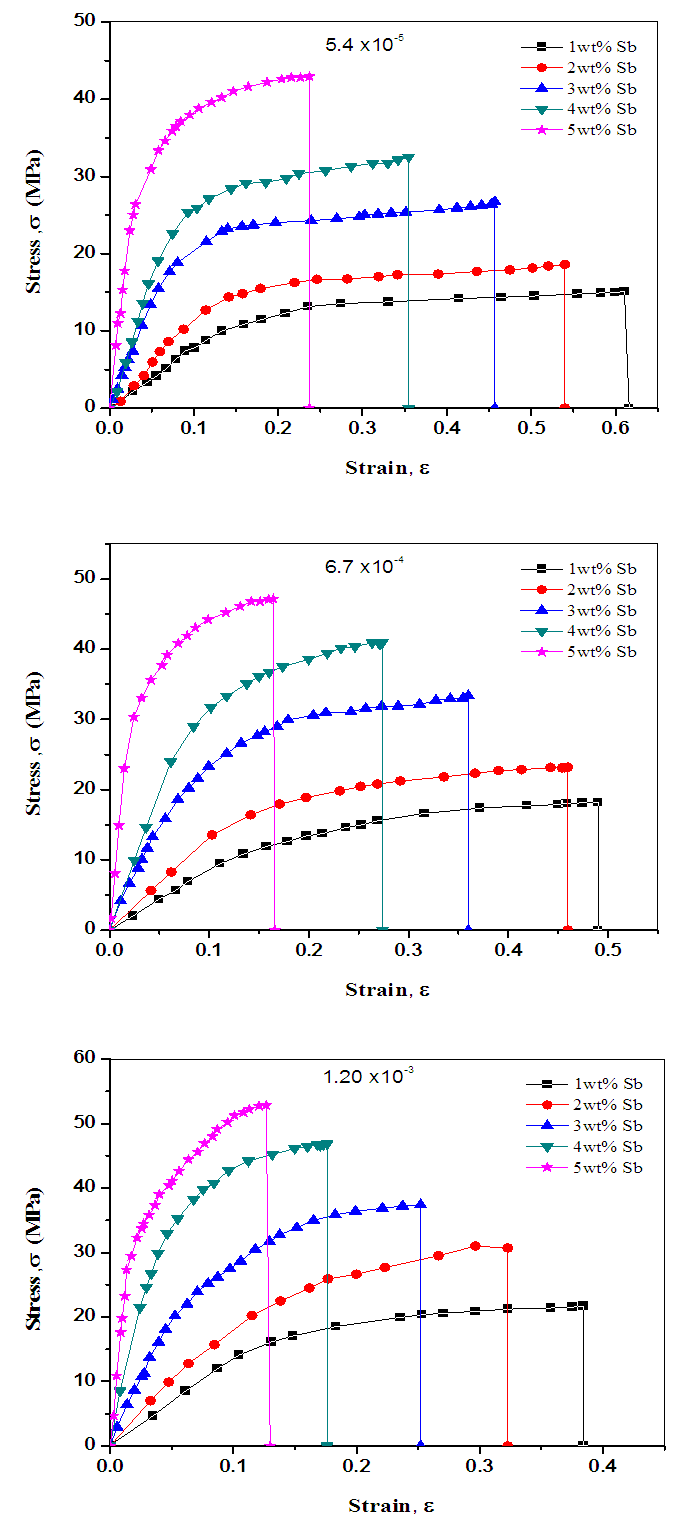 | Figure 1. Stress-strain curves of Pb-1-5wt% Sb alloy at different strain rates (5.4x10⁻⁵, 6.7x10⁻⁴ and 1.2x10⁻³ s-1) |
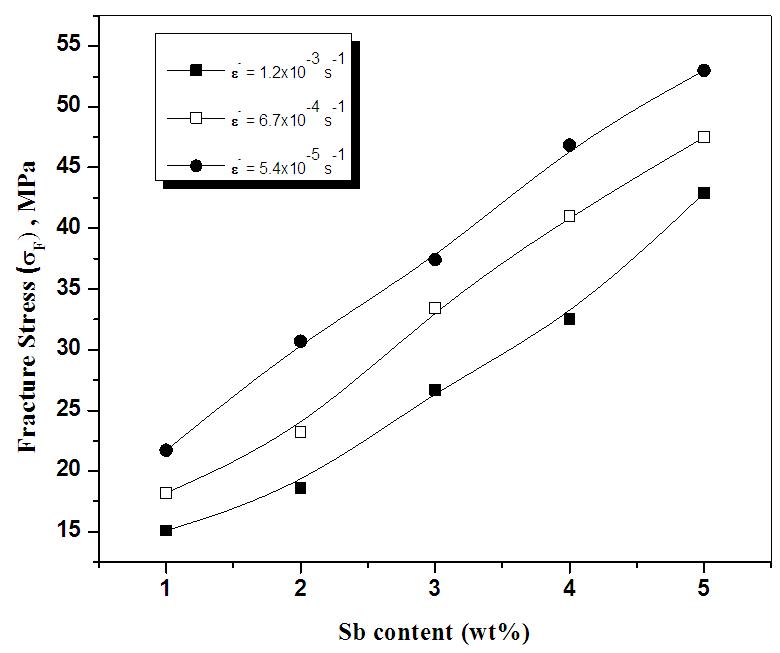 | Figure 2. The dependence of fracture stress (σF) on the Sb-content at different strain rates (5.4x10⁻⁵, 6.7x10⁻⁴ and 1.2x10⁻³ s-1) |
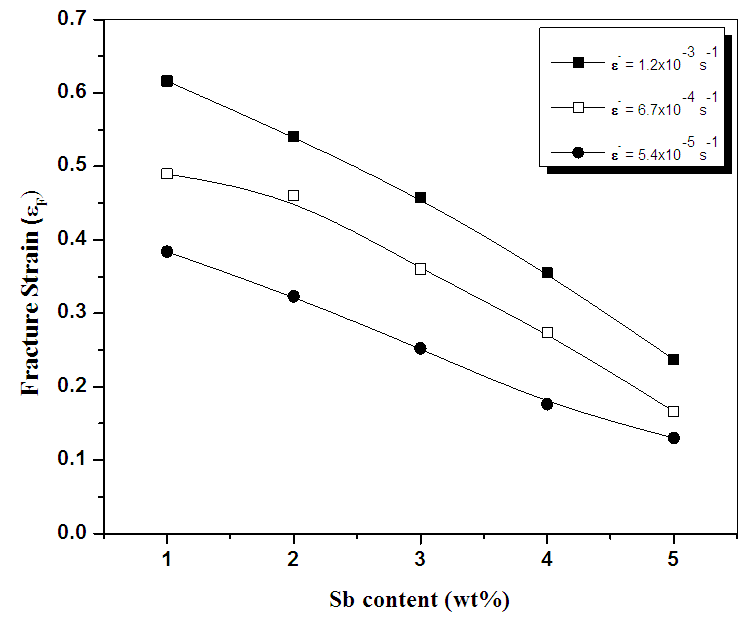 | Figure 3. The dependence of fracture strain ( ɛF ) on the Sb-content at different strain rates (5.4x10⁻⁵, 6.7x10⁻⁴ and 1.2x10⁻³ s-1) |
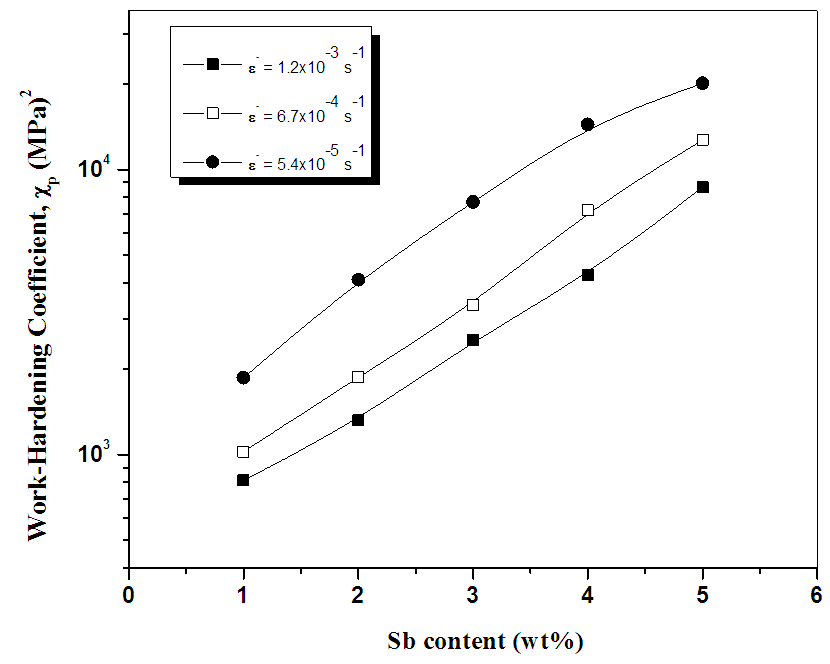 | Figure 4. The dependence of work hardening coefficient  on the Sb-content at different strain rates (5.4x10⁻⁵, 6.7x10⁻⁴ and 1.2x10⁻³ s-1) on the Sb-content at different strain rates (5.4x10⁻⁵, 6.7x10⁻⁴ and 1.2x10⁻³ s-1) |
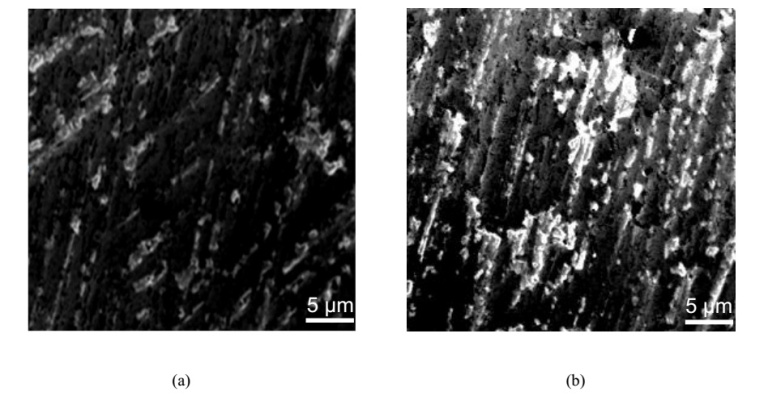 | Figure 5. SEM micrographs at room temperature for: (a) un-strained Pb-1wt% Sb and (b) un-strained Pb-5wt% Sb alloy |
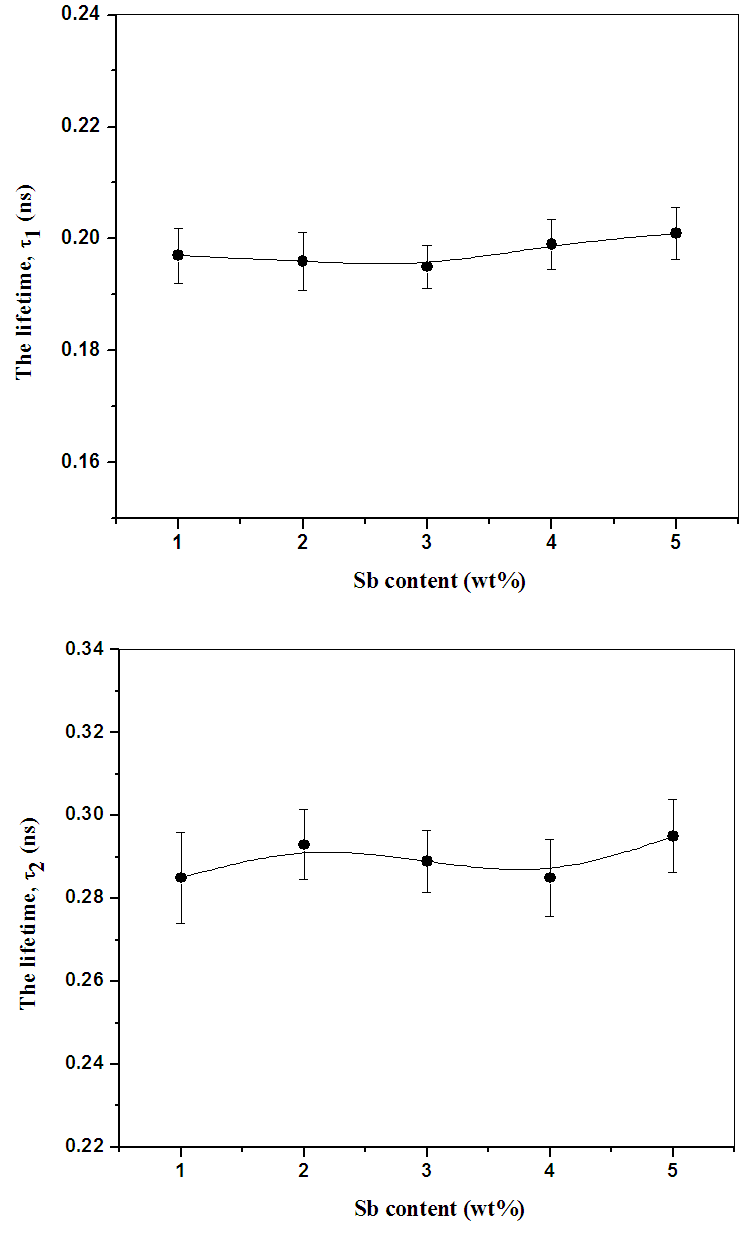 | Figure 6. The change in the lifetime components τ1 and τ2 with increasing Sb-content |
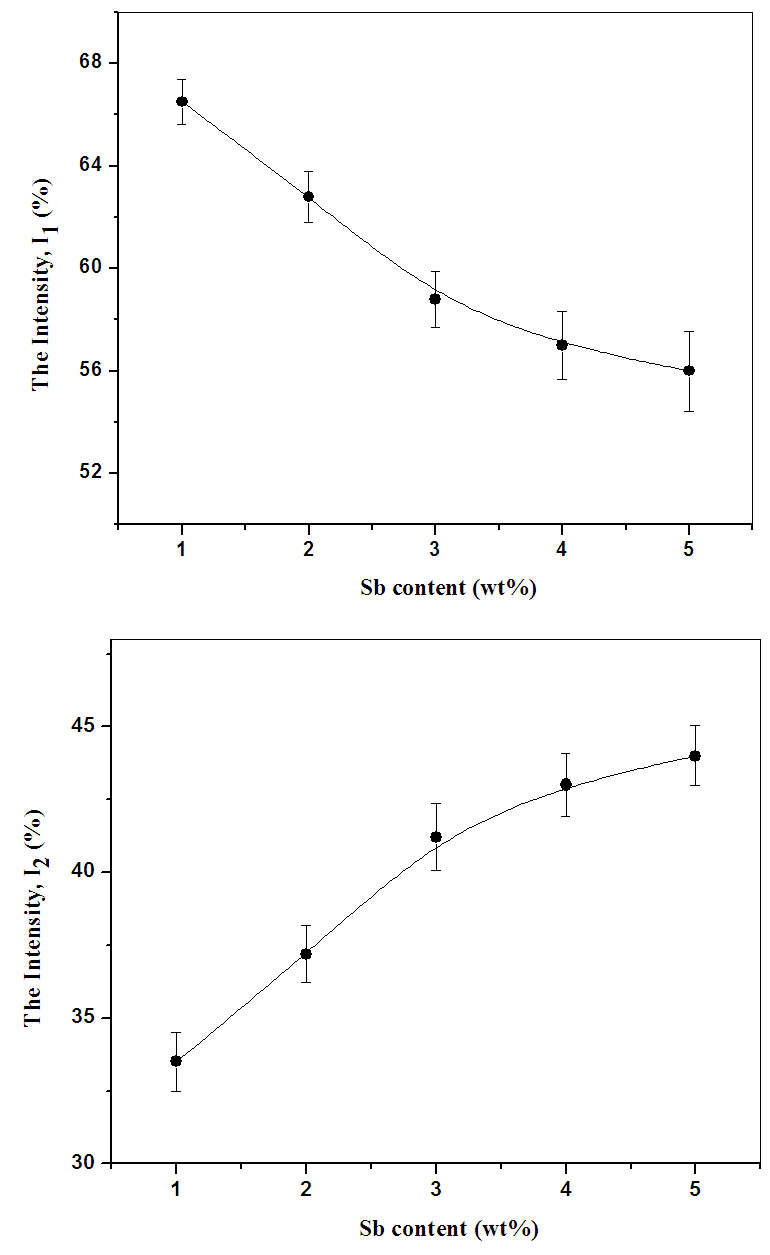 | Figure 7. The change in the intensities I1 and I2 with increasing Sb-content |
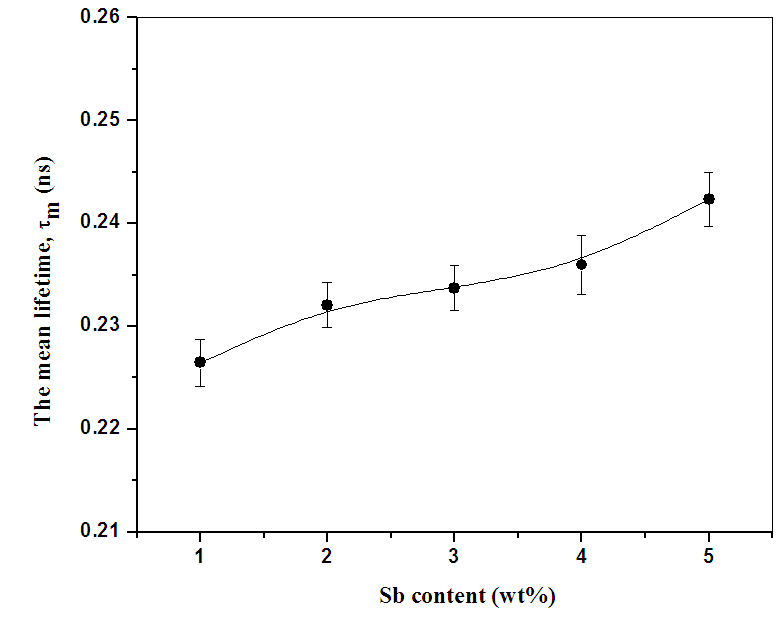 | Figure 8. The dependence of mean lifetime (τm) on the Sb-content |
- To investigate the effect of ε• on σF and ɛF , there is a popular relation that correlates between σF and ε• which is Norton’s power law;
 | (3) |
 and ɛF will be more evident. The aforementioned arguments could help in accounting for the data presented in Figs. (2-4). The analysis of positron annihilation lifetime data by LT 9.0 gives two lifetime components
  and two corresponding intensities (I1 and I2), see Figs (6, 7).
  is the shorter lifetime, its value is 0.195 ns, and it’s independent of Sb content. This value agrees with the positron lifetime in bulk Pb (0.198 ns) [13]. The positron annihilation in bulk Pb represents the main probability because of the high concentration of Pb in the present alloys (see Table (1)) this explains the higher values of I1 (56-67%). The second lifetime component
  is the long lifetime, its value is about 0.288 ns, it is much higher than the positron lifetime in bulk Pb. It was suggested that τ2 represents positron annihilation at the interfaces between Pb-rich phase and Sb-rich phase, see figure 5. It should be mentioned that, there is no chance to compare our findings in this part with those of others for the reason mentioned in the introduction. Also, some investigators [24, 25] studied this phenomena, but in other solids. With increasing Sb-content, the intensity (I1) decreases because the probability of positron annihilation (or the fraction of positrons annihilated) in the bulk Pb decreases and consequently such probability at the interfaces increases (I2 increases). The increase in the mean lifetime τm as Sb-content increases (see figure 8) may be due to the higher probability of positron annihilation at the interfaces between Pb-rich phase and Sb-rich phase.
5. Conclusions
- The effect of Sb-content and strain rate on the work hardening characteristics in Pb-1-5wt% Sb alloys were studied by stress-strain measurements and positron annihilation lifetime spectroscopy. It was found that, (i) increasing Sb-content at constant ε•, increases the fracture stress σF and work hardening coefficient
 while the fracture strain ɛF decreases (ii) for each alloy, with increasing ε•, σF and
  decreases while ɛF increases (iii) with increasing Sb-content, the lifetime component
  is nearly constant and its value is 0.195 ns. Also
  is invariable with value about 0.288 ns which may represent positron annihilation at the interfaces between Pb-rich phase and Sb-rich phase (iv) the intensity I1 decreases with increasing Sb-content while I2 and the mean lifetime
  increase.