-
Paper Information
- Next Paper
- Paper Submission
-
Journal Information
- About This Journal
- Editorial Board
- Current Issue
- Archive
- Author Guidelines
- Contact Us
American Journal of Materials Science
p-ISSN: 2162-9382 e-ISSN: 2162-8424
2015; 5(4): 84-89
doi:10.5923/j.materials.20150504.02
Mechanical Behaviour of Copper and Aluminium Particles Reinforced Epoxy Resin Composites
V. K. Srivastava, Ansul Verma
Department of Mechanical Engineering, Indian Institute of Technology (BHU), Varanasi, India
Correspondence to: V. K. Srivastava, Department of Mechanical Engineering, Indian Institute of Technology (BHU), Varanasi, India.
| Email: |  |
Copyright © 2015 Scientific & Academic Publishing. All Rights Reserved.
In this study, copper and aluminium particles reinforced epoxy resin was fabricated to investigate the effect of particles on the mechanical properties of epoxy resin (PL-411). Copper (Cu) and aluminium (Al) particles were added in the epoxy resin as filler with the variation of weight percentage (1%, 5%, 8% and 10%). The tensile strength, compressive strength, vicker’s hardness, friction coefficient and wear properties were evaluated and compared. The fracture behavior was investigated under scanning electron microscope. Experimental data from tensile tests were compared with Bigg’s equations. The results indicate that the tensile strength and wear loss gradually reduced with the increase of filler content. The hardness, compressive strength and coefficient of friction increased with an increase of weight percentage of Cu and Al fillers content.
Keywords: Aluminium, Copper: Epoxy resin, Tensile strength, Compressive strength, Vicker’s hardness, Coefficient of friction, Scanning electron microscopy
Cite this paper: V. K. Srivastava, Ansul Verma, Mechanical Behaviour of Copper and Aluminium Particles Reinforced Epoxy Resin Composites, American Journal of Materials Science, Vol. 5 No. 4, 2015, pp. 84-89. doi: 10.5923/j.materials.20150504.02.
Article Outline
1. Introduction
- Epoxy resin is established well as a thermosetting polymer matrix for advanced composites, displaying a series of interesting characteristics, which can be identified within boundaries. Due to their high-adhesion, low-weight, and good chemical resistance, epoxy-based composite materials are being increasingly used as structural components in various industries. It is well known that the mechanical properties of cured epoxy resins depend on their structure, the curing time and temperature [1]. The low cost particles are added into polymer matrix because of economic and improvements in molding characteristics. It is not clear fracture behaviour depends on only material properties or volume fraction of the filler, which includes shape, size, orientation and interface between filler and the matrix [2]. Polymer matrix composites (PMC) can exhibit unique properties with the combination of particles such as thermal conductivities, dielectric constants and ductility, scratch resistant and modulus, toughness and wear properties, impact performance, and compressive strength. Such polymers have also found their practical importance in several novel applications [3]. Epoxy (thermoset) is a widely used polymer in numerous applications. However its behavior is brittle when compared to metals and possess low thermal conductivity and limited mechanical properties. Reinforcement of fillers with lower aspect ratio can improve some of its mechanical properties [4]. Hussian et al [5] reported that ceramic fillers as reinforcement in epoxy composites results in improved physical, rheological and thermal properties. Youngs modulus and flexural modulus can also be improved. Goyanes et al [6] reported that for aluminium-epoxy composites, density increases with increasing filler content which also follows the rule of mixture. A correlation between the Youngs modulus and its density for filled epoxy composites was also justified by Tilbrook et al [7]. The matrix volume is at an optimum value for a given system, which acts as individual pockets or segments to support a tensile or compressive load.For a glass bead filled polypropylene system as suggested by Ramsteiner and Theysohn [8] that at higher temperature (about 70ºC) the tensile strength is independent of filler concentration, i.e. the model is valid at lower temperature where the matrix is brittle and the beads are not stress bearing. But however corresponding to a tough matrix state, some stress can be transferred from the matrix into the beads.The simple model proposed by Bigg [9], the tensile strength of particulate filled composites can be described as
 | (1) |
 | (2) |
 | (3) |
 | (4) |
 | (5) |
 | (6) |
 | (7) |
2. Experimentation
- Aluminium (Al) and copper (Cu) powder were selected as the metal fillers. Aluminium powder was obtained from CDH Laboratories New Delhi and Copper powder was obtained from Otto Kemi, Mumbai. Particle size for both the powders was 80µm.Epoxy resin contains a three membered oxide ring called as epoxide group. Resin PL-411 and hardener PH-861 were used as a matrix material.Metal powders were added into the epoxy resin with the variation of weight percentages, ranging from 1%, 5%, 8%, and 10%. The mixture was stirred for almost 10 minutes to ensure proper mixing. Hardener was then added to the resin in the ratio of 1:10 by weight and again mixed thoroughly till the mixture started to cure. The mixture was then poured into different molds to prepare the desired samples. For tensile test, dog-bone shaped samples based on the ASTM standard D-638 and for compression test brazalian (circular) disk samples were prepared as per ASTM standard D-3967. The hardness and wear tests specimen were prepared from the cured samples. Tensile and compressive tests were preformed on the Instron universal testing machine. The extension rate was set at 2mm per min to determine the tensile strength and compressive strength. Hardness test (LV-700AT) was carried out to determine the Vickers hardness. Wear and coefficient of friction was measured from reciprocation sliding wear and friction monitor instrument (TE-200ST). Reciprocating wear test was performed against mild steel ball having a diameter 10mm with receiprocating frequency 3.3Hz. The total stroke length was set at 3mm for all tests and was conducted for 10 min at a normal load 50N. The variation in coefficient of friction and temperature were obtained from the machine itself and the wear loss was measured with the help of electronic digital balance.
3. Results and Discussion
3.1. Tensile Strength
- To measure the influence of fillers on the tensile strength of epoxy resin matrix, the samples with specific size of composite were prepared according to the requirements of tensile test. The results of tensile test are shown in Fig. 1. It can be found that the tensile strength decreases with increasing weight percentage of Cu and Al fillers. It is also noted that tensile strength is independent on the filler concentration. Fig.1 shows that the tensile strength decreases continuously with increase in the weight percentage of the fillers. Al with a weight percentage of 1% experienced maximum tensile strength of all and then decreased thereafter. For 10% of Cu and Al, the maximum tensile strength was less than that of pure epoxy (85 MPa). The experimental values of tensile strength of Cu and Al particles filled epoxy resin were compared with the Bigg model (equation-1) with due consideration of poor (f=1.21) and high (f=1.1) interface bond adhesion. The results are presented in Figs. 2 and 3, this indicates the 10 to 20% differences in model and experimental values.
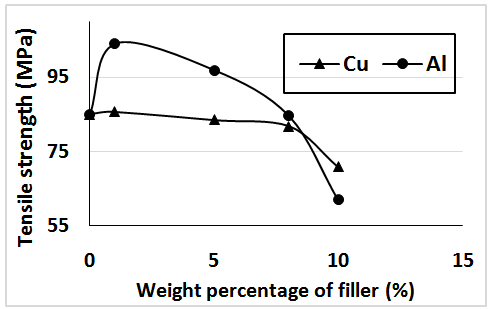 | Figure 1. Variation of tensile strength with weight percentage of filler of Cu/epoxy resin and Al/epoxy resin composites |
 | Figure 2. Tensile strength versus weight percentage of Al/epoxy resin composite |
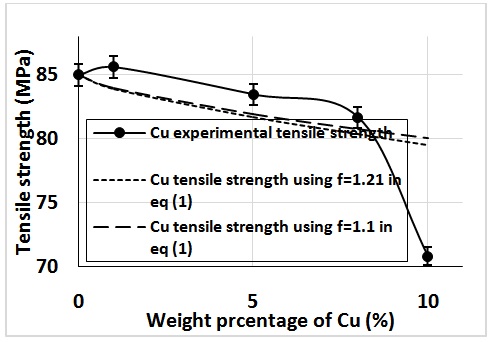 | Figure 3. Tensile strength versus weight percentage of Cu/epoxy resin composite |
3.2. Compressive Strength
- Fig. 4 shows the variation of compressive strength as a function of filler weight percentage. It can be noticed that the trend observed for compressive strength was quite different from those observed for tensile strength (Fig. 1). Epoxy matrix being brittle in nature has good compressive properties. In the case of Cu, it could be assumed that the brittleness was retained by the matrix when weight percentage was 1%. Initial compressive strength was thus high for Cu particles with 1% by weight. But it decreased when the weight percentage was increased to 5%. The ductility of Cu particles caused the overall compressive strength to decrease. Because of the agglomeration of copper particles, matrix again gained its brittleness with increasing weight percentage of Cu to 10%. For Al particles, the initial compressive strength was low but increased with increase in its weight percentage because of the agglomeration of Al particles in the matrix.
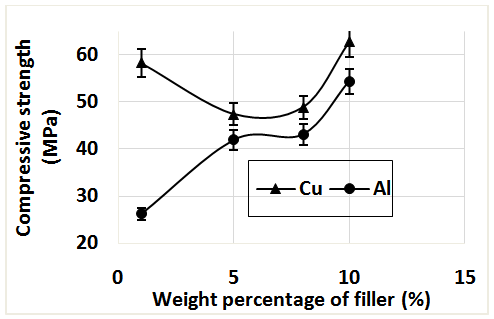 | Figure 4. Compressive strength versus weight percentage of filler in epoxy resin composite |
3.3. Vicker’s Hardness
- Fig.5 shows that the vicker’s hardness increased with the increase of Cu filler in epoxy resin upto 8% by weight but after that it decreased. In the case of Al filled epoxy resin, hardness decreased with addition of weight percentage of filler upto 5%. Then, hardness gradually increased with increase of filler. Lam et al [13] in their investigation found a similar trend in the hardness values in which the hardness increases up to certain filler content.
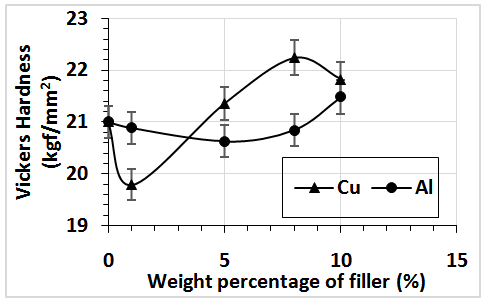 | Figure 5. Vicker’s hardness versus weight percentage of filler in epoxy resin composite |
3.4. Friction and Wear
- Fig. 6 shows how the wear loss varies when the weight percentage of the fillers was increased. When the reciprocating ball moved over the sample surface, it removed a part of it. But because of the different concentration of fillers in the samples, there was a variation in the removal of material due to wear [14]. As evident from results that increasing weight percentage of filler beyond 5% increased the wear loss. Copper filled polymer matrix composites initially showed a lower wear loss at lower weight percentages, but with an increasing weight percentage up to 10%, showed more wear loss than that of aluminium filled polymer matrix composite. However, aluminum content of 8% by weight showed maximum wear loss. But overall both the metallic fillers showed much less wear loss as compared to neat epoxy.
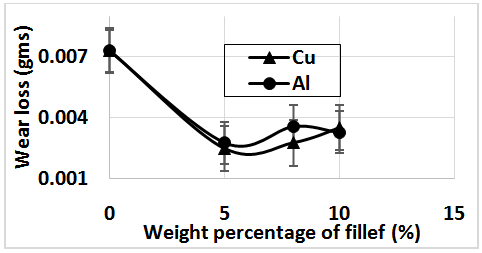 | Figure 6. Wear loss versus weight percentage of filler in epoxy resin composite |
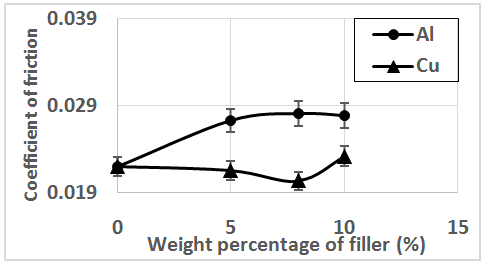 | Figure 7. Coefficient of friction versus weight percentage of Cu and Al particles in epoxy resin composite |
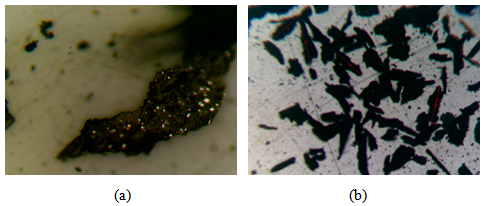 | Figure 8. Optical micrograph of (a) worn surface and (b) length of particle in Al/epoxy resin composites sliding over steel ball |
 | Figure 9. Optical micrograph of Cu/epoxy resin composites sliding over steel ball |
4. Descriptions
- The results indicate that the tensile strength decreases continuously with increase of weight percentage of fillers. Aluminium filled polymer matrix composite with a weight percentage of 1% experienced maximum tensile strength of all and then the tensile strength decreased thereafter. For 10% of copper and aluminium filled polymer matrix composite, the maximum tensile strength was less than that of pure epoxy resin (85.0MPa). At lower weight percentage, when the particles were added to the matrix, they were uniformly distributed and this caused crack deviation as shown in Figs. 10 (a &b).
 | Figure 10. SEM micrograph shows (a) deviation of crackline and (b) brittle type fracture in Al/epoxy resin composite |
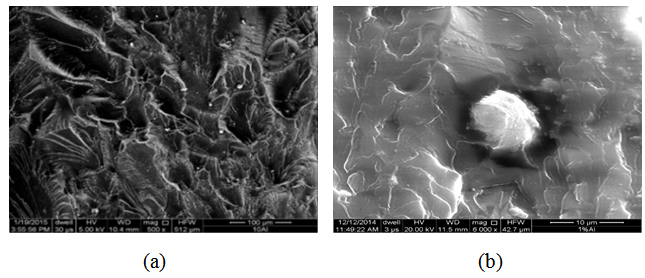 | Figure 11. SEM micrograph shows that (a) particles displaced and (b) particles debonded from matrix in Al/epoxy resin composite |
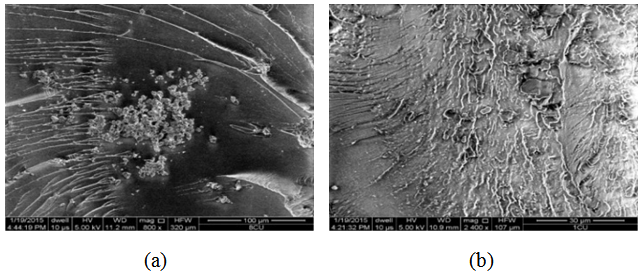 | Figure 12. SEM micrograph shows that (a) aggolomaration of Cu particles and (b) microcracks appeared in the Cu/epoxy resin compressive |
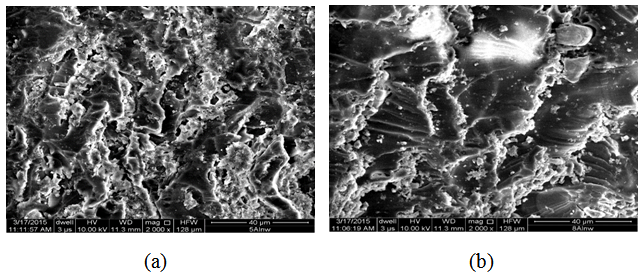 | Figure 13. SEM micrograph shows (a) plowing of particle and (b) thin debries coated in Al/epoxy resin composite after wear test |
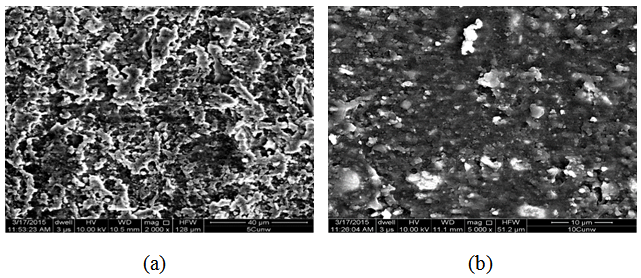 | Figure 14. SEM micrograph shows (a) plowing of particle and (b) patches removed in Cu/epoxy resin composite after wear test |
5. Conclusions
- Based on the experiments, following results can be drawn;i. Tensile strength of the particles filled composites degraded with increase of filler content. Al reinforced epoxy resin showed better tensile properties, in the comparison to Cu reinforced epoxy resin composites, with a maximum tensile strength of 104.5 MPa (23% greater than neat epoxy resin) at a weight percentage of 1%.ii. With increasing filler content, though Al filled epoxy resin composites gained compressive strength, Cu filled epoxy resin composites on the other hand showed the best results throughout with a maximum at 10% by weight.iii. There has been a potential increase in the hardness of Cu filled epoxy resin composites with increasing filler content, with a maximum hardness at 8% weight percentage. Though the hardness then decreased for Cu filled epoxy resin composites, but showed better results than Al filled composites. At higher weight percentages of fillers, hardness tends to increase as compared to neat epoxy resin.iv. The wear and friction results for both Al and Cu filled epoxy resin composites showed best results with an overall wear loss being almost half of that shown by neat epoxy resin. However, Cu content of 5% by weight in epoxy resin composites showed the best results of all in wear loss.
ACKNOWLEDGEMENTS
- The authors would like to thank Department of Mechanical Engineering, Indian Institute of Technology (BHU), Varanasi-221005, India for their supports.
 Abstract
 Reference
 Full-Text PDF
 Full-text HTML