Valentine Muramba 1, Maxwell Mageto 2, Francis Gaitho 2, Victor Odari 1, Robinson Musembi 1, Silas Mureramanzi 1, Kennedy Ayodo 3
1Department of Physics, University of Nairobi, Nairobi, Kenya
2Department of Physics, MasindeMuliro University of Science and Technology, Kakamega, Kenya
3Department of Physics, Kibabii University College, Bungoma Kenya
Correspondence to: Valentine Muramba , Department of Physics, University of Nairobi, Nairobi, Kenya.
| Email: |  |
Copyright © 2015 Scientific & Academic Publishing. All Rights Reserved.
Abstract
Thin films of Tin oxide co-doped with 28at%Aluminum and varied concentration of Sulphur were prepared on 1mm thick, 1 × 1 cm2 glass substrates at 470℃ by spray pyrolysis technique. Films were produced from 2.0 M solution of hydrous tin chloride dissolved in ethanol with 38% hydrochloric acid concentration, 1.5M aqueous Aluminum chloride and 2.0M aqueous solution of AmoniumSulphide. Effects of Sulphur concentration on structural and optical properties of transparent Tin Oxide thin films were investigated in the Sulphur content range (0-50) at% with a fixed 28at%Al content. Structural and optical characterization of films was measured with Siemens D5000 X-ray diffractometer and Perkin-Elmer Lambda 900 double beam spectrophotometer respectively. Dispersion analysis based on a model of Drude and Kim terms was used to simulate the experimental transmittance and reflectance data. Films with thickness lying in the range 171nm-247nm were analyzed. Polycrystalline structures without any second phases were observed with preferential orientations along the (110), (101), (200) and (211) planes. Average grain size as determined from the (110) peaks lay in the range 19.2nm-47.7 nm. Optical band gaps lay in the range 3.93-4.02eV. It was observed that co-doping lowered the grain size significantly and increased transparency of the oxide.
Keywords:
Spray Pyrolysis, Tin Oxide, Transparent Conductors, Co-Doping
Cite this paper: Valentine Muramba , Maxwell Mageto , Francis Gaitho , Victor Odari , Robinson Musembi , Silas Mureramanzi , Kennedy Ayodo , Structural and Optical Characterization of Tin Oxide Codoped with Aluminum and Sulphur, American Journal of Materials Science, Vol. 5 No. 2, 2015, pp. 23-30. doi: 10.5923/j.materials.20150502.01.
1. Introduction
Thin films of Transparent Conducting Oxide (TCO) play an essential role in modern optoelectronic devices through their combination of electrical conductivity and optical transparency. Metal oxides often behave like semiconductors with a wide band gap due to their strong chemical bonding [4, 20]. These Oxides found many applications among poly-crystalline thin films in technology and industry [4, 21] e.g. in optoelectronic devices, solar cells, electromagnetic shielding functional glasses and gas sensors. In heat-efficiency window applications (i.e. defrosting windows in refrigerators and air planes) TCOs are used as filters that reflect in infrared and remains transparent in the visible region [22].According to published results, the best n-type TCOs are Tin-doped Indium Trioxide (In2O3: Sn), Fluorine-doped Tin dioxide (SnO2: F), Aluminium-doped Zinc Oxide (ZnO: Al) thin films and Niobium-doped Titanium Oxide (TiO2:Nb) [18, 19].Optical transparency of more than 90% has been obtained in these films [23, 24]. However SnO2:F thin films, due to their high conductivity, lowest cost, best thermal stability, best mechanical and chemical durability and lowest plasma frequency, are the most widely used in different applications [23, 24]. Another improved TCO of SnO2:(Al+S) thin films can be prepared by a number of methods, such as CVD [13], sputtering [14], spray pyrolysis [15], plasma and sol–gel methods [16], each of which has advantages and disadvantages. Spray pyrolysis is suitable for substrates with complex geometry, and can be used for a variety of oxide materials. It’s also easy and cheap since it is a non-vacuum process; substrates with complex geometries can be coated; leads to uniform and high quality coatings, low crystallization temperatures and porosity can be easily tailored. The pyrolytic spray technique is the most suitable when high visible transmission and high infrared reflectance is desired [1]. In spray pyrolysis the precursor solution is pulverised as a fine mist via a spray nozzle and a carrier gas at high pressure. The so produced mist condenses on a preheated substrate, and is instantly pyrolysed. The process can be conducted in one or more pulses to obtain uniform films.In this report we present structural properties, reflectance and transmittance measurements on SnO2:(Al+S) films on glass substrates prepared by the pyrolytic spray method with fixed 28%Al and varying S dopant concentration.
2. Experimental
2.1. Sample Preparation
Undoped and Aluminum co-doped with Sulphur tin oxide films were pyrolytically deposited onto 1mm thick 1×1cm2 glass substrates by spray pyrolysis. The detailed description of the spray pyrolysis reactor and the optimization of the film growth is given elsewhere [1]. The heterogeneous reaction involved in the film formation is [2, 3]; | (1) |
of which the film would be an insulator if the reaction is complete. However, since the films obtained by pyrolytic decomposition are conducting, the expected reactions are: | (2) |
 | (3) |
The SnO2:(Al+S) films were produced from 2.0 M solution of hydrous tin chloride (SnCl4.5H2O) in ethanol mixed with a few milliliters of hydrochloric acid, 1.5M aqueous dopant solution of hydrous aluminium chloride (AlCl3.6H2O) and Ammonium Sulphide (NH4S).The spray pyrolysis technique is a typical method that has been used for the deposition of materials in thin form. The deposition apparatus consists of a spray chamber, hot plate, two spray nozzles and two input gas valves as shown in fig.1 with a separate spray nozzle is used for the dopant solution.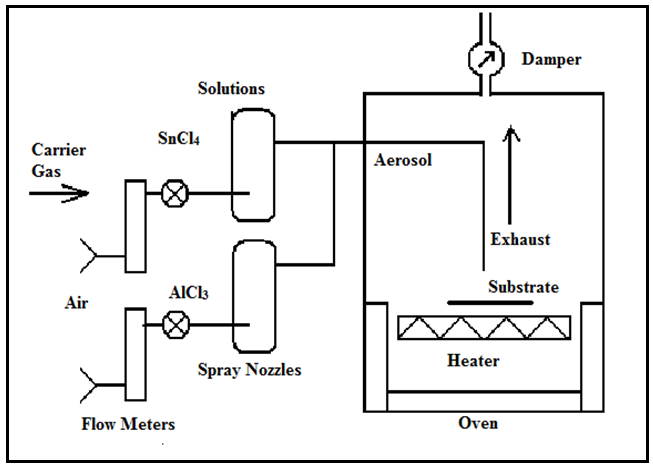 | Figure 1. Schematic diagram for spray pyrolysis oven used to prepare SnO2:Al thin films |
The doping concentration was varied by a carrier-gas flow rate ratio of x: 5 for NH4S to SnCl4 .5H2O (+AlCl3.6H2O) solutions, where ( x = 0.00, 1.00, 1.36, 1.60, 2.00, 2.65 ) i.e. Variation in doping concentration was achieved by increasing the NH4S flow rate. Compressed air was used as the carrier gas. For the different samples, the substrate temperature was maintained at 470℃ which is known to be the optimum temperature for formation of tin oxide films [4].
2.2. Sample Characterization
The structural properties were determined using Siemens D5000XRD system with CuKα(λ=1.54056nm) radiation. The effective grain size was determined from the Full-Width at Half-Maximum (FWHM) of X-ray peak lines of the (110) plane using Scherer formula of equation (4) and the Williamson-Hall formula of equation (5). 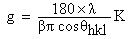 | (4) |
Where g is grain size, β is FWHM and K is a constant (0.9) with the grazing incident angle of 10 in parallel beam geometry of diffraction angle (2θ) between 200and 700. The information on strain (ε) and grain size was obtained from the relation: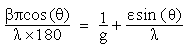 | (5) |
The transmittance and reflectance measurements were done at near normal incidence in the solar wavelength range from 0.3 to 2.5 μm on a Perkin-Elmer Lamda 900 UV/VIS/NIR double beam spectrophotometer equipped with an integrating sphere. Varied thicknesses of the deposited films were caused by varied concentrations of S and were calculated using Swanepoel method of interference fringes [5-7]. The film thickness is given by 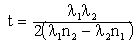 | (6) |
where λ1 and λ2 are the wavelengths at which two successive maxima or minima occur and n1 and n2 are the corresponding refractive indices. The estimated thickness was verified by fitting the experimental spectral data to theoretical spectral data in the wavelength range 0.3-2.5 μm
3. Results and Discussion
3.1. Structural Properties
Fig.2 shows the XRD patterns of the undoped and (Al+S) doped tin oxide films on glass substrates. The peaks in the spectra are identified as originating from reflections from the (110), (101), (200), (211), (310) and (301) planes of polycrystalline cassiterite structure tin oxide. No peaks from starting materials or any residual species were found in the spectra, confirming the proper phase formation of the materials [9]. It is clear that Al substitutes for Sn as S substitutes O in the SnO2 lattice since the crystal structure is not distorted. The doping spray ratio of S:Sn was in the range (0-50)at%. No change of the position of the XRD peaks with the S doping for the above percentages was observed and hence it was not alloying [9-11]. In addition, no extra peak appeared in the XRD pattern for the S incorporated in the films hence any possibility of phase separation was also ruled out [10]. XRD pattern did not present any shift in lattice parameters with increasing S doping concentration, suggesting that S solubility in SnO2 was low [17].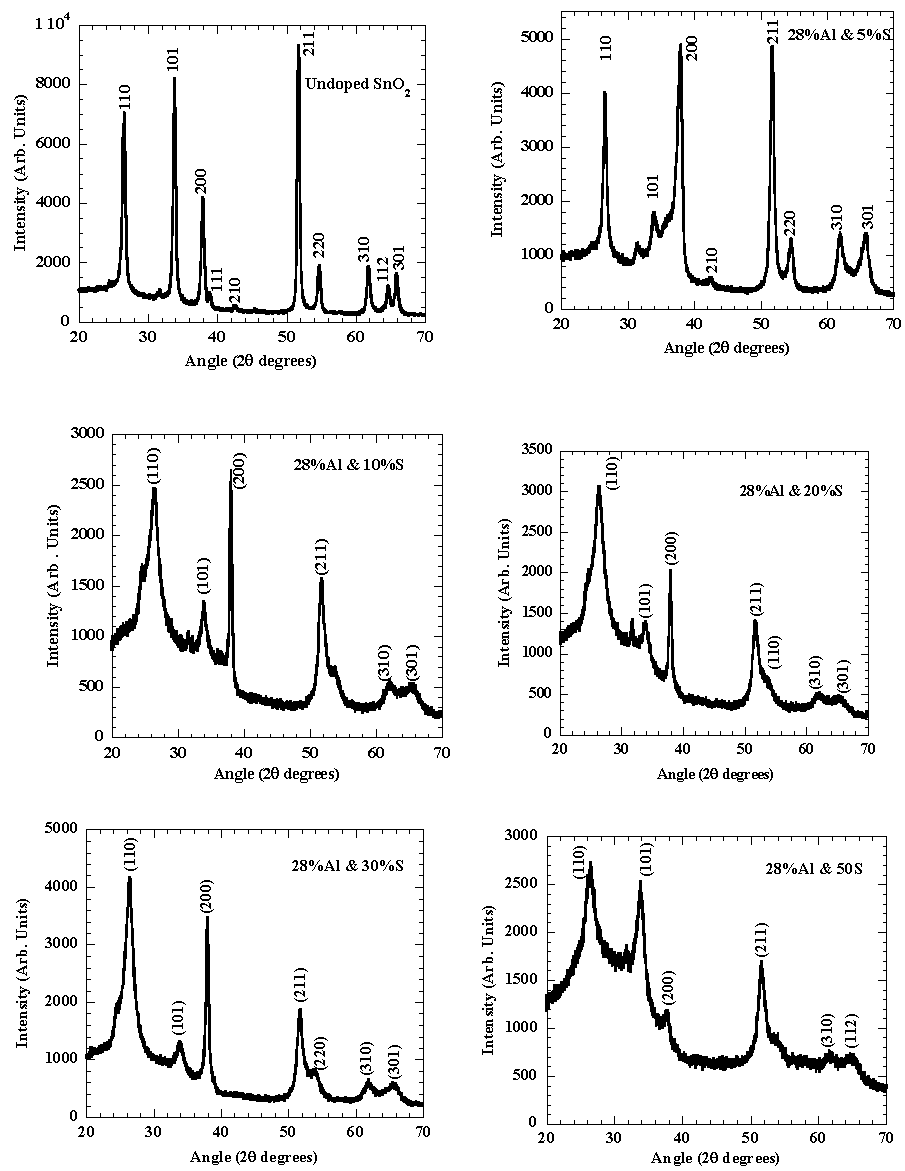 | Figure 2. X-ray diffractograms of SnO2 co-doped with 28%Al and S |
From fig.3, the slope of the graph βcos(θ)/λ versus sin(θ)/λ depicts the strain as being (0.004 – 0.152) compared to the literature value 0.0135 for sprayed SnO2 films [11].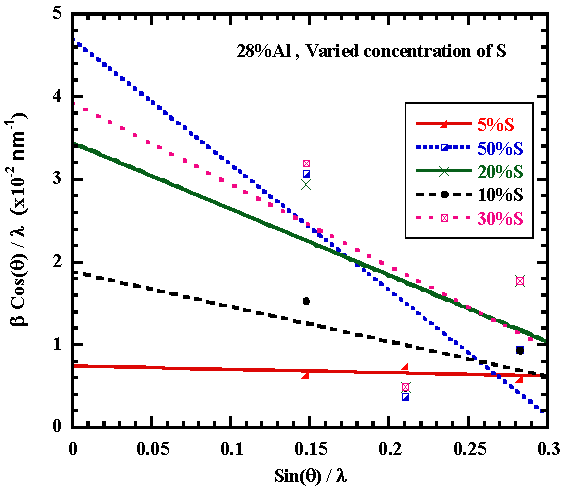 | Figure 3. Graph of βCos(θ)/λ versus Sin(θ)/λ for Al&S doped Tin Oxide |
The intercept on y-axis gives the crystallite size of (19.24– 47.68) nm for the 28at%Al,50at%S doped SnO2 and undoped SnO2 respectively from Scherer formula while from Williamson Hall formula, grain size is in the range (21.4 – 53.0)nm compared to the literature value of 25nm for undoped tin oxide.Fig.4 shows that S doping lowers the grain size. With increasing S dopant in the tin oxide film, the crystallinity of SnO2 decreased as strain increases [9, 10].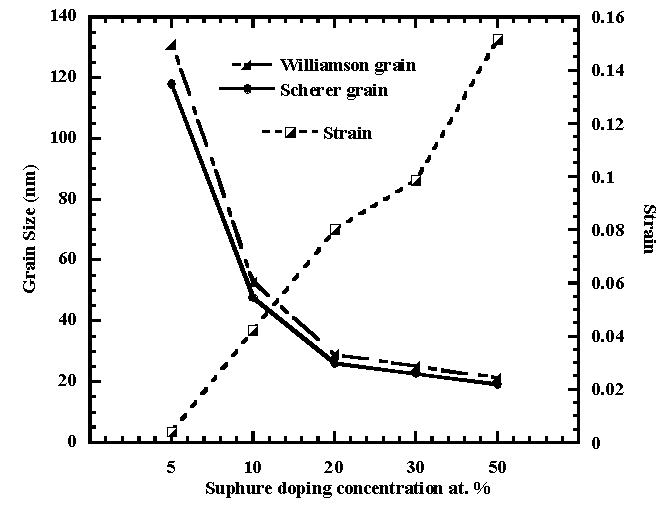 | Figure 4. Grain size against Strain versus Sulphur doping concentration |
3.2. Optical Studies
In order to compare the transparency of SnO2:(Al+S) thin films with various S-doping levels, samples were selected and their optical spectra in the UV-VIS–NIR region were measured. The optical transparency of SnO2:(Al+S) thin films for various S-doping levels is shown in fig.5. As shown in fig. 5, prior to the band edge near 544 nm, the film exhibits a transparency near 78% (for undoped) to 91 % for the 20%S-doped tin oxide. The transparency at about 1000 nm increased with increasing S doping concentration as seen in fig. 5.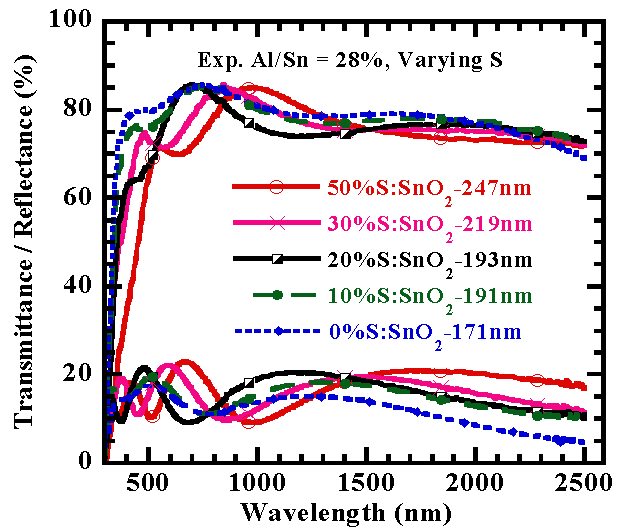 | Figure 5. Spectral Transmittance/Reflectance versus wavelength of films |
The dispersion analysis as computed from Drude-Kim model was used to extract refractive index(n) and extinction coefficient (k) where the former appeared to decrease as the latter increases with wavelength increase as shown in figures 6 and 7.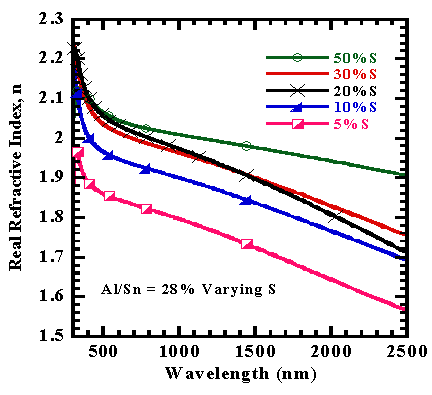 | Figure 6. Refractive index versus wavelength of films |
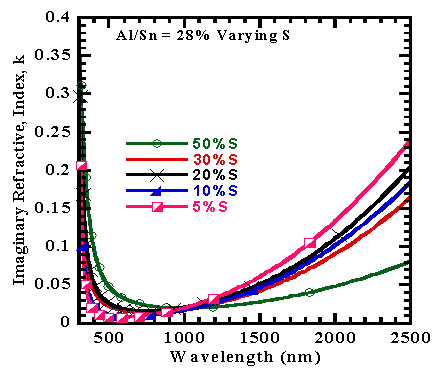 | Figure 7. Extinction Coefficient of Co-doped SnO2 with 28%Al and S versus wavelength |
For the optical bandgap measurement, films were deposited on glass substrates and their transmission, T and reflectance, R spectra were recorded. Next, the optical absorption coefficient,α for different wavelengths,λ was determined from the expression [12]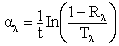 | (7) |
where t is the film thickness.For direct transitions the absorption coefficient varies as  where Eg is the direct band gap. Figure 8 shows plots of (αhv)2 versus photon energy (hv, in the high absorption region. Extrapolation of the curve to hv = 0 gives the direct band gap.
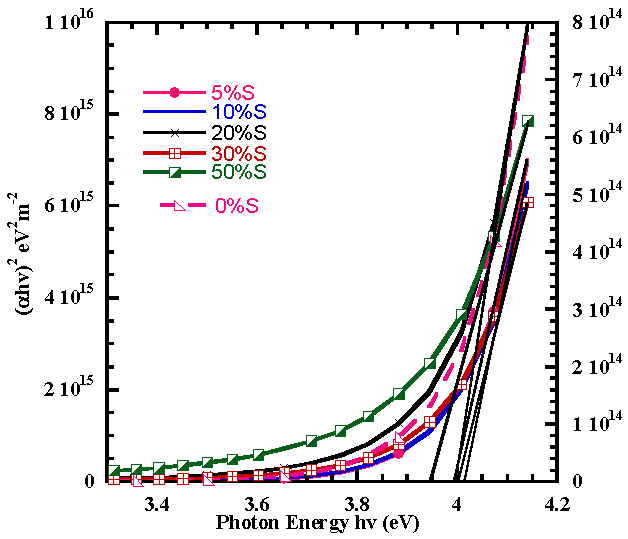 | Figure 8. Variation of (αhv)2 with photon energy (hv) for spray pyrolyticaly grown of Al and S co-doped and Undoped SnO2 |
The calculated direct bandgap values of SnO2:(Al+S) films obtained as the intercepts of the tangents to the curves (αhv)2 versus photon energy (hv) as shown in fig. lay in the range 3.93eV to 4.02eV with 10%S exhibiting the highest value which are also comparable with the values already reported; 3.604 to 4.105 eV [11] and 3.87 to 4.21 eV [10]. The bandgap slightly narrows down due to the decrease in the number of charge carriers (Mageto et al; 2012). The variation of the bandgag with dopand concentration is illustrated in fig.9.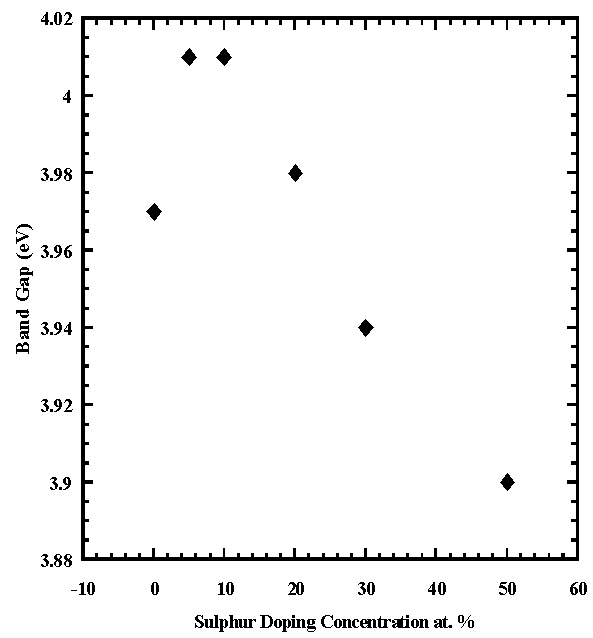 | Figure 9. Energy Band gap of Co-doped SnO2 with 28%Al and S versus Sulphur concentration |
3.3. Discussion
High quality films of SnO2:(Al+S) were produced by spray pyrolysis. Pyrolytically deposited aluminum co-doped with sulphur tin oxide has large influence on desired structural and optical properties of tin oxide.It was observed previously [8] that the growth of SnO2 films on glass is highly dependent on the substrate temperature. High temperatures (>400℃) promoted the growth of larger crystallites in the film giving rise to optical scattering in the UV-Visible region while low temperatures (< 400℃) produced crystalline films but at a lower deposition rate. Hence, in this work, the deposition temperature was maintained at 470℃. XRD analysis have shown crystallinity in the films with crystallite sizes of about 19.2nm to 47.7 nm, which are too small to observe any pronounced optical scattering. Therefore these films were highly specular. The variation in dopand concentration did not alloy the structure which however remained polycrystalline without second phase.The energy bandgaps of the range 3.93eV to 4.02eV showed improved structure of the oxide with transmittance of about 91%.
3.4. Conclusions
From the XRD difractogrammes, co-doping Tin Oxide with Sulphur and Aluminium does not cause alloying and phase separation. Hence there is no shift in lattice parameters. The structure of the Oxide is however improved as depicted with increased strain and reduced grain sizes with increased doping concentration. Transparency is improved to 91% implying improved transmittance. The band gap slightly narrowed with increased sulphur concentration compared to earlier reported literature values of undoped Tin Oxide.
ACKNOWLEDGEMENTS
The authors would like to thank the IPPS of Uppsala University, University of Nairobi, University of Eldoret and Masinde Muliro University of Science and Technology, Physics Dpt. for their support.
References
| [1] | Karlson T., Roos A. and Ribbing C. G. Solar Energy Materials 11 (1985) 469 – 487. |
| [2] | Chopra K. L., Major S. and Pandya D. K. Thin Solid Films,102 (1983) 1 – 46. |
| [3] | Chacko S., Philip N. S., and Vaidyan V. K. Phys. Stat. Sol. (a)204, No. 10, 3305 – 3305 (2007). |
| [4] | Mohammad-Mehdi B. and Mehrdad S., J. Phys.D: Appl. Phys37 (2004) 1248-1253. |
| [5] | Peng C. H. and Desu S. B., J. Am. Ceram. Soc. 77, 929 (1994). |
| [6] | Hartridge A., Krishna M. G. and Bhattacharya, J. Phys. Chem.Solids 59(6/7), 859 (1998). |
| [7] | Swanepoel R. J. Phys. E, Sci. Instrum. 16, 1214 (1983). |
| [8] | Mwamburi M. M. (2001) The preparation and characterization of SnOx:F/Al2O3/Al spectrally selective reflector surface for solar concentrator applications. PhD Thesis.Moi University: 59-157. |
| [9] | Jain K., Pant R. P., Sensors and Actuators B 113 (2006) 823–829. |
| [10] | Sk. F. Ahmed · S. Khan · P. K. Ghosh · M. K. Mitra ·K. K. Chattopadhyay; Sol-Gel SciTechn (2006) 39:241–247. |
| [11] | Sk.F. Ahmed, P.K. Ghosh, S. Khan, M.K. Mitra, K.K. Chattopadhyay; Appl. Phys. A 86, 139–143 (2007). |
| [12] | W. Q. Hong, J. Phys. D: Phys. 22, 1384-1385, 1989. |
| [13] | G. Sanon, A. Rajrup, Mansingh, Thin Solid Films 190 (1990) 287. |
| [14] | B.S. Chiou, S.T. Hsieh, W.F. Wu, J. Am Ceram. Soc. 77 (1994) 1740. |
| [15] | I.S. Mulla, H.S. Soni, V.J. Rao, A.P.B. Sinha, J. Mater. Sci. 21 (1986) 1280. |
| [16] | Y. Takahashi, Y. Wade, J. Eletrochem. Soc. 127 (1990) 267. |
| [17] | Cabezas M.D.; Lamas D.G.; Baby R.E.; 4Cabanillas E.; Walsöe de Reca N.E.; The Journal of the Argentine Chemical. |
| [18] | Mageto J.M., Mwamburi M.M. Muramba V. W., (2012) The influence of Al doping on optical, electrical and structural properties of transparent and conducting SnO2:Al thin films prepared by spray pyrolysis technique, Elixir Chemical Physics 53: 11922-11927. |
| [19] | Muramba V. W., (2013) Preparation and Characterization of Transparent and Conducting Doped Tin Oxide Films; Masters thesis. |
| [20] | Maghanga C.M., Jensen. J., Niklasson G.A., Granqvist C.G., Mwamburi M.M. (2010), Transparent and Conducting TiO2:Nb films made by Sputter Deposition 94: 75-79. |
| [21] | Roos, A. and Georgson M. (1991). Material Science for Solar Energy Conversion Systems. Materials Science and Engineering,22: 29. |
| [22] | Walsh A. (2011) Semiconducting Oxides, Physics of condensed matter, 23:334210. |
| [23] | Lewis B.G and Paine D.C (2000) MRS Bull. Size-dependent Electrical Behavior of Spatially Inhomogeneous Barrier height region on Silcon. Applied Physics 77:2566-2568. |
| [24] | Gordon R.G and Bright C (2000). Highly Transparent and conductive thin films of ZnO doped with a rare-earth element; Thin Solid Films 25: 52. |
 Abstract
 Reference
 Full-Text PDF
 Full-text HTML