Chhatrapati Parida1, Sarat Kumar Dash2, Chinmay Pradhan3, Sarat Chandra Das4
1Department of physics, Odisha University of Agriculture and Technology, Bhubaneswar, India
2Department of Education in Science and Mathematics, Regional Institute of Education (NCERT), Bhubaneswar, India
3Post Graduate Department of Botany, Utkal University, Vanivihar, India
4Department of Chemistry, Salepur Autonomous College, Salepur, India
Correspondence to: Chhatrapati Parida, Department of physics, Odisha University of Agriculture and Technology, Bhubaneswar, India.
| Email: |  |
Copyright © 2015 Scientific & Academic Publishing. All Rights Reserved.
Abstract
The dielectric properties of luffacylindrica(LC) fiber reinforced resorcinol-formaldehyde(RF) composites have been studied in terms of bonding between fiber and matrix. The effects of fiber loading and alkali treatment on LC fiber composite were investigated by dielectric constant, dielectric loss factor and ac conductivity measurement in the frequency range from 100Hz to 1 MHz and temperature from 26℃ to 100℃. The dielectric constant, ac conductivity and dielectric loss factor were increased with increase in wt of LC fiber in the composites and decreased with incorporation of alkali treated LC fiber in the composites. Furthermore the dielectric constant and dielectric loss factor of the composites were decreased and ac conductivity were increased with increase in frequency and fiber loading. The presence of α relaxation was detected in all LC fiber composites.
Keywords:
LC fiber, Dielectric constant, Dielectric loss factor, AC conductivity, Alkali treatment
Cite this paper: Chhatrapati Parida, Sarat Kumar Dash, Chinmay Pradhan, Sarat Chandra Das, Dielectric Response of Luffa Fiber - Reinforced Resorcinol Formaldehyde Composites, American Journal of Materials Science, Vol. 5 No. 1, 2015, pp. 1-8. doi: 10.5923/j.materials.20150501.01.
1. Introduction
Resorcinol-formaldehyde(RF) matrix is well known as an insulator whose insulation property has made it as one of the most desirable material for electrical applications such as suspension insulators, bushings, studs, sleeves, gaskets, spacer panels , switch boards, printed circuit boards etc [1-3]. To tackle the issues of global warming, research in recent years has been focused on biodegradable composites. In order to achieve the goal of recyclable and biodegradable composites, natural fibers emerged as the choice to be used as reinforcements in composite materials. The present investigation dealt with luffa cylindrica (LC), a common tropical fruit of Odisha, India as reinforcement in composite materials for producing green composites. Composites as a dielectric are becoming more popular and studies of electrical properties of natural fiber reinforced polymer composites are therefore very important. The study of electrical properties of such materials like dielectric constant, dielectric loss factor and ac conductivity indicate their suitability as insulating materials for various applications. Dielectric studies of composites reinforced with various natural fibers have been carried out by several researchers. According to Jayamol et al in 1997 [4] dielectric constant of pineapple fiber-reinforced polyethylene composites increased with fiber loading due to increased orientation and interfacial polarization. Similar results were also obtained by Paul and Thomas in 1997 [5] while studying the electrical properties of sisal and coir fiber reinforced LDPE composites. However, such findings were predominant at low frequencies and values of dielectric constant were found to decrease with chemical treatment on sisal-coir fiber, because of the decrease in hydrophilic nature of fiber after chemical treatment. The dielectric properties of untreated and treated sisal fibers were studied by Li et al in 2000 [6]. Electrical properties of coconut coir fiber reinforced polypropylene composite with references to the fiber loading and chemical treatment have been reported by Lai CY et al in 2005 [7]. Effect of sisal fiber orientation on electrical properties of sisal fiber reinforced epoxy composites has been studied by Chand et al in 2005 [8]. They reported anisotropic electrical behavior of the composites. Electrical properties of banana fiber reinforced phenol formaldehyde composites are discussed by Joseph. S et al in 2008 [9]. K. Murali Mohan Rao et al in 2009 [10] carried out a study to investigate the dielectric properties of composites by reinforcing vakka as a natural fiber into polyester resin matrix and compared with those of established composites like sisal, bamboo and banana made under similar laboratory conditions. The dielectric strength of vakka fiber composite increased with increase in volume fraction of fiber in the composite. Laly A. Pothan in 2009 [11] prepared hybrid composites of glass and banana fiber in polyester matrix. The value of dielectric constant was found to be lowest in the case of composites with relatively lower glass volume fraction. Bledzki et al in 2009 [12] fabricated flax fiber reinforced polypropylene composite. Before reinforcing, flax fiber was modified with acetylation in the presence perchloric acid. The composites with modified fiber show improvement in dielectric properties in comparison to untreated fibers. Rafah A. Nassif in 2010 [13] investigated the effect of the chemical treatment on banana fiber on the dielectric properties of composites. The values of the dielectric constant of the treated fiber composite were found to be lower than that of the untreated fiber composite and virgin unsaturated polyester. This is due to low mobility of electrons in the outermost orbital of cellulose crystals compared with those in the amorphous phase such as lignin and hemi cellulose.In view of this, the present investigation dealt with LC fiber that contains 60% cellulose which is a common tropical fruit of Odisha, India as reinforcement for producing green composites. Although there are reports available on the dielectric behavior of natural fiber reinforced polymeric system, but the reports on the study of dielectric response of LC fiber reinforced RF composites are sparse. Therefore the present investigation dealt with the results and analysis of our studies on the dielectric constant, dielectric loss factor and electrical conductivity of composites using LC fiber in order to explore the use of these composites in various applications such as suspension insulators, switchboard, bushings etc.
1.1. Experimental Procedures
Chemical treatment of fiberThe LC fibers were cut into small pieces of length about 2cm. The adhesion between reinforcement (LC fiber) and the resin matrix was enhanced by giving the chemical treatments on the surface of LC fiber for ensuring quality composite materials. Therefore the dried LC fibers were initially treated with alkali followed by bleaching and acid hydrolysis. During alkali treatment, the LC fibers were soaked in a 5% NaOH solution at 80℃ for 1h. The fibers were then dried at room temperature for 48 h followed by oven drying in oven at 60℃ for 6h. During this treatment the hemicelluloses and lignin present in the fibers are extracted and the number of -OH groups present in the LC fiber is reduced. The decrease in –OH groups enhances hydrophobicity of the fibers which strengthen the bonding between fiber and matrix. There is disruption of hydrogen bonds in the network structure of cellulose due to the alkali treatment and it increases the surface roughness as well as the adhesion between fiber and matrix. This alkali treatment thus depolymerizes cellulose and exposes the short length crystallites of cellulose. The alkali treated LC fibers were then bleached with 2% sodium hypochlorite solution. The mixture was continuously stirred for 2h at 80℃ and then filtered. The pulp obtained after bleaching is called micro crystalline cellulose (MCC). The colour of the bleached LC fibers appear yellowish from black. Finally the bleached LC fiber/water suspension was prepared and kept on an ice bath. H2SO4 was added slowly under continuous stirring to the suspension until the final concentration of 60% H2SO4 was reached. The obtained suspension was then heated at 45℃ under continuous stirring for 2h. In order to remove excess acid the mixture was washed and centrifuged using an ultracentrifuge at 30℃ for 20 minutes with 7000 rpm.Preparation of compositesTo analyze the effect of chemical treatment on LC fiber, composites were prepared by taking RF resin, chemically treated LC fibers and untreated LC fibers. The prepared grounded RF resin and LC fiber are mixed in different weight proportion for obtaining B1, B2, B4 and B5 samples. In sample B1 and B2, the RF resin and untreated LC fiber are in wt ratio 1: 1 and 1: 2 respectively. In sample B4 and B5, the RF resin and treated LC fiber are in wt ratio 10: 1 and 5: 1 respectively. B3 sample contains only powdered RF resin. Maleic anhydride (1g) and ethylene di-amine (4.6ml) were added as cross linkers to 1g of resin. The mixture was heated at constant temperature 70℃ for 9 h to get composites. The grounded composite was then exposed to ultrasonic vibration at 30 kHz for 1 h at room temperature using a sonicator (1.5 L50 H/Deluxe, India) in order to enhance dissolution of particles by breaking intermolecular interactions. Furthermore the particles of the samples are subjected to agitation when exposed to ultrasonic wave and hence particle size decreases. Fabrication of composite sheet10 g of powdered composites(RF resin and LC fiber) was mixed with 10 g of commercial divinyl benzene and kept for 12 h at 28℃. The material was made acidic by addition of 0.25 ml of methane sulphonic acid. The sample was swollen due to absorbtion of divinyl benzene. This facilitated the sample to be soft and paste like material. The paste was kept in a small mould (10 cm × 2 cm) and was heated for 4 h at 60°C and was cured to get cross linked composite.Electrical property evaluationRectangular shaped samples of 10m x 10mm x 2mm was used for evaluation of electrical properties. Test samples were prepared by cutting from the composite specimens using a die. The rectangular surfaces of the test samples were coated with conductive silver paint. The test samples were fixed between two electrodes and kept inside the sample holder. The capacitance and dielectric loss measurements in this study were performed by using a computer interfaced LCR HIOK/ 3532-50, JAPAN. Two sets of measurements were undertaken out of which one is from temperature 26℃ to 120℃ at various frequencies with a heating rate of 2℃ /min and another is from 100Hz to 1MHz frequency at various temperatures for the evaluation of dielectric properties of RF resin matrix and the composites. Dielectric constant was calculated using the equation | (1) |
where Cp is measured capacitance and C0 is calculated using the formulae, | (2) |
A (mm²) is the area of the sample, d is the thickness of the sample.In an ideal electrical circuit having condenser, the charging current is 90° out of phase with applied voltage. In vector notation the total current is the sum of charging current and loss current. The angle δ between the vector for the amplitude of total current and that for the amplitude of charging current is known as the loss angle. The tangent of the loss angle can be expressed as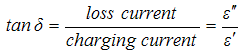 | (3) |
where ε’ is the measured dielectric constant of the sample and ε” is the dielectric loss factor.The ac conductivity (σac) was calculated using an empirical relation i.e.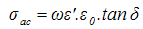 | (4) |
where  is the permittivity in free space, and ω is the angular frequency.
2. Results and Discussion
The plant biomass (LC) is constituted by substances containing cellulose, lignin and hemicellulose. During alkali treatment given to the LC fibers, the hemicelluloses and lignin present in the fibers are extracted and the number of -OH groups present in the fiber is reduced. The decrease in -OH groups increases hydrophobicity of LC fibers which strengthen the bonding between fiber and matrix.Figure 1 shows the X-ray diffractogram of the treated fibers of LC.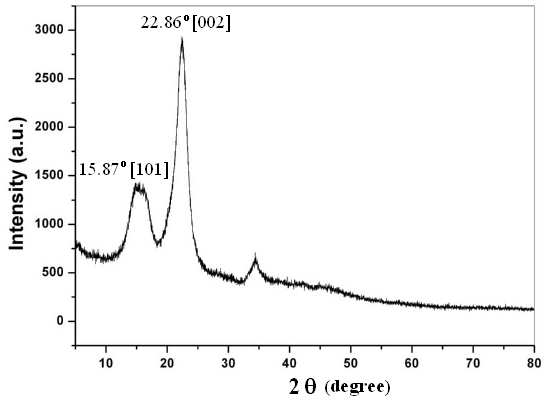 | Figure 1. XRD spectra of treated fibers of LC |
The XRD spectra in Figure 1 confirms the removal of hemicelluloses and lignin from the treated LC fibers. The treated LC fibers contain only celluloses. However the treated LC cellulose fibers are partly crystalline and partly amorphous in nature. The peak at 15.87° in Figure 1 corresponds to amorphous cellulose or cellulose II of [101] crystallographic plane and the peak at 22.86° correspond to crystalline cellulose [cellulose I] of [002] crystallographic plane [14]. The removal of hemicelluloses and lignin from the LC fiber increases the hydrophobicity and explores the possibility of controlling the dielectric response of composites when it is reinforced.
2.1. Effect of Frequency, Fiber Loading and Fiber Treatment on Dielectric Constant
The dielectric constant (ε’) of a material is a measure of polarization of the medium when the medium is subjected to an external electric field. Higher value of ε’ implies greater degree of polarization. For heterogeneous materials like composites the interfacial polarization is due to difference in conductivities of the resin and the reinforcement. The effect of interfacial polarization is pronounced at low frequency, due to which dielectric constant of all the samples is high at low frequency region. At low frequency region probably complete orientation of polar molecules are possible for which orientation polarization is high at low frequencies. When frequency increases the time interval decreases and little time is left for orientation of electrical dipoles. Therefore the dielectric constant of a material is a function of temperature, frequency of the external applied electric field, presence of polar groups and presence of fillers and moisture [8, 9]. A plot of dielectric constant as a function of log frequency for pure resin matrix (sample B3) and fiber reinforced composites are displayed in Figure 2. Figure 2 also shows the variation of dielectric constant with fiber loading and fiber treatment as a function of frequency.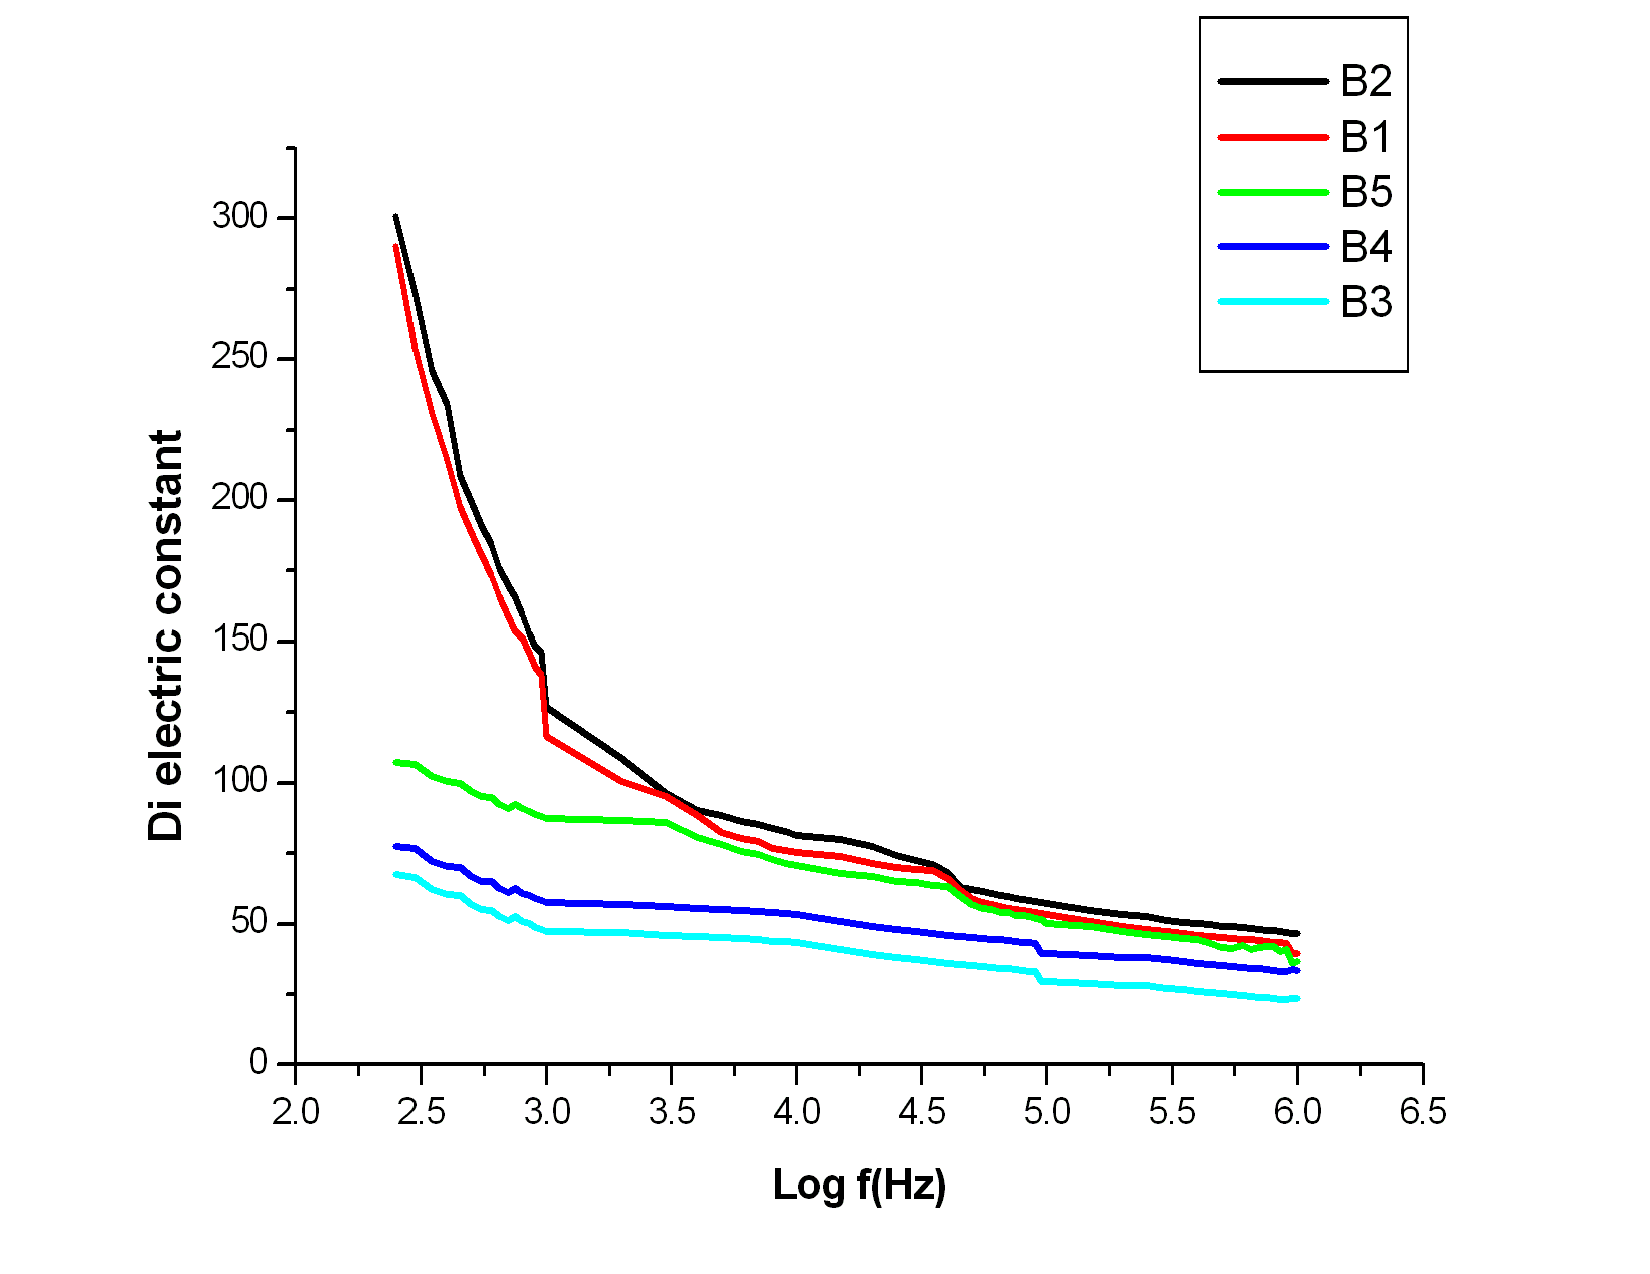 | Figure 2. Variation of dielectric constant of all samples at 26℃ |
From Figure 2 it is observed that the dielectric constant of all samples are found to decrease considerably with frequency up to 1 kHz. The high dielectric constant at frequency below 1 kHz is due to interfacial polarization [10]. The dielectric dispersion region spreads from 103 Hz to 105 Hz. which is relatively wide. The contribution to dielectric constant in this region is from orientation polarization, atomic polarization and electronic polarization. The atomic and electronic polarization are instantaneous and hence observed in mid and high frequency range. It is also observed that above 105 Hz the dielectric constant still decreases and may be due to decrease in orientation polarization [11]. The dipolar orientation polarization is due to the presence of polar -OH groups. Untreated LC fibers contain 60% cellulose, 30% hemicellulose and 10% lignin which contain polar groups and hence influence dipole polarization. The resorcinol matrix also contains polar groups. With increase in wt of untreated LC fiber the number of polar groups increases and hence dielectric constant also increases. When the LC fibers are treated with alkali, hemi cellulose and lignin are removed due to which number of polar groups are reduced. As such the hydrophilic nature of LC fiber decreases due to alkali treatment. Also the moisture content in LC fiber is heavily reduced. These two factors probably contribute for decrease in orientation polarization in treated LC fiber composites. Therefore the dielectric constant of treated fiber composite (B4, B5) is less than the untreated fiber composites (B1, B2).Variation of dielectric constant of B4 composite sample with temperature is shown in Figure 3 at three different frequencies such as 1 KHz, 10 KHz and 100KHz.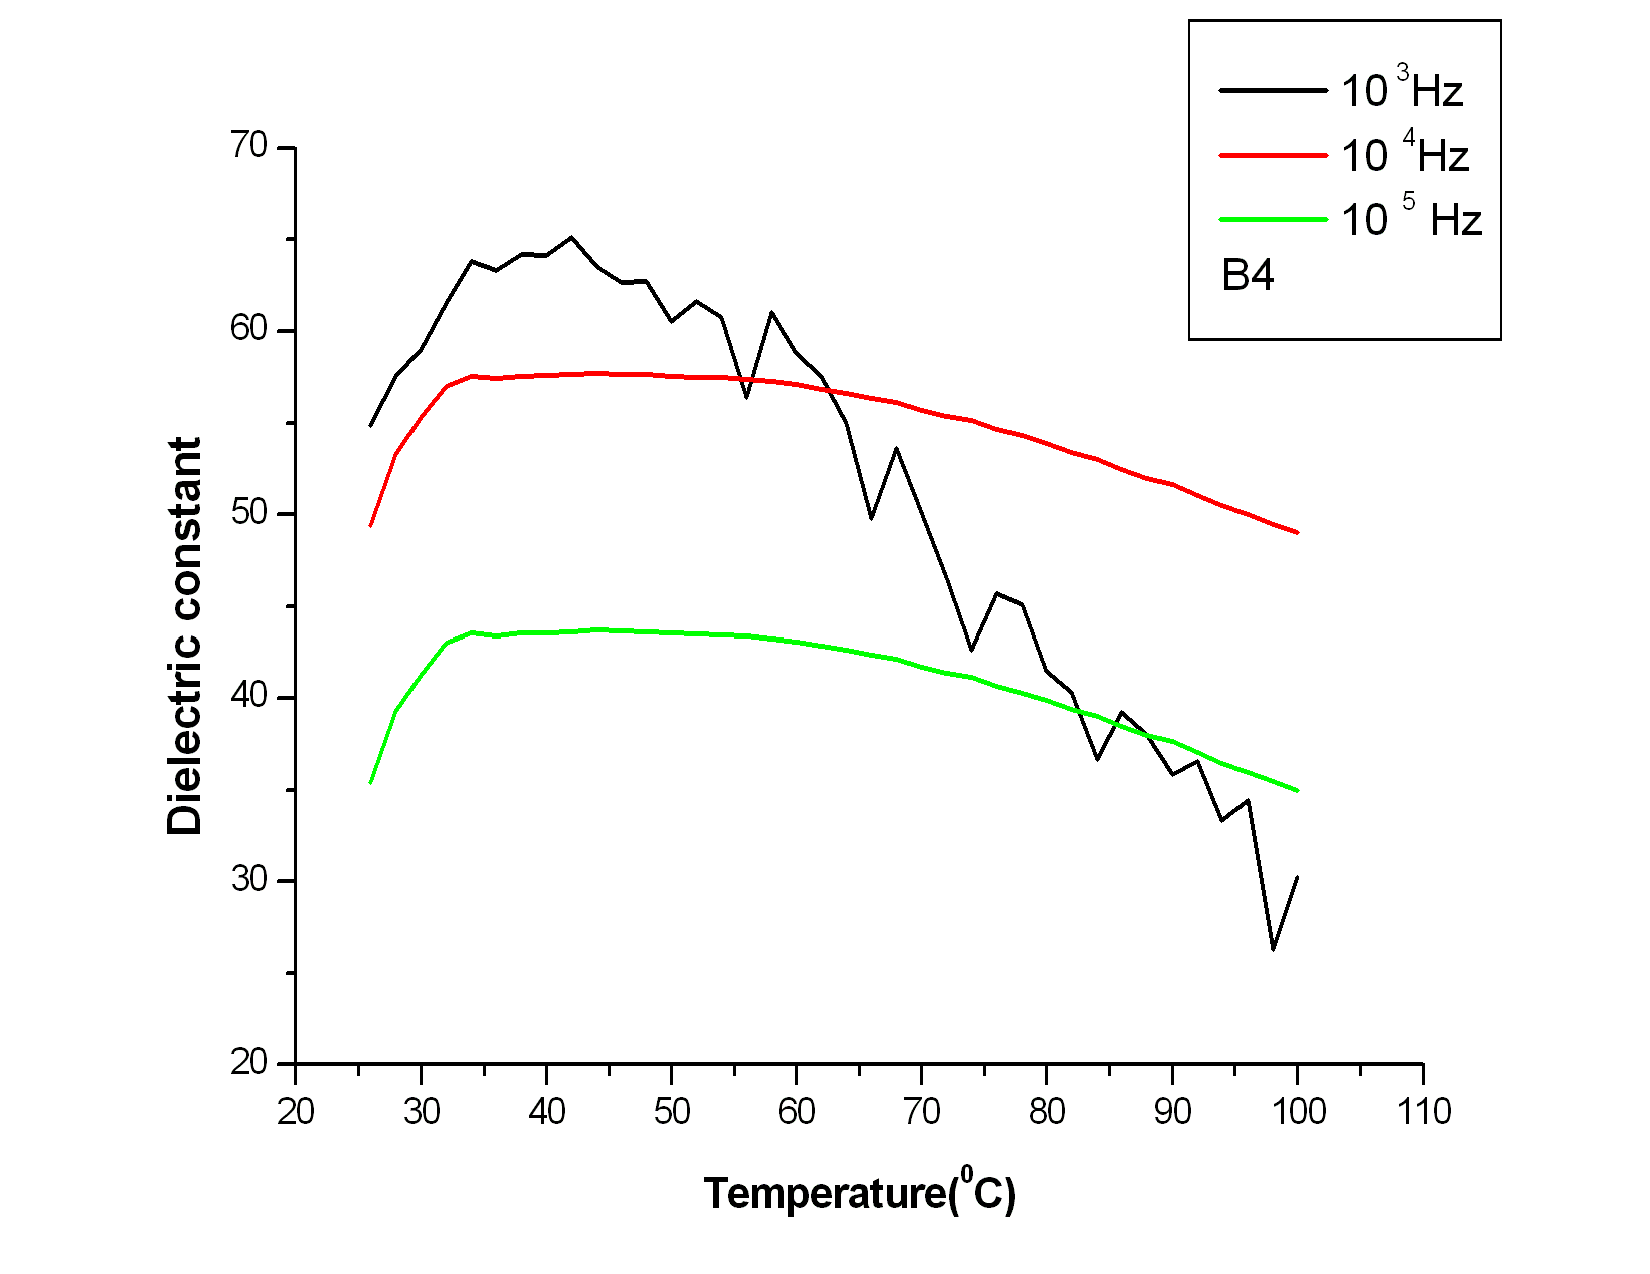 | Figure 3. Variation of dielectric constant of composite sample B4 with temperature |
From Figure 3 it is observed that at all frequencies, dielectric constant increases up to around 35℃ and then decreases. Furthermore it is found that the peak height at transition temperature decreases with increase in frequency. Similar trends are also observed for other samples. The initial increase of dielectric constant is due to presence of polar water molecules in LC fiber. With rise in temperature the amount of water content decreases and hence dielectric constant decreases. The exothermic peak observed around 35℃ confirms the presence of a relaxation known as α -relaxation or low temperature relaxation [12]. The presence of so many peaks in the variation of dielectric constant at low frequency of 1kHz may be due to random oscillation of electric dipoles and disturbed bonding between LC fiber and resin matrix.The values of dielectric constant of all the composites and matrix at different frequencies and at temperature of 26℃ is shown in Table 1.| Table 1. Values of dielectric constant of all samples at different frequencies |
| | Sample | Dielectric constant | | At 103 Hz | At 104 Hz | At 105 Hz | At 106 Hz | | B1 | 116.66 | 75.24 | 57.29 | 46.46 | | B2 | 126.66 | 81.24 | 53.29 | 39.46 | | B3 | 47.46 | 43.29 | 29.46 | 23.46 | | B4 | 57.46 | 53.29 | 39.46 | 33.46 | | B5 | 87.46 | 70.71 | 50.09 | 36.49 |
|
|
Table 1 betokens that the values of dielectric constant is minimum for matrix (sample B3) at all frequencies. At 1 kHz, the dielectric constant of RF resin matrix(B3) is observed to be 47.46. When the matrix is reinforced with untreated LC fiber the dielectric constant increases up to 116.66 in sample B1.When the wt of untreated LC fiber increases in the matrix the dielectric constant further increases to 126.66 in sample B2. However the values of dielectric constant increases from 47.46 in sample B3 to 57.46 in sample B4, as the matrix is reinforced with treated LC fiber. When the wt of treated LC fiber increases in matrix, the dielectric constant increases to 87.46 in sample B5.
2.2. Effect of Frequency, Fiber Loading and Fiber Treatment on Dielectric Loss Factor
The measurement of dissipation factor or dielectric loss factor is important as it represents the electrical energy which is converted to heat energy. The heat energy released from the consumption of electrical energy increases the temperature and is responsible for detritions of the sample. Energy loss in dielectric is resulted from three primary processes, such as ion migration loss, ion deformation loss and electron polarization loss. Ion vibration and deformation loss are important at higher frequencies where as ion jump and dipole relaxation losses are more pronounced at moderate frequencies. The values of loss factor of the resin matrix and all the composites are presented in Table 2.| Table 2. Values of dielectric loss factor at different frequencies |
| | Sample | Dielectric loss factor | | At 103 Hz | At 104 Hz | At 105 Hz | At 106 Hz | | B1 | 2.07 | 0.68 | 0.15 | 0.072 | | B2 | 2.57 | 0.71 | 0.20 | 0.092 | | B3 | 0.78 | 0.39 | 0.10 | 0.06 | | B4 | 0.98 | 0.60 | 0.11 | 0.06 | | B5 | 1.27 | 0.65 | 0.12 | 0.07 |
|
|
As observed from Table 2 the dielectric loss factor is minimum for resin matrix (sample B3) at all frequencies. When the matrix is reinforced with untreated LC fiber the dielectric loss factor is increased from 0.78 (in sample B3) to 2.07 (in sample B1).With increase in wt of untreated LC fiber the loss factor is further increased to 2.57 in sample B2. However, the values of loss factor for sample B4 and sample B5 is at 0.98 and 1.2 respectively. As wt of untreated LC fiber is increased in the matrix, the number of polar groups are increased. It accounts for higher interfacial and dipole orientation polarization and results in higher loss. But when the LC fibers are treated with alkali and composites are formed using treated LC fibers, the dielectric loss factors decreased as compared to that of untreated LC fiber composites. The low loss factor values of treated LC fiber composites in sample B4 and B5 may be due to increase in hydrophobic nature of treated LC fiber as well as less orientation polarization. The moisture present in the LC fiber contributes for dipole and interfacial polarization and it accounts for higher values of dielectric loss factor of the composites at lower frequencies. The movement of charge particles across the boundaries of the LC fiber and RF matrix is responsible for interfacial polarization. It generates a large effective dipole moment due to large charge displacements and the dielectric loss is therefore more due to internal friction. At high frequency the losses are due to orientation polarization of the polar groups present in the composites [13, 15]. The temperature variation of dielectric loss of composite sample B2 at five different frequencies is shown in Figure 4. Similar trends are observed for all other samples. | Figure 4. Variation of dielectric loss factor of composite sample (B2) with temperature |
From Figure 4 it is observed that variation of dielectric loss is more pronounced at low frequencies. At higher frequencies of 10 5 Hz and 106 Hz the values of loss factors are found to be almost same for all the composites. A low temperature relaxation is observed at around 35℃ in the low frequency range up to 100kHz.The exothermic peak in Figure 4 is due to high interfacial polarization losses. The increase in dielectric loss with temperature is due to presence of polar water molecules in LC fiber. With rise of temperature, polar water molecules decreases and losses also decrease.
2.3. Effect of Frequency, Fiber Loading and Fiber Treatment on ac Conductivity
The variation of ac conductivity with frequency of all the composites and matrix at different frequencies are displayed graphically in Figure 5. The conductivity of natural fibers is attributed due to the presence of ionic species in the fiber. The mobility of the ions and the number of charge carriers are controlled by moisture present in the fiber. As observed in Figure 5 conductivity of all the samples increases with increase in frequency and it may be due to out of phase oscillations of more and more of the bound charges with applied voltage. This probably contributes to increase of ac conductivity of composite samples with frequency.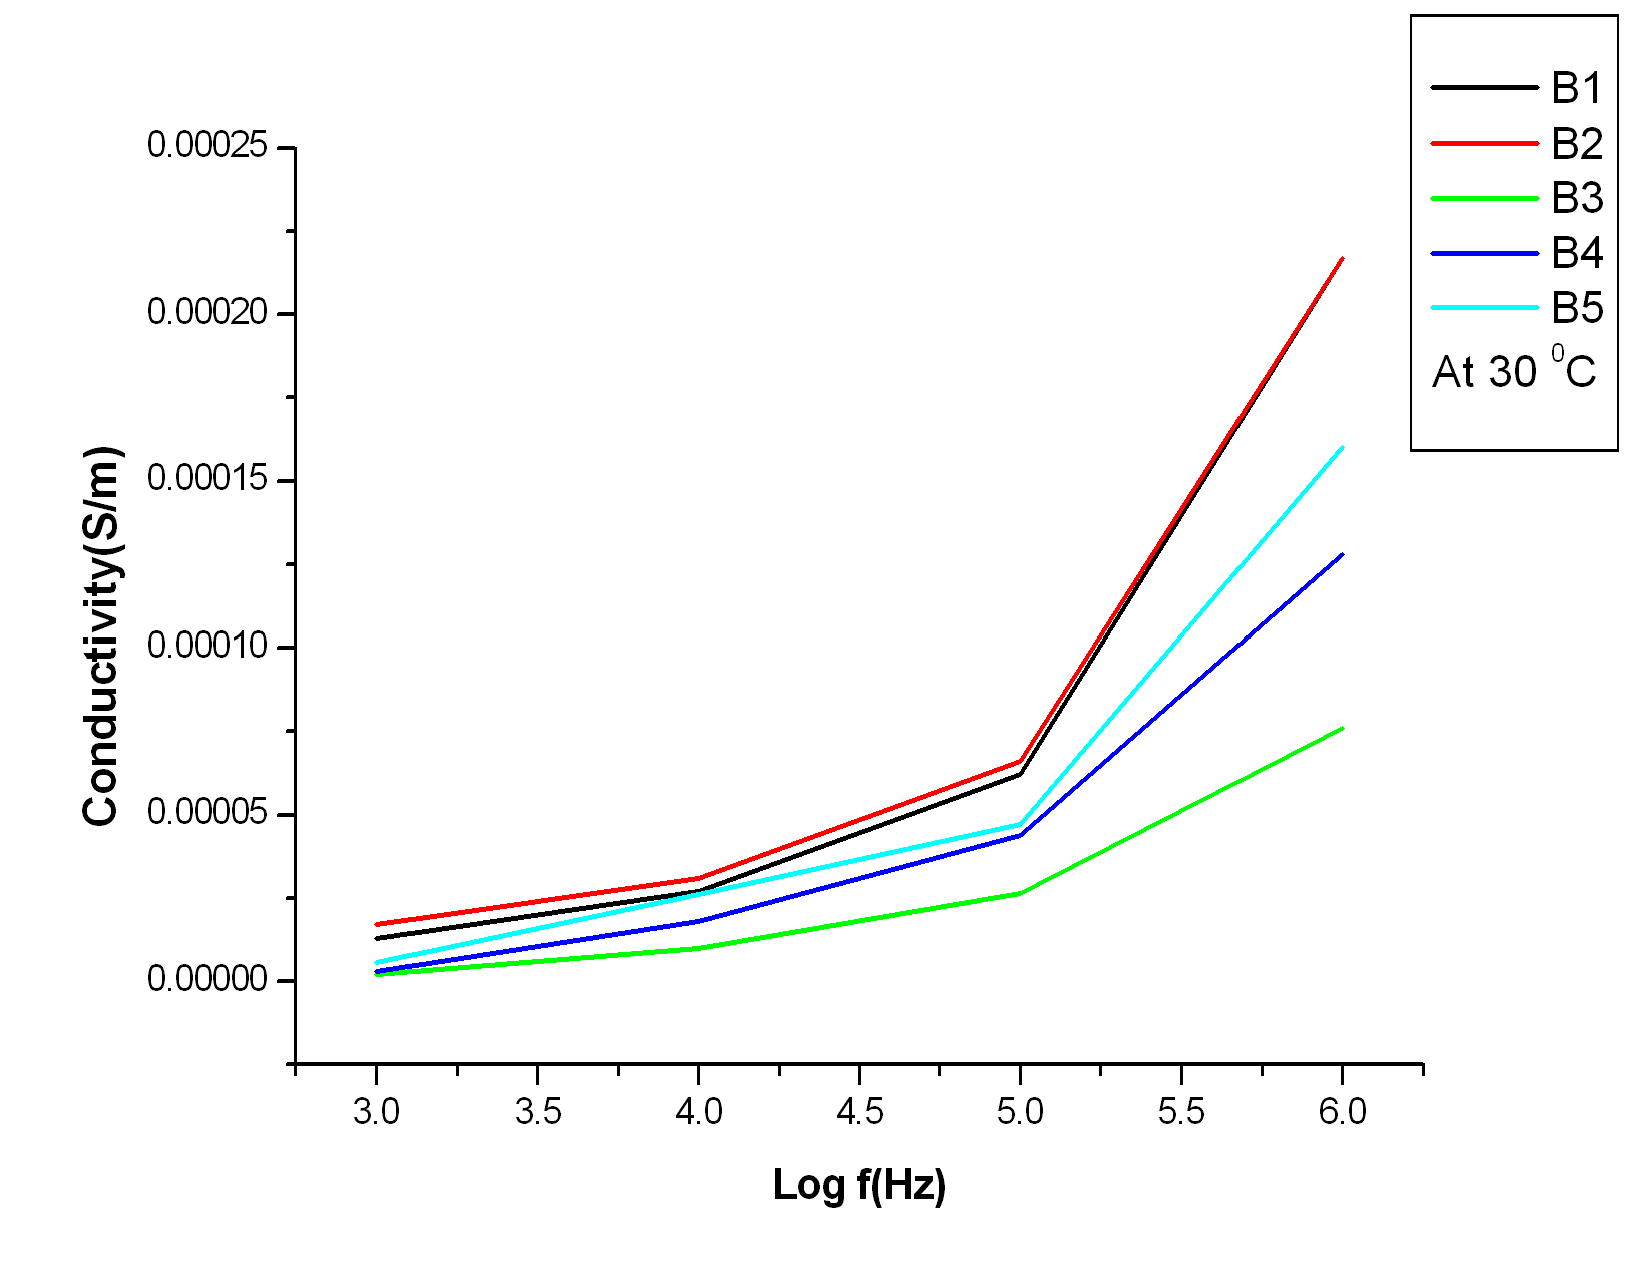 | Figure 5. Variation of conductivity with frequency at different fiber loading |
The variation of ac conductivity with frequency of all the composites and matrix at different frequencies are presented in tabular form in Table 3.| Table 3. Values of ac conductivity of all composite samples at different frequencies |
| | Sample | Conductivity (Si/m) (x 10-5) | | At 103 Hz | At 104 Hz | At 105 Hz | At 106 Hz | | B1 | 1.28 | 2.70 | 6.22 | 21.7 | | B2 | 1.70 | 3.10 | 6.61 | 21.7 | | B3 | .20 | .98 | 2.64 | 7.60 | | B4 | .317 | 1.80 | 4.39 | 12.8 | | B5 | .580 | 2.60 | 4.73 | 16 |
|
|
From Table 3 it is observed that the conductivity of the composite samples increases with fiber loading. The conductivity of treated and untreated LC fiber composites are found to be more than that of the pure resin matrix (sample B3). The ac conductivity of 20 x 10-5 S/m for matrix (sample B3) is increased to 1.70 x 10⁻⁵ S/m in sample B1 and 1.80 x 10⁻⁵ S/m in sample B2.Similarly the conductivity is 0 .317 x 10 -5 S/m in sample B4 and 0.58 x 10⁻⁵ S/m in sample B5.The conductivity is found to be maximum for the sample B2 where the wt of untreated LC fiber is maximum. The ac conductivity of untreated LC fiber composites (sample B1 and sample B2) are more compared to that of the treated LC fiber composites (sample B3 and sample B4). In case of fiber reinforced composites, pathways of sufficiently low resistivity must be present throughout the composites. In case of B1 and B2 sample when the wt of fiber in the composite is more, the interaction between the fiber and matrix is poor due to high fiber content and fibers agglomeration. Due to agglomeration of fibers and low dispersion in the matrix the gap decreases. It accounts for high conductivity of sample B2 followed by sample B1.When the LC fibers are treated with alkali, hydrophilic nature of LC fiber decreases due to removal of polar -OH groups. Chemical treatment on LC fiber improves interaction between LC fiber and matrix. In sample B4 and sample B5 there is well dispersion of fibers in the matrix. Due to very low concentration of fibers in sample B4 and sample B5, the fibers are well dispersed for which the gap is high and it accounts for less conductivity in sample B4 and B5.Figure 6 shows the plots of ac conductivity with temperature for composite sample B5 at 4 different frequencies. Similar trends are also observed for other samples. The variation of conductivity is well pronounced at higher frequencies. At low frequency region conductivity is found to be almost invariant with temperature. As observed from Figure 6, the conductivity first increases with increase in temperature with a maxima at 35℃ and then decreases. The initial increase of conductivity may be due to presence of water dipoles in LC fiber. With increase in temperature water dipoles become free and there is greater freedom of movement of dipole molecular chain. However with increase in temperature beyond 35℃, due to reduced water content in the fiber conductivity decreases. 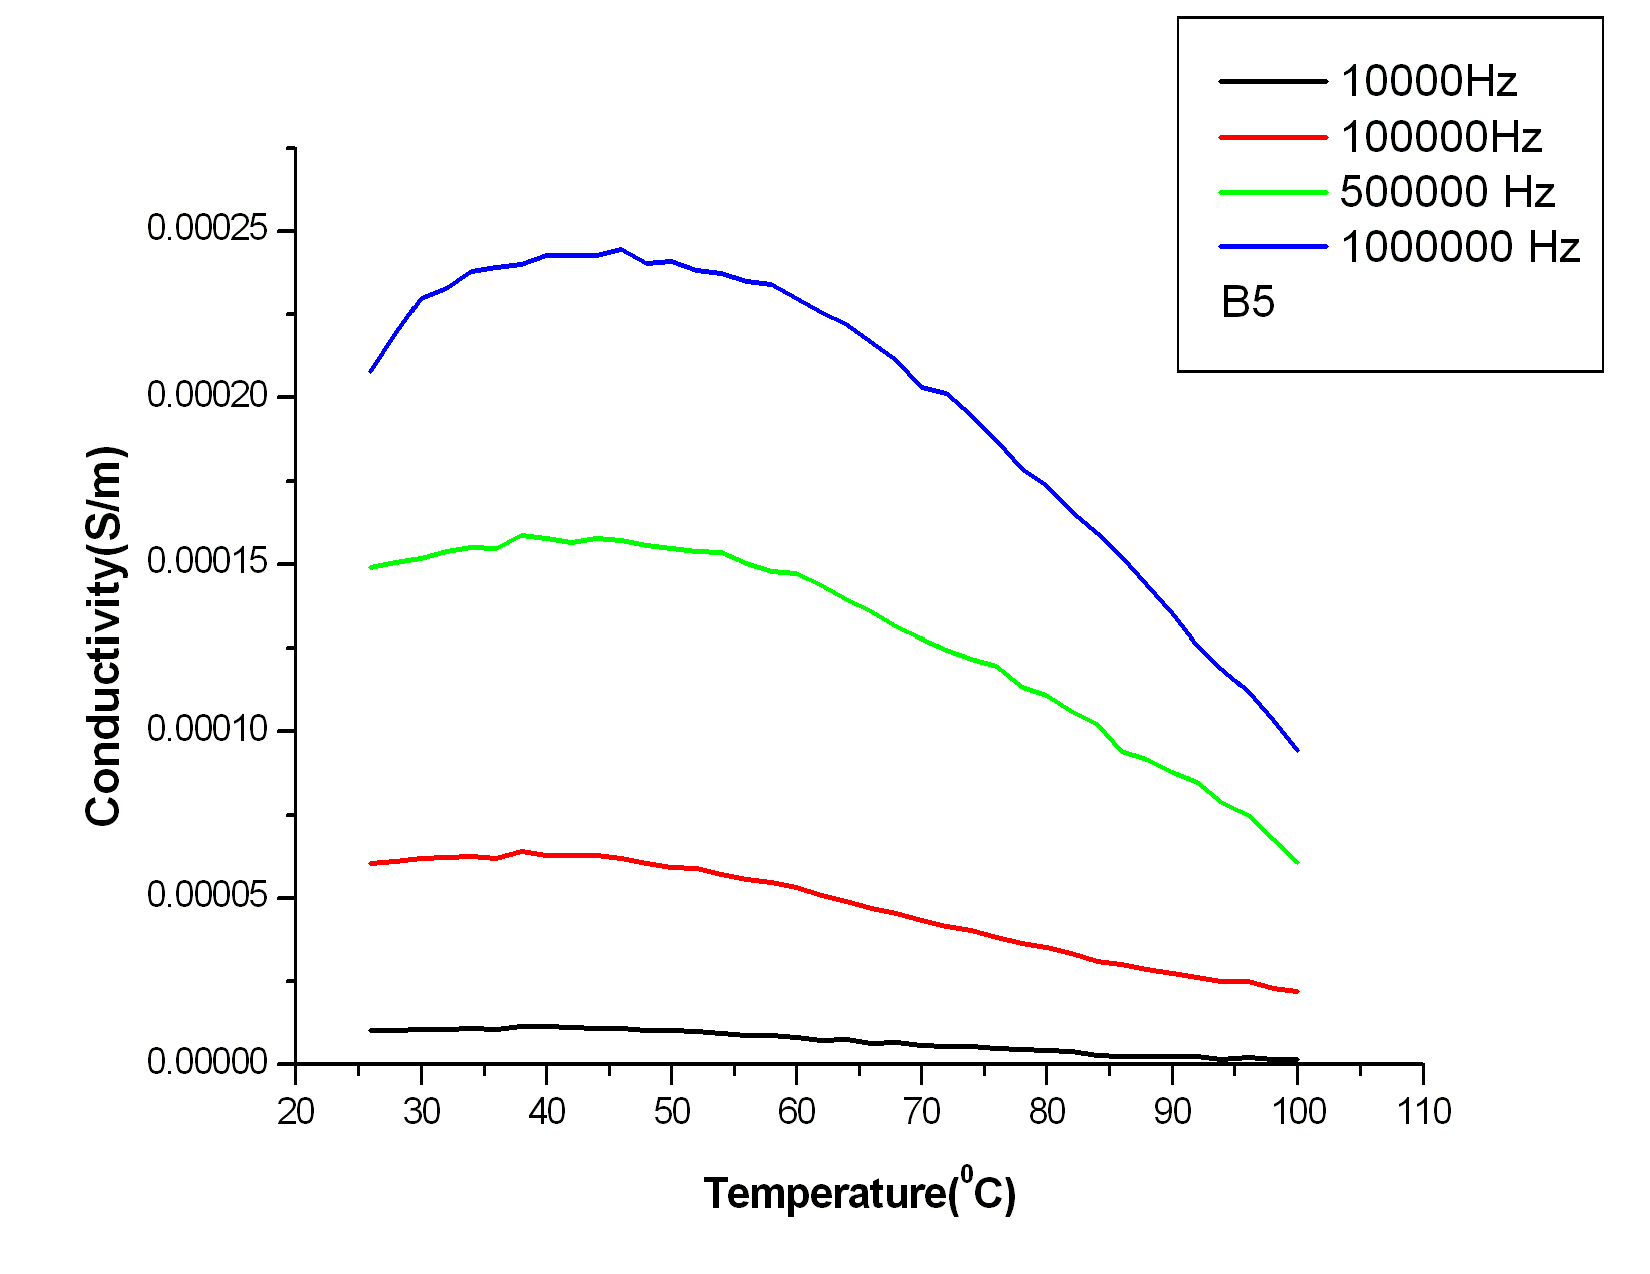 | Figure 6. Variation of ac conductivity with temperature for sample B5 |
3. Conclusions
Dielectric constant, dielectric loss factor and ac conductivity of treated fiber composites, untreated fiber composites and pure matrix are studied. Dielectric constant and loss factor of all the samples decreases while ac conductivity of all the samples increases with increase in frequency. Furthermore dielectric constant, dielectric loss factor and ac conductivity increases with increase in fiber loading. All these properties are more pronounced in untreated LC fiber composites (sample B1 and sample B2) as compared to that of treated LC fiber composites (sample B4 and sample B5). It is found that the bonding between fiber and matrix influence the conductivity of the composites i.e more the bonding, less is the conductivity. Composites having improved mechanical properties are found to be less conducting in nature. Presence of α relaxation is detected for all the samples. The variation of different dielectric properties like dielectric constant, dielectric loss and ac conductivity with fiber loading and fiber treatment are in good agreement with studies of many research workers like A. Paul et al in 1997 [16], Joseph. S in 2008 [9]. The treated LC fibers can be explored to be used in the preparation of printed circuit board (PCB), e-paper organic light emitting diodes etc.
References
| [1] | Bledzki A.K., Gassan J, 1999. Composites reinforced with cellulose based fibres, Prog.Polym. Sci, 24, 221-274. |
| [2] | Joseph, S.; Sreekala, M. S.; Oommen, Z.; Koshy, P.; Thomas, S, 2002. A comparison of the mechanical properties of phenol formaldehyde composites reinforced with banana fibres and glass fibres, Compos SciTechnol, 62, 1857-68. |
| [3] | Mukherjee, P.S.; De, A.K.; Battacharjee, S, 1978. Electrical anisotropy of asbestos: a fibrous tremolite, J Mater Sci, 13(8), 1824-1828. |
| [4] | Jayamol, G.; Bhagawan. S.S.; Thomas, S, 1997. Electrical Properties of Pineapple Fibre Reinforced Polyethylene Composites J Polym Eng, 17, 5 .383-404. |
| [5] | Paul A., Thomas S. and Pavithran C, 1997. Electrical properties of natural-fiber reinforced low density polyethylene composites: a comparison with carbon black and glass-fiber filled low density polyethylene composites. J Appl Polym Sci, 63, 247-266. |
| [6] | Li, Y., Mai, Y-W., Lin, Y., 2000. Sisal fibre and its composites: a review of recent developments. Compos Sci. Techno, 60, 2037–55. |
| [7] | Lai, C.Y., Sapuan, S.M., Ahmad, M., Yahya, N., Dahlan, K.Z.H.M, 2000. Mechanical and electrical properties of coconut coir fibre-reinforced polypropylene composites, Polym. Plast. Technol. Eng, 44, 619–632. |
| [8] | Chand, N.; Jain. D, 2005. Effect of sisal fiber orientation on electrical properties of sisal fiber reinforced epoxy composites, Composite Part A, 36,594-602. |
| [9] | Joseph, S.; Thomas. S, J, 2008. Electrical properties of banana fiber-reinforced phenol formaldehyde composites, Appl Polym Sci, 109, 256-263. |
| [10] | K. Murali Mohan Rao, K. Mohana Rao, A.V. Ratna Prasad, 2010. Fabrication and testing of natural fiber composites: Vakka, sisal, bamboo and banana, Materials and Design, 31, 508- 513. |
| [11] | Pothan, Laly. A.; George, Chandy. N.; John, Maya Jacob.; Sabu, Thomas, 2010. Dynamic Mechanical and Dielectric Behavior of Banana-Glass Hybrid Fiber Reinforced Polyester Composites, Journal of Reinforced Plastics and Composites, 29(8), 1131-1145. |
| [12] | Bledzki, A. K.; Lucka, M.; A, I. Mamun. A, 2009. Biological and electrical resistance of acetylated flax fiber reinforced polyprolene composites, Bio Resources, 4(1), 121-126. |
| [13] | Rafah, A. Nassif., 2010. Effect of Chemical Treatment on The Some Electrical And Thermal Properties For Unsaturated Polyester Composites Using Banana Fibers, Engg and Tech Journal, 28(10), 191-196. |
| [14] | Jintao Wang, Yian Zheng and Aiqin Wang, 2010. Effect of kapok fiber treated with various solvents on oil absorbency. Industrial Crops and Products, 40, 178-184. |
| [15] | G, M. Arifuzzaman. Khan & Md. Shamsul Alam, 2012. Thermal characterization of chemically treated husk fiber, Indian Journal of Fiber & Textile Research, 37. 20-26. |
| [16] | Augustine Paul, Kuruvilla Joseph and Sabu Thomas, 1997. Effect of surface treatments on the electrical properties of low-density polyethylene composites reinforced with short sisal fibres, Composites Science and. Technology, 57, 67-77. |
 Abstract
 Reference
 Full-Text PDF
 Full-text HTML