-
Paper Information
- Next Paper
- Paper Submission
-
Journal Information
- About This Journal
- Editorial Board
- Current Issue
- Archive
- Author Guidelines
- Contact Us
American Journal of Materials Science
p-ISSN: 2162-9382 e-ISSN: 2162-8424
2014; 4(2): 84-96
doi:10.5923/j.materials.20140402.05
Superparamagnetic Behavior in the Two Polymorphous Lithium Ferrite Nanoparticles
 Abstract
 Reference
 Full-Text PDF
 Full-text HTML
Y. M. Abbas, A. Bakry M., A. Hassan Ibrahim
Physics Department, Faculty of Science, Suez Canal University, Ismailia, Egypt
Correspondence to: Y. M. Abbas, Physics Department, Faculty of Science, Suez Canal University, Ismailia, Egypt.
| Email: |  |
Copyright © 2014 Scientific & Academic Publishing. All Rights Reserved.
The two polymorph modifications of LiFe5O8, fine particles were successfully prepared by ceramic technique at pre-sintering temperature of 500℃ and the pre-sintered material was crushed and sintered finally in the open air at 1000℃. The structural and microstructural evolutions of the nanophase were studied using powder X-ray diffraction (XRD) and the Rietveld method. The two polymorphous LiFe5O8 includes the ordered phase, termed α-LiFe5O8, with a primitive cubic unit cell (space group P4332, a=8.337 Å) in which the Fe3+ ions are at octahedral 12d and tetrahedral 8c sites, and Li+ ions occupy only the octahedral 4b positions in the cubic primitive unit cell and disordered face centered cubic structure, termed β-LiFe5O8 (space group Fd-3m, a = 8.3333 Å), The refinement of XRD results revealed the presence of mixed and nearly inverse spinel nanocrystalline Li-ferrite phases. Transmission electron microscopy (TEM) revealed that the particles of the prepared samples were spherical in shape, and were found to be ~20 nm in size, which increased up to ~ 60 nm on calcinations at 1000℃. TEM micrograph shows that the resultant nanospheres are solid like balls, the mechanism based on the lithium ferrite nanoparticles self-growth process is proposed in the formation of the nanospheres and TEM analysis confirmed the particle size obtained from X-ray results. Scherrer’s equation was used to calculate the particle size of lithium ferrite from XRD data. Magnetic measurements were assessed using a vibrating sample magnetometer. Our results for the two polymorphs LiFe5O8 prepared samples show that the HC is very small and approaches zero compared to the applied field, the prepared samples for the two polymorphs exhibits no hysteresis, which may be attributed to superparamagnetic relaxation as confirmed by XRD.
Keywords: α-LiFe5O8, Sintering,Curie temperature, Ceramic technique, Polymorphism, Coercivity, Magnetization, Superparamagnetism, Rietveld, Fullprof
Cite this paper: Y. M. Abbas, A. Bakry M., A. Hassan Ibrahim, Superparamagnetic Behavior in the Two Polymorphous Lithium Ferrite Nanoparticles, American Journal of Materials Science, Vol. 4 No. 2, 2014, pp. 84-96. doi: 10.5923/j.materials.20140402.05.
Article Outline
1. Introduction
- The lithium spinel ferrites synthesized by various classical have been extensively studied due to their specific physical properties and practical applications, as a low-cost substitute of garnet ferrites in microwave devices. These ferrites are characterized by a high Curie temperature of 900 k and a relatively high electrical resistivity, which reduces power loss. Lithium iron oxides such as LiFeO2 and LiFe5O8 have recently become of increasing interest in the field of Engineering and are promising candidates for cathode materials in rechargeable lithium batteries.Spinel-type LiFe5O8 is known to occur in two crystalline forms. The first is a disordered β- LiFe5O8 [1] that is obtained by the rapid quenching of samples from high temperatures above 1000℃ to room temperature. It has a disordered face centred cubic structure (space group Fd3m, a = 8.333 Å), in which the Fe3 + and Li + ions are randomly distributed in the octahedral interstices. The second is the ordered phase, termed α-LiFe5O8, with a primitive cubic unit cell (space group P4332, a=8.337 Å) [2], in which the Fe3+ ions are at octahedral 12d and tetrahedral 8c sites, and Li+ ions occupy only the octahedral 4b positions in the cubic primitive unit cell.Upon slow cooling, an order–disorder phase transformation occurs near 750℃, producing the second crystalline form, termed α-LiFe5O8, where only Li + and Fe3 + ions arrange in an ordered ratio of 1:3 amongst the octahedral interstices, the two phase formation is defined as a polymorphism. Later on, Schierer et al. [3] discovered two other high temperature phases, and named them γ-LiFe5O8 (tetragonal, a = 6.025 Å, c = 7.534 Å) and δ-LiFe5O8 (cubic, a = 8.501 Å), which cannot be returned to the previous two phases. Various preparation methods have been developed for the synthesis of nanoparticles, including hydrothermal ball milling [4], freeze-drying method [5], flux method [6], double sintering ceramic technique [7], the spray drying of mixtures of lithium and iron formats [8] and so on. In this study a double sintering ceramic technique was used for the preparation of single-phase ordered α–LiFe5O8 and disordered β- LiFe5O8 powders. The advantages of solid state reactions ripple throughout many industries. It is important to economics because the elimination of solvents means that products will cost less. This, in turn, will make those products cheaper to buy. The formation of LiFe5O8 required the repeated firing of the samples at high temperatures. The single-phase lithium ferrite was characterized by using X-ray diffraction (XRD). Since physical properties of a materials depend upon its microstructure, knowledge of the microstructure is an important prerequisite for controlling material’s performance. Therefore, Rietveld analysis [9–11] was adopted in the present study to determine the microstructural parameters of nanocrystalline LiFe5O8. The aims of this analysis were: (i) characterizing the prepared materials in terms of microstructural parameters such as crystallite size and lattice strain and (ii) estimating the distribution of cations among A- and B-sites in the spinel lattice.
2. Experimental Details
2.1. Sample Preparation
- Polycrystalline single-phase LiFe5O8 was synthesized by the standard double sintering ceramic technique using high purity (>99%) oxides and carbonates Fe2O3 and Li2CO3. The stoichiometric mixtures of all the ingredients were thoroughly mixed in a wet medium (acetone) for 1 h in an agate mortar and pestle to obtain a homogeneous mixture. Compounds were then dried at 200℃, ground manually and pre-calcinated in high purity alumina crucibles at 500℃ for 3 h in atmospheric air. The pre-calcinated mixtures were divided into two sections. The first section was sintered to 1000℃ for 9 h, then quenched in solid ice. Next, it was remilled mechanically for another 10 min to obtain the disordered form of lithium ferrite. The second section was sintered to 1000℃ for 9 h, then slowly cooled down to room temperature, followed by remilling for another 10 min to obtain the ordered form of lithium ferrite.
2.2. Characterization Techniques
- Powder XRD was used for structural analysis. Powdered samples were exposed over a wide range of Bragg angles (10o< 2θ <80o) at room temperature using an X-ray powder diffractometer (X'Pert pro panalytical), with CuKα radiation, λ= 1.540560 Å and a scanning rate of 2o (2θ)/min. XRD data were used to estimate the mean particle size with the classical Scherrer formula, D (nm) = kλ/βcosθ; where β is the full width at half maximum of diffraction peak, θ is the Bragg angle and k is a constant [12]. Particle morphology was examined by transmission electron microscopy (TEM) (Philips, EM400) at the Petroleum Centre of Research (PCR) (Cairo, Egypt), and magnetic measurements were performed on a vibrating sample magnetometer (VSM, model 7310, Lake Shore) at the Agricultural Centre of Research (ACR) (Giza, Egypt).
3. Rietveld Analysis of the Experimental Data [9–11]
3.1. Method of Analysis
- In the present study, we have adopted the Rietveld’s powder structure refinement analysis [9-11] of X-ray powder diffraction data to obtain the refined structural parameters, such as (lattice parameters, atomic coordinates, occupancies, and thermal parameters), and microstructural parameters, such as (crystallite size and r.m.s. lattice strain). For instrumental broadening correction, a specially processed laB6 standard [12] was used. The Rietveld’s software Fullprof (October, 2009) which is designed to refine simultaneously both the structural and microstructural parameters (crystallite size and lattice strain). The shape of the peaks in the experimental diffraction patterns are described by an asymmetric pseudo-Voigt (pV) function. To simulate the theoretical X-ray powder diffraction patterns of the two polymorphic modifications of lithium ferrite, the following considerations for the different phases were addressed:1. Identification of the phases by computer search-match through comparing the experimental pattern with known compounds in the International Centre for Diffraction Data (ICDD) database.2. Indexing the diffraction pattern to determine the crystal system, unit cell dimensions and space group.
3.2. Crystal Structure Refinement
- A detailed account of the mathematical procedures implemented in the Rietveld analysis has been reported elsewhere [13–19]. Here, we give a brief, step-by-step description of the analysis of the experimental powder diffraction patterns that we have performed in this study. First, the positions of the peaks were corrected for zero-shift error by successive refinements. Considering the integrated intensity of the peaks to be a function of the refined structural parameters, the Marquardt least-squares procedure was adopted for minimizing the difference between the observed and simulated powder diffraction patterns. The progress of the minimization was monitored through the usual reliability parameters, Rwp (weighted residual factor), and Rexp (expected residual factor), defined as
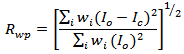
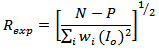 where Io and Ic are the experimental and calculated intensities, respectively, wi = 1/Io are weight factors, N is the number of experimental observations and P is the number of refined parameters. We also used the goodness of fit (GoF) factor [16–20]:
 Refinements were carried out until convergence was reached and the value of the GoF factor approached 1 (the final GoF usually varies from 1.1 to 1.8). We used the simple relationship [16–19] between the individual scale factor of a crystalline phase in a multiphase material and the phase concentration (weight fraction) in the mixture, to obtain the weight fraction (wi) for each phase, as follows:
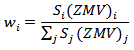 where Sj is the refined scale factor of phase i, Z the number of formula units per unit cell, M the atomic weight of the formula unit and V is the volume of the unit cell.
3.3. Microstructural Analysis
- It is well established that the observed broadening of diffraction peaks is mainly due to small crystallite size and the presence of root mean square (r.m.s.) strain inside the crystallites. The crystallite size and strain broadening can be approximated with Cauchy and Gaussian type functions, respectively [16–19]. Thus, the basic consideration of the method employed in the Rietveld analysis and by us is the modelling of the diffraction profiles with an analytical function, which is a combination of Cauchy and Gaussian type functions, as well as another function taking into account the asymmetry in the diffraction profile. Again, the process of successive profile refinements was adopted to refine the crystallite size and strain in the studied materials. The refinement was continued until convergence was reached and the value of GoF approached 1.
4. Results and Discussion
4.1. XRD Diffractographs Analysis
- The XRD patterns of polycrystalline α-LiFe5O8 and β-LiFe5O8 prepared by the double sintering ceramic technique at 1000℃ for 5h are shown in Figure 1.
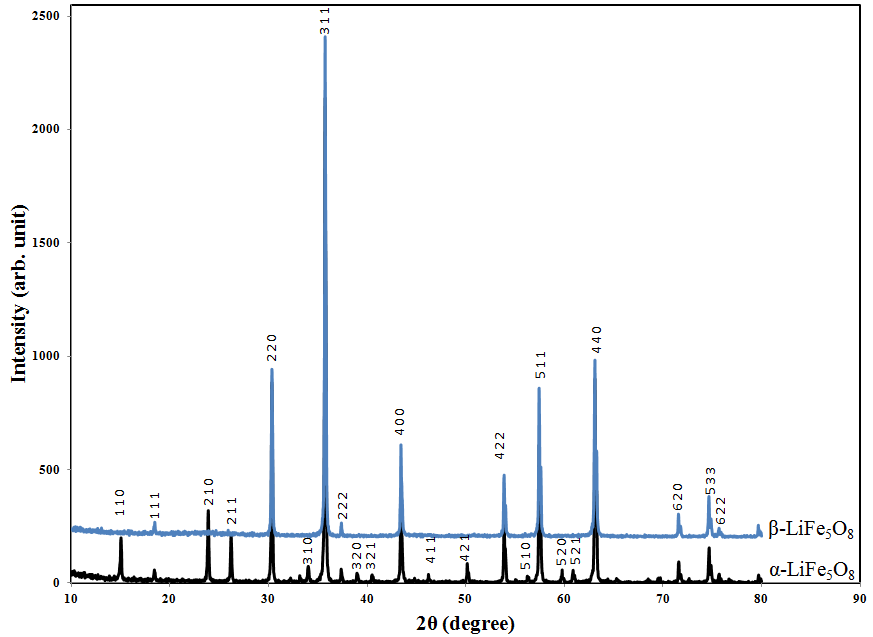 | Figure 1. X-ray diffraction pattern for the two polymorphic LiFe5O8 sintered at 1000℃ |
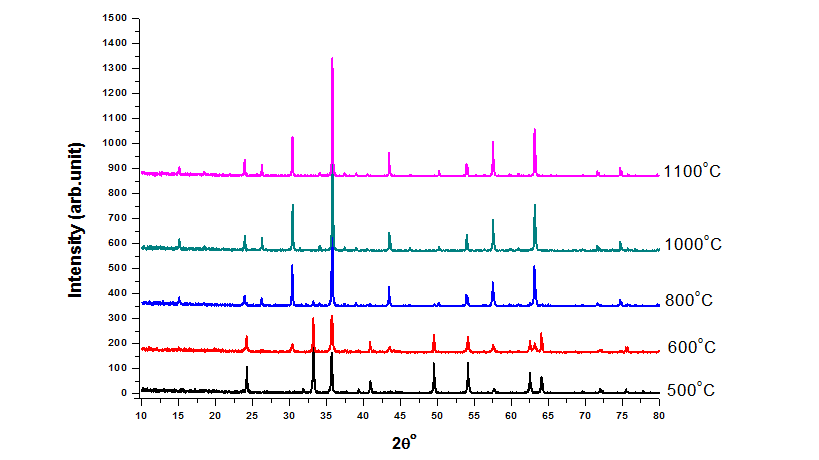 | Figure 2. X-ray diffraction of disordered LiFe5O8 after annealing at different temperatures |
4.2. Refinement of XRD Data
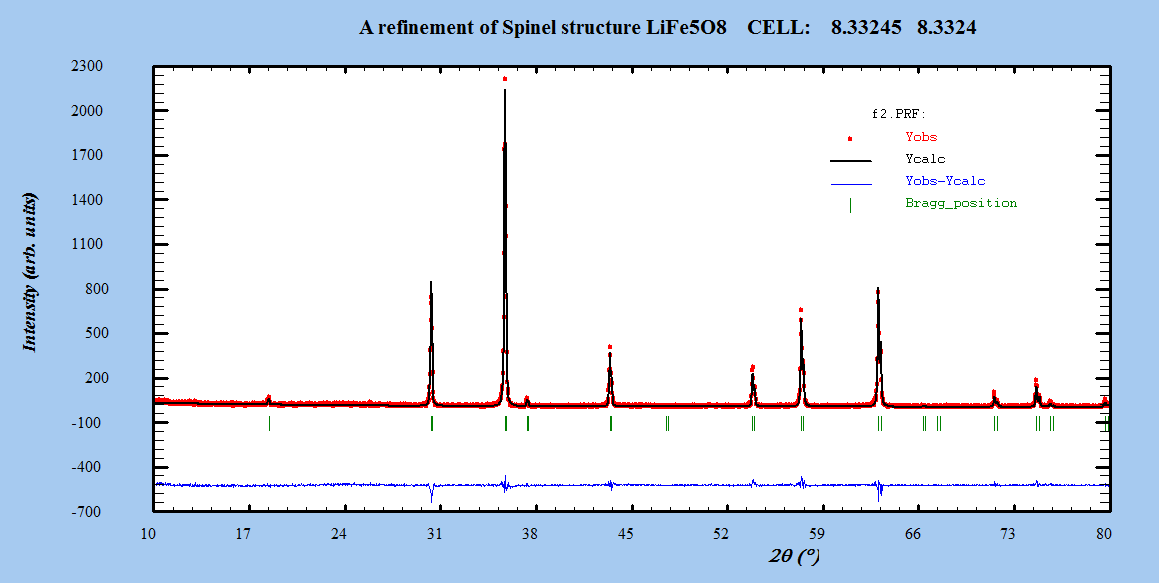
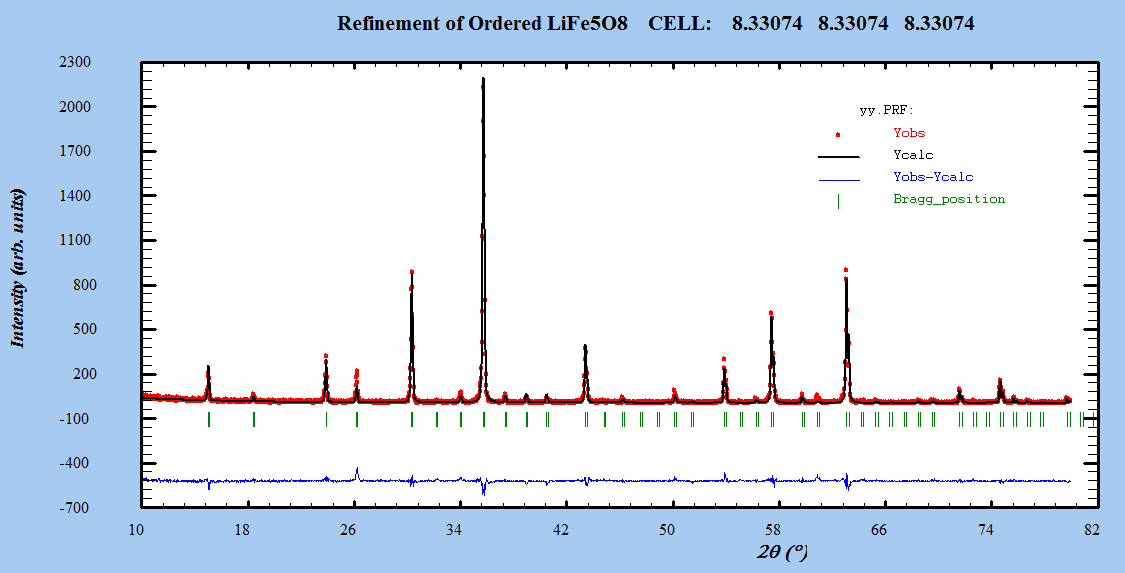
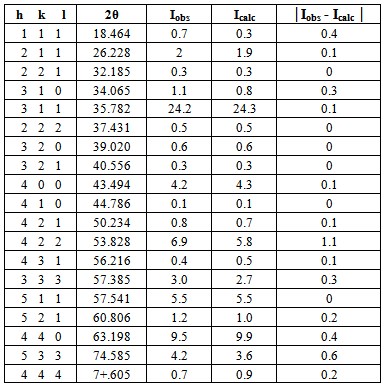
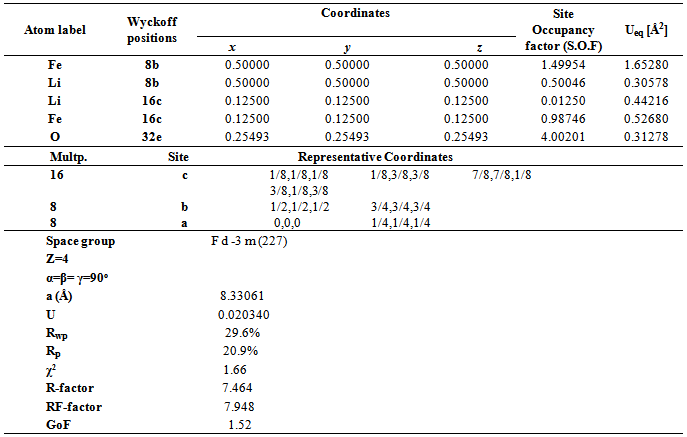
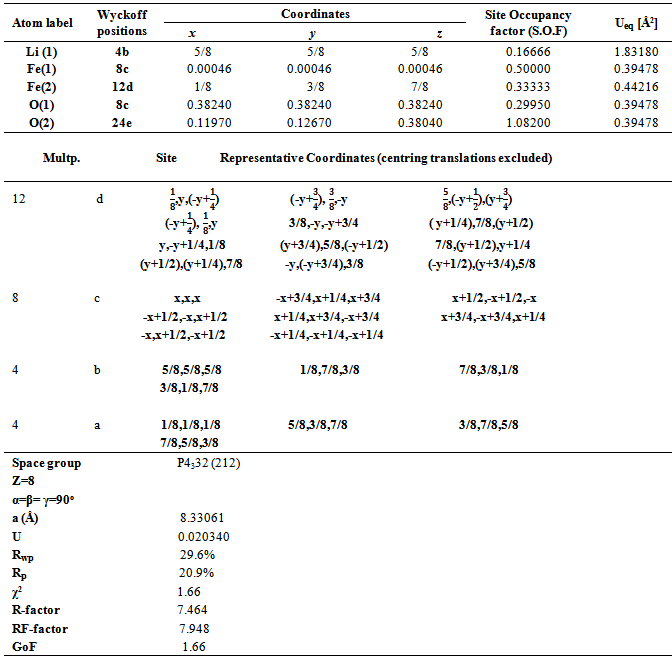
- The Fullprof Rietveld software was used for Rietveld XRD data analysis of LiFe5O8. Refinements were performed in space group: Fd-3m and P4332. Atomic scattering factor for fully ionized atoms Li1+, Fe3+, and O2- were taken from the International Table for Crystallography (Volume C, 1992).Starting cell parameters were taken from the results of the precedent section and the oxygen parameter starting values were taken as the ideal atomic position of the ion O2- =0.25.In each refinement, a total of more than twenty parameters were refined: zero shift, scale factor, back ground coefficients, three lattice constants, asymmetry parameter, three oxygen parameters for isotropic temperature factor, and the parameter for the full width at half maximum.The Rietveld plots of the refinements for ceramic prepared systems for both α- LiFe5O8 and β-LiFe5O8 are shown in Figure 3. The observed intensity data, y, is plotted in the upper field as points. The calculated patterns are shown in the same field as a solid-line curve. The difference, observed minus calculated, is shown in the lower field. The short vertical bars in the middle field indicate the positions of possible Bragg reflections.
 | Figure 3(a). The profile fitting for β-LiFe5O8 nanoparticle |
 | Figure 3(b). The profile fitting for α-LiFe5O8 nanoparticles |
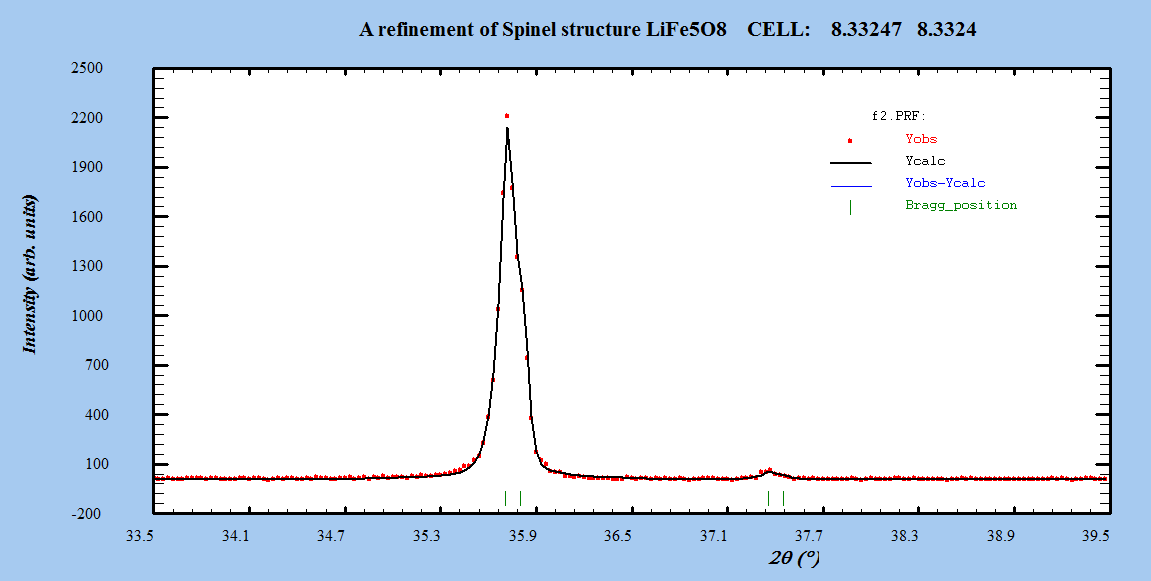 | Figure 4(a). Zoom out of a part of the pattern of the profile fitting for β-LiFe5O8 sintered at 1000℃ |
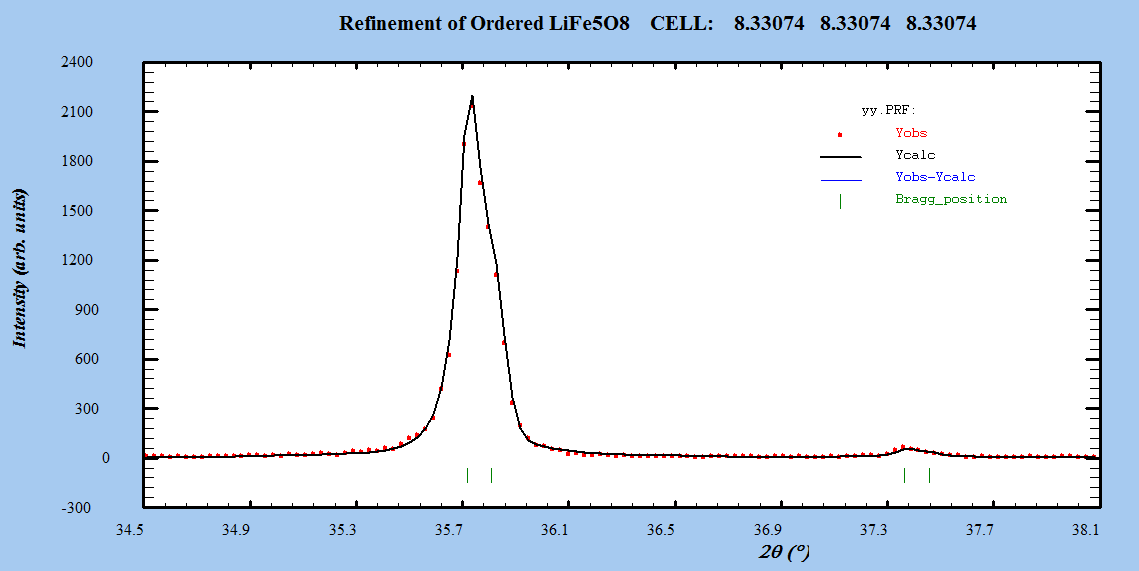 | Figure 4(b). Zoom out of a part of the pattern of the profile fitting for α-LiFe5O8 sintered at 1000℃ |
|
|

|
|
4.2.1. Cations Distribution
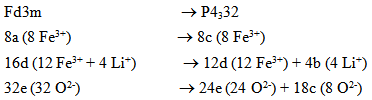
- As mentioned earlier, spinel-type lithium ferrite, LiFe5O8, is known to occur in two crystalline forms. In the ordered form (space group P4132/P4332) the Fe3+ ions are at octahedral 12d and tetrahedral 8c sites, and Li+ ions occupy only the octahedral 4b positions in the cubic primitive unit cell. The disordered LiFe5O8 has an inverse spinel structure (space group Fd-3m), with Fe3+ at tetrahedral 8a positions and Li+ and Fe3+ randomly distributed over the 16d octahedral sites. The order-disorder transition in the lithium ferrite structure may be recorded by XRD. Relations between the (Fd3m) and (P4332) Wyckoff’s positions are as follows [21]:
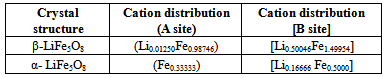
 It is well known that the magnetic properties of spinel ferrites depend on the summation of the magnetic moments at A- and B-sites [22]. It has also been experimentally verified that the distribution of cations among the lattice sites depends on the material preparation. This often leads to a variation in the unit cell dimensions. Both variations are seen as broadening and/or shift of the diffraction lines. Various techniques have been applied to characterize the spinel ferrites in order to understand their intrinsic magnetic properties. Profile fitting by Rietveld analysis is the most widely used method to determine the site occupation factors (S.O.F.). All these effects may be accounted for by analysis of the peak profiles in the powder diffraction pattern. Cation distributions on A-site and B-site for lithium ferrite are shown in Table 5. The refinement results show that the nanocrystalline ferrite phase is partially an inverse spinel. The information of mixed spinel instead of inverse spinel may result due to the decrease in the occupancy of Fe3+ cation on the A-site during the formation of spinel ferrite. At the same time, the occupancy of Li1+ cation on the B-site decreases and then increases on the A-site. This occurs when there is a random distribution of cations among the A- and B-sites inside the spinel matrix. All these effects may be responsible for variations of the peak profiles in the power diffraction pattern. Cations distribution on A-site and B-site for disordered and ordered systems prepared by ceramic technique is shown in Table 5.
|
4.2.2. The Inter-Atomic Distances and the Inter-Bond Angles
- It is possible to calculate the inter-atomic distance between the cations on the tetrahedral A- and the octahedral B-sites with the help of the following relations [23]:
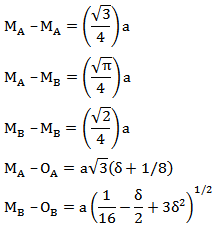 while OA and OB refer to the centre of an oxygen anion, related to the tetrahedral (A) and the octahedral (B) configuration, respectively. δ is the deviation from the oxygen parameter (U), δ = U – Uideal [24].These parameters are necessary to give a full description of the crystallography structure, and are of interest in connection with the magnetic properties. The calculated values of the inter-atomic distances and the inter-bond values for nanocrystalline LiFe5O8 are listed in Table 6.
|

4.2.3. Microstructure Analysis
- The aim of this analysis was to characterize the material in terms of microstructural parameters such as crystallite size and r.m.s. lattice strain. The average crystallite size and lattice strain are shown in Table 7.
|

4.3. Transmission Electron Microscopy
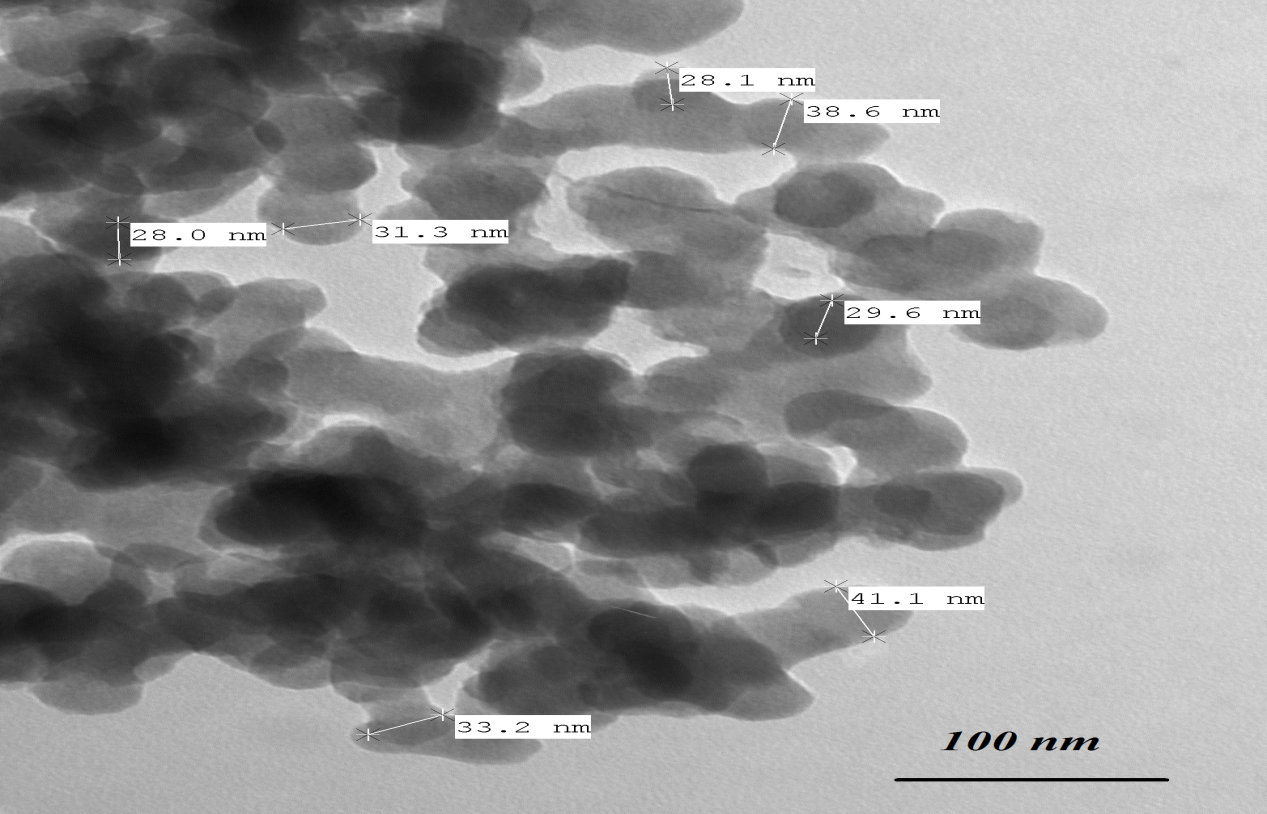
- TEM is considered the main method for characterizing the microstructure of nanocrystalline materials (the particle size and shape of the particles) [25]. High-energy milling of prepared bulk LiFe5O8 with an average grain size exceeding 100 nm leads to the reduction of its particle size to the nanometres scale. Figure 5 shows TEM micrograph of the nanocrystalline α- LiFe5O8 powder, consisting of particles mostly in the 22-38 nm size range which is nearly close to the X-ray crystallite size. On the other hand, Figure 6 shows a TEM micrograph of the nanocrystalline β- LiFe5O8 powder, consisting of particles mostly in the 32-57 nm size range which is nearly close to the X-ray crystallite size. TEM micrograph shows that the resultant nanospheres are solid like balls. Very small amounts of samples placed on the carbon grid show spherical particles of ~100 nm size, and suspended particles on the carbon grid show well separated particles of size ~10-80 nm. β-LiFe5O8 samples annealed at 1000℃ show that the particle size increases with increasing the annealing temperature. Some of the particles are quite bigger, the mechanism based on the lithium ferrite nanoparticles self-growth process is proposed in the formation of the nanospheres. The non-uniform particles size distribution may be attributed to a non-uniform ingredient mixture and a non-uniform grain distribution of the powder.
 | Figure 5. TEM micrograph for ordered LiFe5O8 |
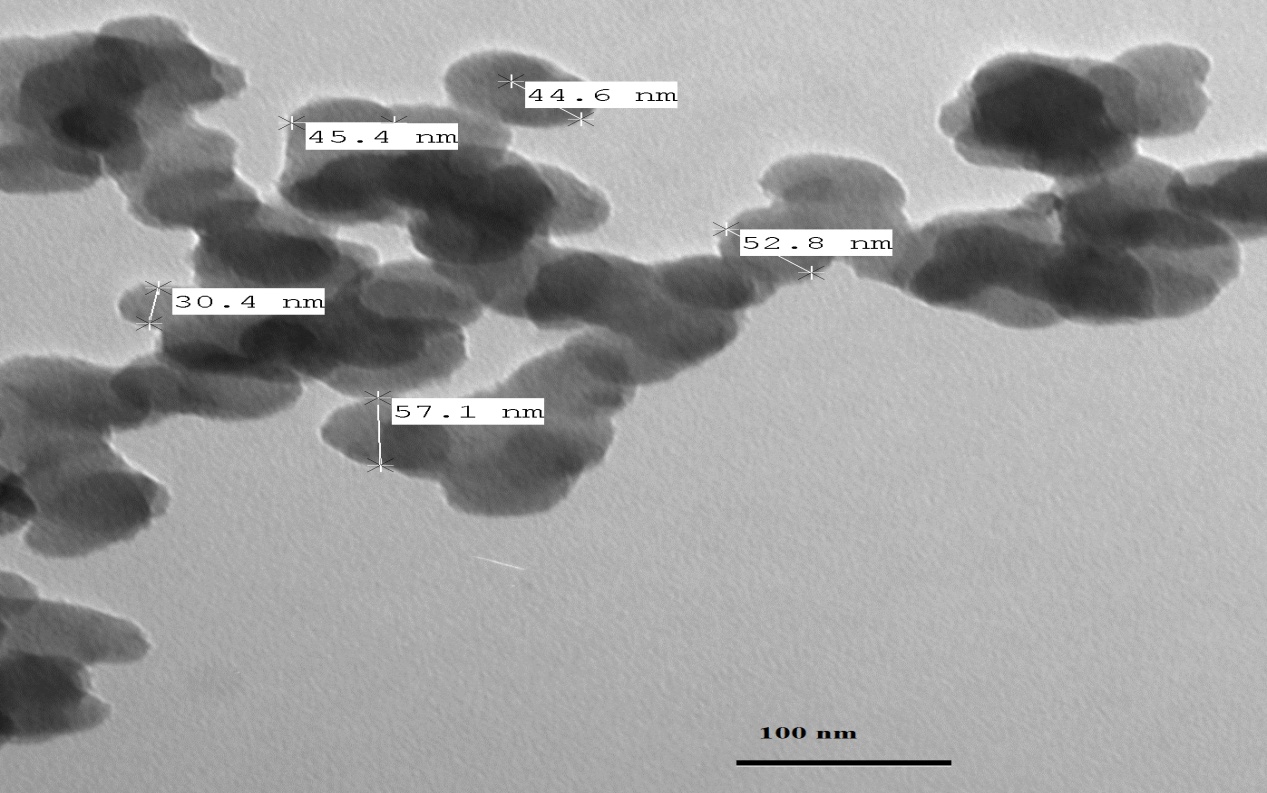 | Figure 6. TEM micrograph for disordered LiFe5O8 |
4.4. Magnetic Measurements
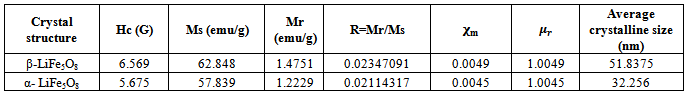
- Vibrating Sample Magnetometry (VSM)The magnetic hysteresis loops were identified and characterized to determine parameters, such as the saturation magnetization (Ms), remnant magnetization (Mr) and coercivity (Hc). The magnetic properties of powders have been determined at room temperature using a vibrating sample magnetometer in the maximum external field of 20 KOe.The hysteresis loops for the nanocrystalline LiFe5O8 ferrite prepared by ceramic technique are shown in Figure 7. The hysteresis loop for the nanocrystalline lithium ferrite samples show superparamagnetic behaviour, with value of magnetic susceptibility ~0.0045-0.0049; the difference in the saturation magnetization is due to the difference in cation distribution at the tetrahedral and octahedral sites [26]. Since HC is very small and approaches zero compared to the applied field, the samples obtained for the polymorphous systems exhibit no hysteresis, which may be attributed to superparamagnetic relaxation as confirmed by XRD. Magnetization of the polymorphous system Li0.5Fe2.5O4 decreases monotonically with raising temperature, as shown in Figure 8. The Curie temperature of the pure Li0.5Fe2.5O4 is equal to 900 K. The decreases in magnetization and Curie temperature are caused by structural and magnetic disorders in the spin-like surface layer of nanograins. Moreover, these decreases are due to the exchange coupling between the surface and the bulk magnetic moment.
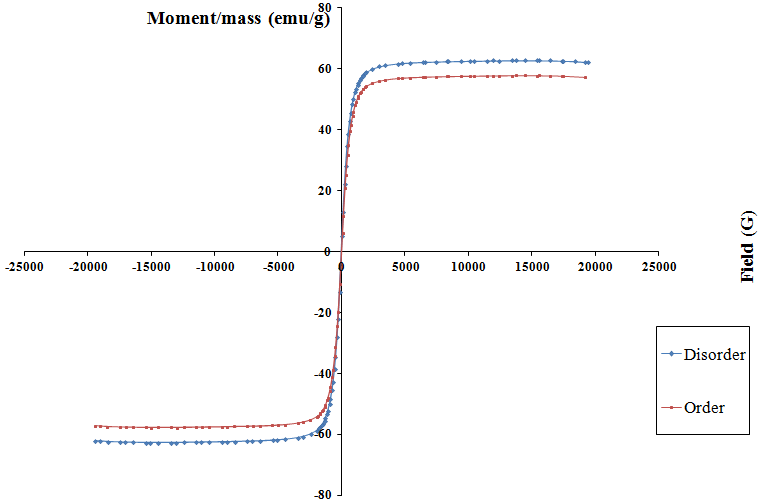 | Figure 7. Superparamagnetism in the two polymorphous LiFe5O8 |
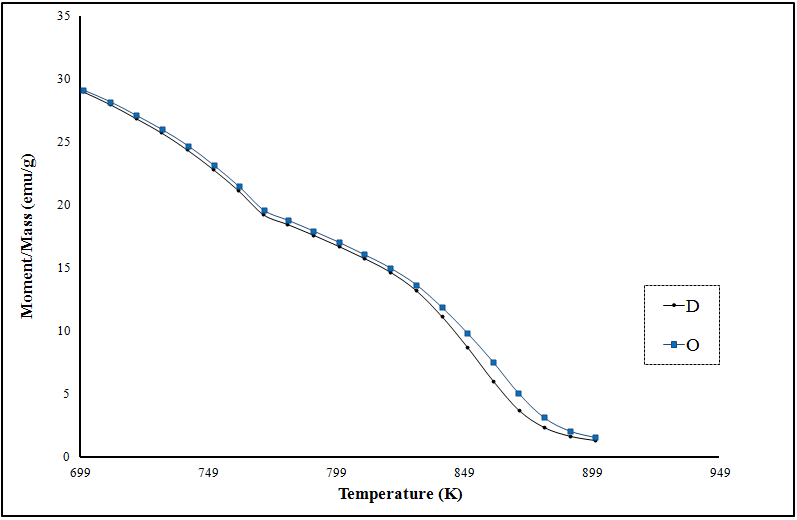 | Figure 8. Temperature variation of magnetization for the two polymorphous LiFe5O8 |
|
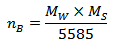 Where Mw is the molecular weight of the composition.According to the Neel’s two sublattice model of ferrimagnetism, the calculated magnetic moment (nB Cal.) per unit formula in μB,
  is expressed as
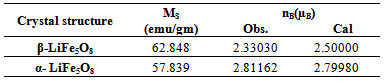
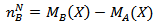 where MB and MA are the B- and A- sublattice magnetic moment in µB respectively. The nBN(x) value was calculated using the ionic magnetic moments of Fe3+ and Li+ which are 5 µB and 0 µB respectively. The calculated value (5 µB) clearly indicates the inverse spinel structure for α- LiFe5O8 with lithium and three fifth of the total Fe3+ occupying the octahedral sites and two fifth occupying the tetrahedral sites. The values of calculated and observed magnetic moment for the polymorph LiFe5O8 displayed in table (9).
|
5. Conclusions
- The conventional way of preparing the polycrystalline ferrite is by solid-state reaction (ceramic method), which involves the mixing of oxides with intermittent grinding followed by high temperature sintering at 1000oC has been successfully used for the preparation of mixed nanosize spinel ferrites.The refinement result showed that the nanocrystalline ferrite phase is partially an inverse spinel. This may be explained by the random distribution of cations among the A- and B-sites inside the spinel matrix.TEM revealed that the grains of the sample are spherical in shape and have average particle sizes, which were found quite similar to the crystallite size observed on XRD. However, some of the particles are quite bigger, due to a self-growth process of the lithium ferrite nanoparticles in the formation of the nanospheres. The non-uniform particles size distribution can be attributed to a non-uniform ingredient mixture and a non-uniform grain distribution of powder.Hysteresis loops were measured to determine Ms, Mr, and Hc. From these measurements we found that the magnetic properties of the samples clearly depend on the size of the nanocrystallites. In addition, the magnetic properties of spinel ferrite are strongly dependent on the distribution of the different cations among A- and B-sites. Moreover, the decrease in Ms can be attributed to decrease of the mean size of the nanocrystallites. Hc is size dependent.Our results for the two polymorphs LiFe5O8 prepared samples show that the HC is very small and approaches zero compared to the applied field, the prepared samples for the two polymorphs exhibits no hysteresis, which may be attributed to superparamagnetic relaxation as confirmed by XRD.