-
Paper Information
- Paper Submission
-
Journal Information
- About This Journal
- Editorial Board
- Current Issue
- Archive
- Author Guidelines
- Contact Us
American Journal of Materials Science
p-ISSN: 2162-9382 e-ISSN: 2162-8424
2014; 4(2): 64-73
doi:10.5923/j.materials.20140402.03
Surfactant Assisted Synthesis of Copper Oxide (CuO) Leaf-like Nanostructures for Electrochemical Applications
 Abstract
 Reference
 Full-Text PDF
 Full-text HTML
A. Bello 1, D. Dodoo-Arhin 1, 2, K. Makgopa 3, M. Fabiane 1, N. Manyala 1
1Department of Physics, SARCHI Chair in Carbon Technology and Materials, University of Pretoria, Pretoria 0028, South Africa
2Department of Material Science and Engineering, University of Ghana, Legon-Accra, Ghana
3Department of Chemistry, University of Pretoria, Pretoria 0002, South Africa
Correspondence to: D. Dodoo-Arhin , Department of Material Science and Engineering, University of Ghana, Legon-Accra, Ghana.
| Email: |  |
Copyright © 2014 Scientific & Academic Publishing. All Rights Reserved.
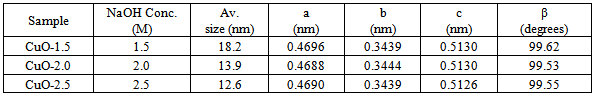
Three different copper oxide (CuO) leaf-like nanostructures have been synthesised by micelles micro emulsion method using a surfactant of copper dodecyl sulphate (Cu(DS)2) by varying the concentration of sodium hydroxide (NaOH). This study was carried out to investigate the effect of NaOH concentration on the stability, crystalline domain and pseudocapacitance behaviour of the leaf-like nanostructures. The samples were characterized by X-ray diffraction (XRD), thermogravimetry analysis (TGA), Raman spectroscopy, Fourier-Transform Infrared (FTIR), scanning electron microscopy (SEM) and Transmission electron microscopy (TEM). It was observed that the crystalline domain size (12 nm-18 nm) and size distribution of the as-synthesized nanocrystals decreases with increasing concentration of NaOH. The interactions mechanism and formation of the leaf-like structure have been elucidated and correlated with various analytical techniques. The domain size and NaOH concentration tend to influence the charge transfer resistance.
Keywords: Chemical synthesis, Nanostructures, Powder diffraction, Semiconductors
Cite this paper: A. Bello , D. Dodoo-Arhin , K. Makgopa , M. Fabiane , N. Manyala , Surfactant Assisted Synthesis of Copper Oxide (CuO) Leaf-like Nanostructures for Electrochemical Applications, American Journal of Materials Science, Vol. 4 No. 2, 2014, pp. 64-73. doi: 10.5923/j.materials.20140402.03.
Article Outline
1. Introduction
- In recent years, nanostructured semiconducting materials have stimulated intensive research activities due to their exceptional properties arising from their high surface/ volume ratio and nanoscale quantum confinement effects. Copper oxides are useful reference systems for the study of complex cuprates, most of which show high-temperature superconductivity (high-Tc). This phenomenon has been attributed to a Jahn-Teller distortion in a symmetric divalent copper monoxide structure which introduces a strong electron-phonon interaction leading to the superconductivity [1, 2]. Amongst the mono oxides of 3d transition series, cupric oxide (CuO) is unique due to it planar square coordination in a monoclinic structure. The copper forms four coplanar bonds with oxygen which itself is coordinated by four copper atoms in a distorted tetrahedral environment. The monoclinic (space group:
 , 15) possesses four units formula in its crystallographic unit cell with lattice constants of a=0.46837 nm, b=0.34226 nm, c=0.51288 nm, β=99.54º. The positions of the atoms in the cell are: Cu(4c): 1:
  , 2:
, 2:  ; O(4e): 3:
  , 4:
, 4:  , where y=0.4184; with equivalent positions of (0,0,0) and
  . The three dimensional crystal structure of the CuO is built from the two sets of chains
  directed along [110] and staggered along [001] [3, 4]. CuO is p-type semiconductor with narrow and indirect energy band-gap of 1.2-1.8 eV, [5, 6]; has attracted a lot of research interest due to its unique properties such as high catalytic activity, easy synthesis route, environmentally friendly nature and variable morphologies at the nanoscale. It has found applications in electrochemistry as electrode material for lithium-ion batteries and electrochemical capacitors, solar energy systems, heterogeneous catalysts and selective gas sensors [7, 8].Several strategies have been used for production of CuO nanostructures with different morphologies [9–12]. Structures such nanobelts [13], nanowires, nanorods, nanotubes [14–18], nanoribbon [19, 20], nanoplatlete [21] dumbbell [22] and nanoparticles [16]. The morphologies of CuO nanostructures have been shown to have effects on the optical, semiconducting, and piezoelectric properties. The different procedures used for the production of CuO nanostructure include sonochemical deposition [23], high temperature synthesis [24], chemical vapour deposition [25], double-jet precipitation [26], microemulsion synthesis [27] etc. Microemulsion is a self-assembly technique driven by factors such as surface tension, capillary effects, electric and magnetic forces, and hydrophobic-hydrophilic interactions. It is known to be an effective approach to forming a wide variety of motifs, otherwise impossible under equilibrium conditions [28]. The fundamental challenge with this technique is the accurate control over the final CuO nanostructures with specific uniform morphologies. Hence, a good analytical technique to characterize the size and size distribution of the crystalline domains is very important. Techniques such as TEM and XRD usually consider the average size and are limited to the analysis of a determinate number of particles. The state of the art alternative is the analysis of the XRD data by full pattern methods such as the Whole Powder Pattern Modelling (WPPM) [29], that allows interpretation of the whole diffraction pattern in terms of physical models for the broadening sources (instrumental and sample) directly refined on the experimental data, with no arbitrary assumptions on the diffraction patterns.In this work, we present results of a thermal and surfactant assisted self-assembly synthesis of copper oxide leaf-like nanostructure. The obtained nanocrystals have been characterized by XRD, SEM, TEM, FTIR, and Raman spectroscopy. The resulting CuO samples were investigated as a potential electrode material for electrochemical applications.
 2. Experimental
2.1. Materials and Chemicals
- Copper chloride dihydrate (CuCl2•2H2O, Merck 97 %), ethanol (purity Merck 98 %), sodium hydroxide (NaOH, Merck 98 %) anionic surfactant (sodium dodecyl sulphate SDS, Sigma Aldrich) were used as CuO precursors. All chemicals were used as received. Deionized water was used throughout the preparations.
2.2. CuO Synthesis
- A stable stock solution of 8.0 mM copper dodecyl sulphate (Cu(DS)2) was prepared by mixing sodium dodecyl sulphate surfactant (SDS) and copper chloride dihydrate (CuCl2•2H2O) flakes/crystals in a beaker containing 40 ml of deionized water and stirred for about 10 minutes at 50ºC to ensure complete dissolution. The final solution was filtered to separate any filtrate residue. This dark greenish-blue solution serves as source (Cu2+) for synthesis of CuO [7].In a typical synthesis, three batches of 40 ml solution each were made in a 80 ml graduated borosilicate glass bottle, closed with a polypropylene cap (to limit evaporation) by adding 1 ml of the Cu(DS)2 aqueous stock solution into a 37 ml deionized water; leads to the formation of a homogeneous and transparent sky-blue microemulsion without any form of precipitate. Afterwards, 2 ml of variable aliquots (1.5 M, 2.0 M and 2.5 M, according to Table 1) of NaOH solution was added to the dispersion under constant magnetic stirring leading to a deep blue solution without precipitation. The mixture was then heated at 80°C under constant magnetic stirring at 200 rpm for 4 hours. The mixture gradually turned into a dark brown-black precipitate which was cooled and later centrifuged at 6000 rpm for 10 minutes to separate the particles from the suspension.
|
2.3. Characterizations
- X-ray diffraction (XRD) patterns of the sample were collected on an XPERT-PRO diffractometer (PANalytical BV, Netherlands) with theta/theta geometry, operating a cobalt tube at 35 kV and 50 mA. The goniometer is equipped with automatic divergence Slit and a PW3064 spinner stage. The instrumental resolution function was characterized with the NIST SRM 660a (LaB6) standard. All peak profiles of the LaB6 phase were simultaneously fitted with symmetrical pseudo-Voigt functions whose width and shape were constrained according to the Caglioti et al. formulae [30]. The XRD patterns of all specimens were recorded in the 40.0°- 80° 2θ range with a step size of 0.017° and a counting time of 15.240 second per step. Qualitative phase analysis of samples was conducted using the X’pert Highscore Plus search match software. Microstructural analysis of the data was implemented by employing the Whole Powder Pattern Modelling (WPPM) method [29], incorporated in the PM2K software [31].Fourier-Transform Infrared (FTIR) spectra were recorded on a Vertex 70v (Bruker) spectrometer in the 4000-400 cm-1 range with 4 cm-1 resolution. Spectra were recorded and analysed with the Opus software. Raman spectroscopy data were collected on a Jobin Yvon Horiba TX 6400 micro-Raman spectrometer equipped with a triple monochromator system and LabSpec (Ver. 5.78.24) analytical software. All the samples were analysed with a 514 nm Argon excitation laser through an X 50 objective with acquisition time of 120 seconds and a resolution of 2 cm-1. A high resolution Zeiss Ultra plus 55 scanning electron microscope (SEM) operated at 2.0 KV was used for surface morphological investigations of the as-produced particles. Further microstructure analysis was made on a JEOL JEM-2100F transmission electron microscope (TEM) operated at 200 KV. Standard DSC-TGA experiment was performed on a SDT Q600 (V20.9 Build 20) instrument. The samples were place in an alumina crucible and heated in air at a temperature rate of 10ºC/minute from room temperature to 800ºC. Finally electrochemical measurements cyclic voltammetry (CV), galvanostatic charge-discharge (CD) and electrochemical impedance spectroscopy (EIS) were performed using an Autolab PGSTAT 302 workstation (ECO-CHEMIE) driven by a GPES software. The CuO paste on a nickel foam served as the working electrode, glassy carbon plate as the counter electrode, Ag/AgCl (3 M KCl) served as the reference electrode and 2 M KOH aqueous electrolyte was used.
3. Results and Discussion
3.1. Synthesis Reaction Mechanism
- In aqueous solution, CuCl2 dissociates into [Cu(H2O)6]2+ ions (responsible for the sky blue colouring) and Cl- anions: will partially coordinate with copper ions In [Cu(H2O)6]2+, the six water molecules completely surround the Cu2+ ion, shielding it. The accessibility of the copper ion in this complex is highly favoured, as the coordination with water is weak [32]. At temperatures higher than room temperature, CuO can be formed through the following scheme [33]:
 | (1) |
 | (2) |
 and the other two water molecules are located on its axis. According to the anionic coordination polyhedra theoretical model [34, 35], cations exist in the form of complexes whose ligands are
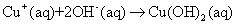
  ions in an aqueous solution: the complex whose coordination numbers are equal to that of the crystal, forms the growth unit. Moreover, the formation of growth units and the incorporation of the growth units into the crystal nucleus are induced by a dehydration reaction. In the SDS-Copper aqueous solution, the hydrophilic group of the surfactant points to the outer surface of the capsule surrounding the water pool, while the hydrophobic ends points inward due to the electrostatic interaction of the sulfonic groups of the SDS and the Cu2+ ions. The outer surface of the hydrophilic end is occupied by numerous Cu2+ ions. Upon addition of the varied concentrations of NaOH, the hydroxyl groups react to form dodecyl sulphate copper hydroxide ion
  nuclei which form active sites to generate DS[Cu(OH)2]n structures. Accordingly, the growth units for the CuO nanocrystals are therefore considered to be
  , which is a coordinating octahedron in the NaOH solution. In this case, four
  ions are arranged on a planar square, and the other two
  ions are located on a perpendicular axis.The binding energies of the two
  ions located on the octahedron axis are known to be lower than those
  groups located on the plane axis [36]. In view of this, the two
  ions located at the axis are easily replaced and dehydrated to form CuO nanocrystallites; hence the growth rate along the axes is higher than in the plane. The growth mechanism and formation of different shapes of CuO nanocrystals (e.g. nanorods, nanobelts, nanowires, etc) can therefore be explained with this difference in growth rates along various directions. The reaction temperature as in such synthesis can play an important role in the crystal growth process. In more detail, the reactions leading to the formation of CuO can be summarised into:
 | (3) |
 | (4) |
 | (5) |
 complex (produced when NaOH is added) might form hydrogen bonds by interconnection: the directional growth would then be inhibited, leading to the formation of irregularly shaped nanocrystals [37, 38]. However, at higher temperatures close to room temperature (T ≤ 25°C) only small quantities of hydrogen bonds are destroyed. The residual hydrogen bonds may still lead to the formation of structures with mixed morphologies. When the reaction temperature is increased (25°C < T < 100°C), there is a corresponding increase in the nucleation and growth rates as well as the destruction of more hydrogen bonds. In our case, the reaction temperature has been chosen to be 80°C to prevent evaporation of the water. Further investigation on the effect of reaction temperature and time on the particle size, size distribution, morphology and the surfactant breaking point boundary conditions of the SDS will lead to a better understanding of the growth mechanism of the as-produced CuO nanostructures. In the synthesis, reactions (3) and (4) take place within micelles of the microemulsion. The microemulsion droplets act as the nanoreactors to produce the dissolved DS-Cu(OH)2 nanocrystals. Based on its structural features and specific interactions of the Cu2+ ions with ligands in the solution, DS-Cu(OH)2 tends to form a wire-like structure. This structure has been shown to consist of oblate chains of Cu(OH)2 in the (001) planes and oriented along the [100] direction: a feature characteristic of the square-planar coordinated Cu2+ ions [39]. The surfactant molecules adhere to the surface of the final nanoparticles which serve as a protective layer to prevent fusion of the droplets as a result of collisions [40, 41]. These can be removed by washing with ethanol and deionised water.
3.2. X-Ray Diffraction Analysis and Electron Microscopy
- Figure 1a reveal that all the diffraction peaks can be indexed to the monoclinic CuO structure (JCPDS, file No. 80-1917) with negligible traces of residual Cu(OH)2 which could be due to reaction time. The broadening of the diffraction peaks suggests a nanometre scale crystalline domain size. Microstructure analysis was performed on the patterns using the Whole Powder Pattern Modelling approach, which directly connects a physical model for the microstructure with the diffraction pattern, allowing an extraction of microstructure parameters without recurring arbitrary peak shapes to fit each diffraction peak. Figure 1b shows the typical diffraction pattern of CuO-1.5 modelled using the WPPM. The modelling was carried out by assuming the presence of a lognormal distribution (figure1c) of aligned spherical domains. The almost featureless nature of the residual line figure 1b indicates a good agreement between experimental data and model which also suggests that the shape assumption is right for the domains investigated. The average crystallite size ranges from ∼8 nm (CuO-2.5) to∼16 nm (CuO-1.5): a clear correlation between domain size and NaOH concentration inside the micelles.
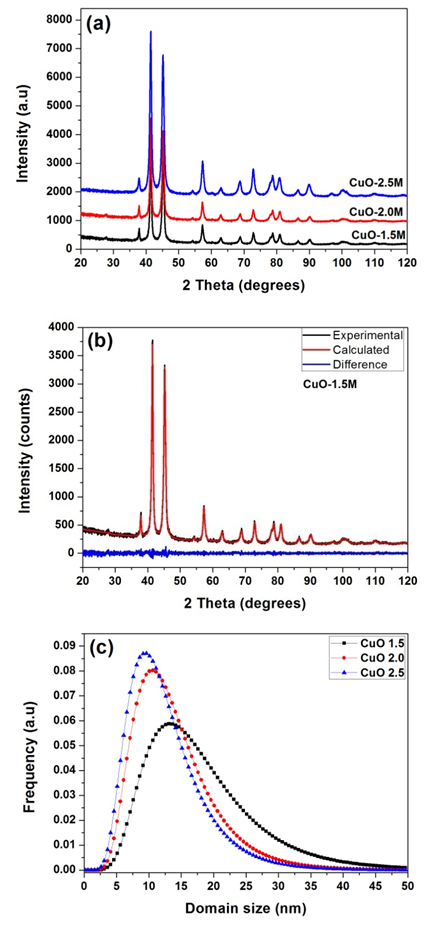 | Figure 1. (a) X-ray diffraction pattern of the as-synthesised CuO nanostructures. (b) CuO-1.5 modelled using the WPPM, and (c) lognormal distribution of aligned spherical domains |
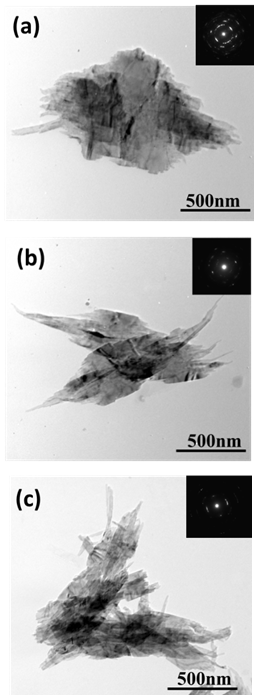 | Figure 2. (a-c) TEM images of CuO leaf-like nanostructures |
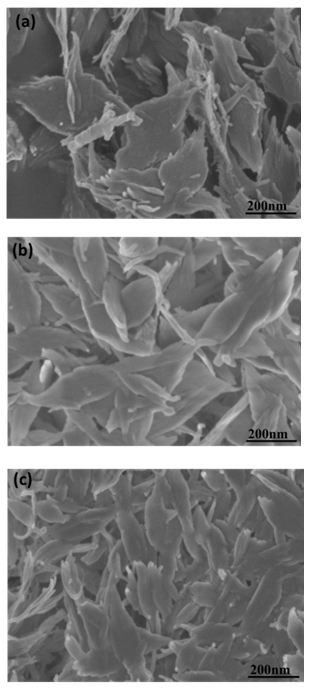 | Figure 3. SEM micrograph of the as-synthesised CuO leaf-like nanostructures |
3.3. ATR-FTIR and Raman Spectroscopy
- The representative FTIR spectra (figure 4a) of the synthesized CuO nanostructures (CuO-1.5) show three characteristic infrared peaks around 403, 508, and 602 cm-1 which could be attributed to the monoclinic structure of CuO [42]. The absorption bands at 602 cm-1 and 508 cm-1 are attributed to the Cu-O stretching along the direction, and the 403 cm-1 to the Cu-O stretching along [43]. No active bands from Cu2O or impurities were observed, thus, indicating the formation of pure CuO sample from FTIR study. There was no significant observation of shifts in the peaks with increase or decrease in crystallite domain size
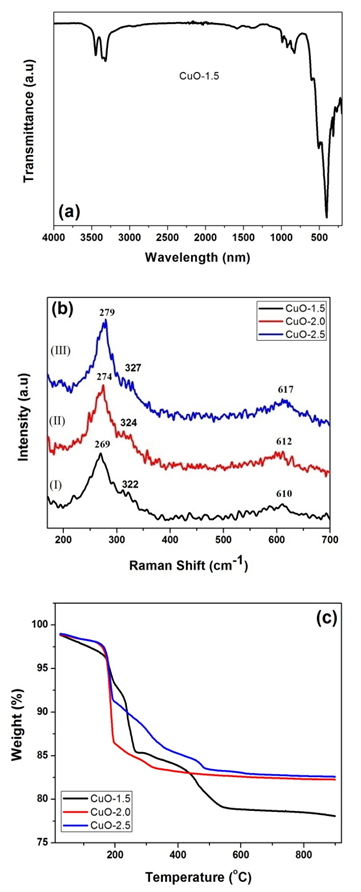 | Figure 4. (a) Representative FTIR spectrum (CuO-1.5), (b) Raman spectra and (c) thermal analysis of the as-synthesised CuO nanocrystals |
 is the natural full line width and C(0,φ) is the Fourier coefficient of the phonon confinement function.
 | (6) |
 | (7) |
3.4. Thermal Stability Analysis
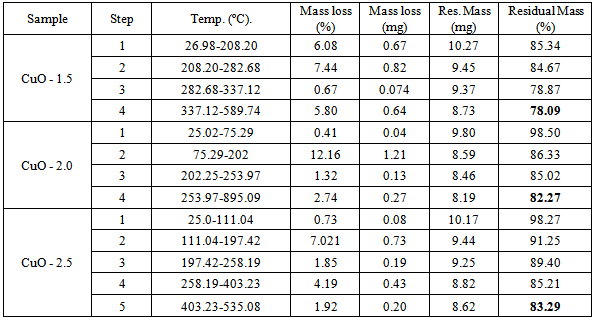
- The results of thermal analysis are presented in figure 4c and in Table 2.
|
3.5. Electrochemical Analysis
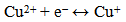
- To investigate the electrochemical behaviour of the as-prepared CuO leaf-like nanostructures as potential electrode material for electrochemical capacitors, cyclic voltammetry studies were performed on the samples. Figure 5 shows the CV curves of the three CuO samples measured at different scan rates of 10 mV s-1, 25 mV s-1, 50 mV s-1 and 75 mV s-1 in 2 M KOH aqueous solution. Electrochemical redox peaks are observed in the potential range from 0.1 V to 0.4 V. As observed, the CV current response of sample increases gradually with increasing scan rate, indicating reversible redox reaction taking place at the electrode material interface: all CVs show typical pseudocapacitance behaviour. Results also show two main peaks, a broad cathodic peak, and anodic peaks corresponding to redox peak of Cu2+/Cu. Storage mechanism in CuO have been proposed as follows. It is based on the intercalation/extraction of protons in the electrode that is oxidation/reduction of the electrode (surface adsorption and desorption of protons). When the CuO electrode is swept towards a negative potential, cathodic current flows according to Cu2+ ↔ Cu+1 reduction process while during a positive potential sweep, anodic current flows due to Cu1+↔Cu2+ oxidation process. The net redox reaction can be represented by equation 8.
 | (8) |
 | (9) |
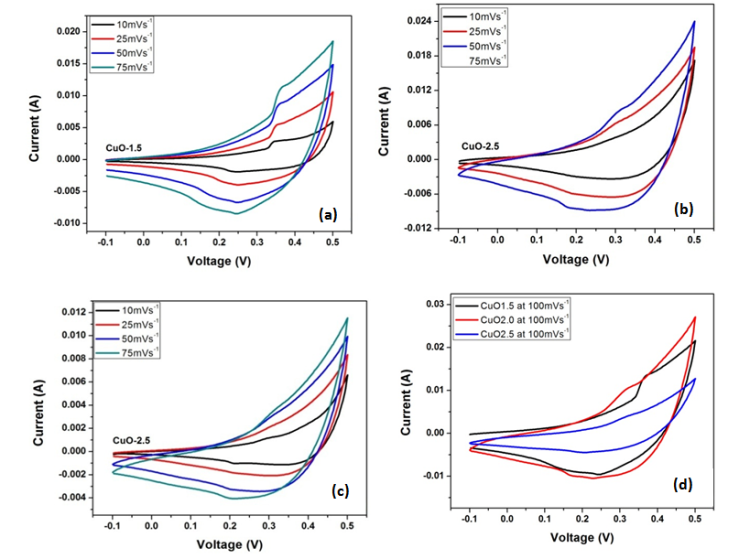 | Figure 5. CV curves measured at different scan rates of in 2 M KOH aqueous solution in 2 M KOH aqueous solution |
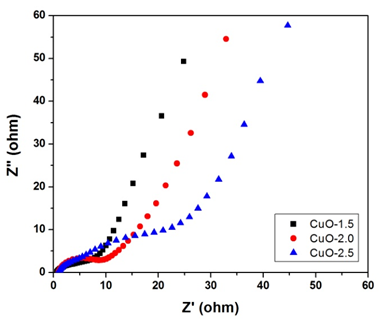 | Figure 6. Nyquist plot of the CuO based electrodes |
4. Conclusions
- Thermally mediated micellar microemulsion method has been employed to produce copper oxide (CuO) nano-leaf like structures using copper dodecyl sulphate (Cu(DS)2) as precursor and varying concentrations of sodium hydroxide (NaOH) for possible applications in electrochemical capacitors. XRD analysis using the whole powder pattern modelling routine reveals that the crystalline domain size (12 nm-18 nm) and lognormal size distribution decreases with increasing concentration of NaOH. The morphologies of the nanoleaf-like structures which are believed to consist of spherical particles aligned along rods have been studied via TEM and SEM. ATR-FTIR and Raman spectroscopic investigations coupled with XRD confirm the synthesis of the monoclinic CuO nanocrystals. The broadening effects observed via these characterisation techniques are consistent with nanometre scale particle size related to quantum confinement effect. A similar nano-grain size phenomenon was observed in the thermogravimetry analysis. Impedance spectroscopy analysis also shows that samples with highest concentration of NaOH have the least (~ 0.6 Ω) charge transfer resistance. This electrochemical performance can be attributed to the small particle size distribution resulting in a high surface to volume ratio. Thus this synthesis technique could be a promising approach for production of oxide nanostructures with small domain for energy storage applications.
ACKNOWLEDGEMENTS
- This work is based upon research supported by the South African Research Chairs Initiative of the Department of Science and Technology (DST) and the National Research Foundation (NRF). B. A. and DDA acknowledge the financial support from the University of Pretoria and NRF.