-
Paper Information
- Next Paper
- Previous Paper
- Paper Submission
-
Journal Information
- About This Journal
- Editorial Board
- Current Issue
- Archive
- Author Guidelines
- Contact Us
American Journal of Materials Science
p-ISSN: 2162-9382 e-ISSN: 2162-8424
2013; 3(4): 84-90
doi:10.5923/j.materials.20130304.04
Modelling the Crystal Structure of a 30 nm Sized Particle based Hydroxyapatite Powder Synthesised under the Influence of Ultrasound Irradiation from X-ray powder Diffraction Data
 Abstract
 Reference
 Full-Text PDF
 Full-text HTML
Ravi Krishna Brundavanam, Gérrard Eddy Jai Poinern, Derek Fawcett
Depart Murdoch Applied Nanotechnology Research Group, Department of Physics, Energy Studies and Nanotechnology, School of Engineering and Energy, Murdoch University, Murdoch, Western Australia 6150, Australia
Correspondence to: Gérrard Eddy Jai Poinern, Depart Murdoch Applied Nanotechnology Research Group, Department of Physics, Energy Studies and Nanotechnology, School of Engineering and Energy, Murdoch University, Murdoch, Western Australia 6150, Australia.
| Email: |  |
Copyright © 2012 Scientific & Academic Publishing. All Rights Reserved.
Hydroxyapatite (HAP) is a biocompatible ceramic that is widely used in a number of biomedical applications and devices. Due the close similarity between nanometer scale forms of HAP and the mineral phase found in the natural bone matrix, recent studies have focused on understanding the structure of HAP for its inclusion in a new generation of novel composites. In this study two commercially available software packages MaterialsStudioand Endeavour®1.7b were used to model the crystal structure of a nanometre scale HAP powder from X-ray powder diffraction data. The nanometre scale HAP used in this study was prepared via a wet precipitation technique under the influence of ultrasonic irradiation. The main reactants in this process were[Ca(NO3)2] and[KH2PO4], while[NH4OH] was used as the precipitator. During the process the calcium phosphate ratio was set at 1.67 and the pH was maintained at 9. The resultant slurries were then thermally treated in radiant tube furnace to produce nanometre scale particles with a mean diameter of 30 nm.
Keywords: Hydroxyapatite, Powder X-ray Diffraction, Crystal Structure Modelling
Cite this paper: Ravi Krishna Brundavanam, Gérrard Eddy Jai Poinern, Derek Fawcett, Modelling the Crystal Structure of a 30 nm Sized Particle based Hydroxyapatite Powder Synthesised under the Influence of Ultrasound Irradiation from X-ray powder Diffraction Data, American Journal of Materials Science, Vol. 3 No. 4, 2013, pp. 84-90. doi: 10.5923/j.materials.20130304.04.
Article Outline
1. Introduction
- The determination of the crystal structure of a new material is frequently the prerequisite for the rational understanding of the solid state properties of a material. Although single crystal X-ray diffraction is a useful technique for determining crystal and molecular structures, there are many solids that can only be prepared as microcrystalline powders and therefore cannot be studied using the single crystal diffraction technique. For these solids, it is necessary to use the powder diffraction technique and then analyse the resulting data to determine the materials structure. To achieve this goal, several analysis techniques have been developed to resolve the diffraction data since the publication of the original Rietveld method in 1969[1]. Generally, these analysis techniques generate a structural model ‘ab initio’ (i.e. without any knowledge of the structure) from a powder diffraction pattern using a Rietveld refinement technique [2-4].Analysis of powder diffraction data has attracted a great deal of interest and as a result, considerable progress has been made in developing new techniques that can be used to solve a variety of crystal structures. For example, using a direct-space structural solution technique it is possible to solve increasingly complex crystal structures directly from powder diffraction data[5]. Since the advent of the Rietveld refinement technique, determining the crystalline structure from powder diffraction data has proven to be an indispensable tool for characterising materials from X-ray diffraction data and as result, the technique is popular with crystallographers.Determination of the crystal structure begins with no prior knowledge of the structural arrangement of the atoms or molecules within the unit cell. The powder X-ray diffraction technique is used to obtain a diffraction pattern and subsequent analysis of the pattern produces an initial crystal structure. If the quality of the initial structure solution is reasonably good, then the Rietveld refinement technique can be directly used to obtain a high quality solution in the structural refinement stage of the analysis[6]. In general, the initial crystal structure solution obtained from the powder diffraction data is a greater challenge than the subsequent structural refinement stage. So the main emphasis in recent years has focused on the initial structure solution stage, since determining the initial crystal structure using powder diffraction data is not a straight forward procedure. The procedure is complex and generally involves six sequential steps: 1) data collection; 2) indexing; 3) unit cell refinement; 4) space group selection; 5) structure solution; and 6) Rietveld refinement. However, the main problem arises during the indexing step. Despite a wide range of indexing programs, the task is quite challenging especially if the quality of the data is low or impurities are present in the sample. A flowchart of the sequential six step procedure is presented in Figure 1.
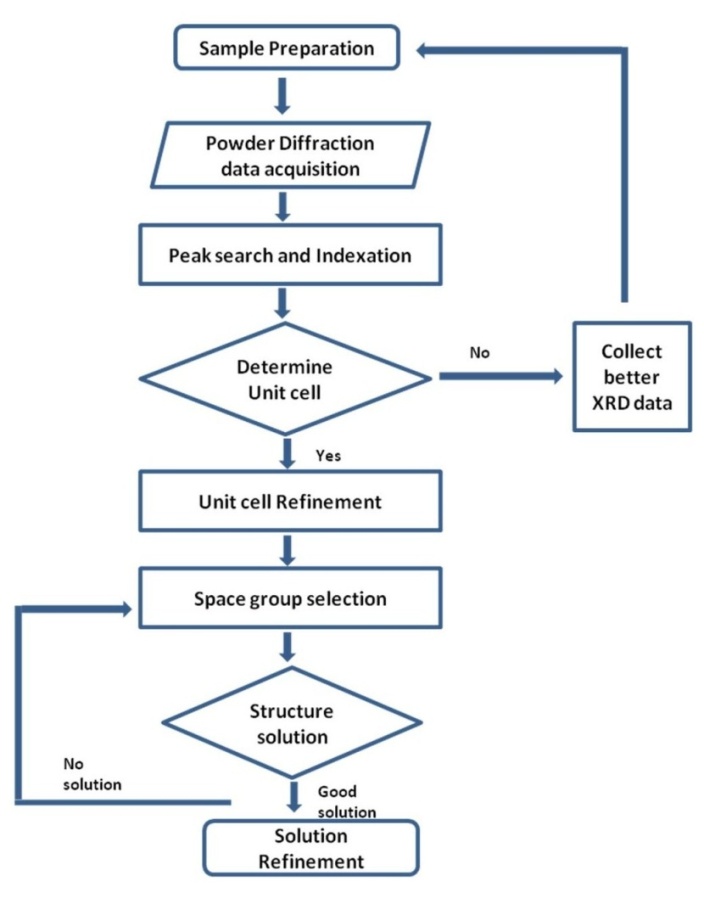 | Figure 1. Generalised flowchart of a typical procedure used to determine the crystal structure solution from X-ray powder diffraction data |
2. Materials and Methods
2.1. Materials
- The main reactants used to synthesis the nanometre sized HAP powders were calcium nitrate tetrahydrate [Ca(NO3)2.4H2O] and potassium di-hydrogen phosphate [KH2PO4], while the pH control of the solutions was achieved by the addition of ammonium hydroxide[NH4OH]. All analytical grade reagents used in this work were supplied by Chem-Supply (Australia). The solutions containing the reactants were synthesised under the influence of ultrasound irradiation, which was provided by an UP50H Ultrasound Processor[50 W, 30 kHz, MS7 Sonotrode (7mm diameter, 80 mm length)] supplied by Hielscher Ultrasound Technology. All aqueous solutions used throughout this study were made using Milli-Q® water (18.3 MΩ cm-1) produced by an ultrapure water system (Barnstead Ultrapure Water System D11931; Thermo Scientific, Dubuque, IA).
2.2. Synthesis of n-HAP Powders
- The procedure for producing the nanometre sized HAP powder begins with adding a 40 mL solution of 0.32M calcium nitrate tetrahydrate into a small glass beaker. The pH of the solution was then adjusted to 9.0 by slowly adding and mixing approximately 2.5 mL of ammonium hydroxide. The resulting solution was then exposed to ultrasonic irradiation for 1 h, with the processor set to 50 W and maximum amplitude. At the end of the first hour a 60 mL solution of 0.19 M potassium di-hydrogen phosphate was then slowly added drop-wise into the first solution while undergoing a second hour of ultrasonic irradiation. During the second hour the Calcium:Phosphate[Ca:P] ratio was maintained at 1.67, while the pH of the solution was checked and maintained at 9.0. At the end of the second hour, the solution was then filtered using centrifugation (15,000 g) for 20 minutes at room temperature, the resultant white precipitate sample was then placed into a fused silica crucible. The crucible was then placed into a tube furnace and thermally treated at 400 ˚C for 2 h. At the end of the thermal treatment the sample ended up as a white agglomerated mass. Once cooled, the sample was ball milled to break up the agglomerations and produce an ultrafine nanometre sized HAP powder, see schematic procedure presented in Figure 2. This synthesis procedure is repeated until a sufficient amount of the nanometre sized HAP powder was available for X-ray powder diffraction (XRD) and Field Emission Scanning Electron Microscopy (FESEM).
2.3. XRD and FESEM Characterisation Techniques
- The size, crystalline structure and morphology of the synthesised nanometre sized HAP powders were primarily investigated using X-ray powder diffraction (XRD). The XRD data was then used to model the crystal structure of the synthesised HAP using Rietveld refinement techniques and computer simulations. The Field Emission Scanning Electron Microscopy (FESEM) technique was used to study both the size and morphology of the synthesised particles. Powder XRD spectra were recorded at room temperature, using a Siemens D500 series diffractometer [Cu Kα = 1.5406 Å radiation source] operating at 40 kV and 30 mA. The diffraction patterns were collected over a 2θ range from 20° to 60° with an incremental step size of 0.04° using flat plane geometry. The acquisition time was set at 2 seconds for each scan. The crystalline size of the particles in the powders was calculated using the Debye-Scherrer equation[Equation 1] from the respective XRD patterns and estimated from the corresponding FESEM micrographs. The recorded powder XRD data was then used in subsequent modelling techniques. The morphological features of the nanometre sized HAP powders were investigated using FESEM. All micrographs were taken using a high resolution FESEM [Zeiss 1555 VP-FESEM] at 3 kV with a 30 µm aperture operating under a pressure of 110-10 Torr. In addition, the FESEM micrographs were also used to estimate the nano-HAP particle size by graphically measuring the size of each particle. The particle size of every particle in a 500 nm square grid was measured and then the mean particle size was determined from the collected data.
2.4. Modelling the Nanometre Sized HAP from Powder XRD
- The software used in modelling the X-ray powder diffraction pattern in this research was the Materials Studio version 4.4[12] and the Endeavour 1.7b[13] programs. In addition, powder indexing was used to determine unit cell parameters and the Pawley refinement procedure was used to determine the space group using the Reflex Module of the Materials Studio software package. The HAP crystal structure solution of the experimental X-ray powder diffraction data was solved using the Endeavour 1.7b software package. And the final HAP structure solution was refined using the Rietveld refinement procedure which is a function in the Reflex Module of Materials Studio software.
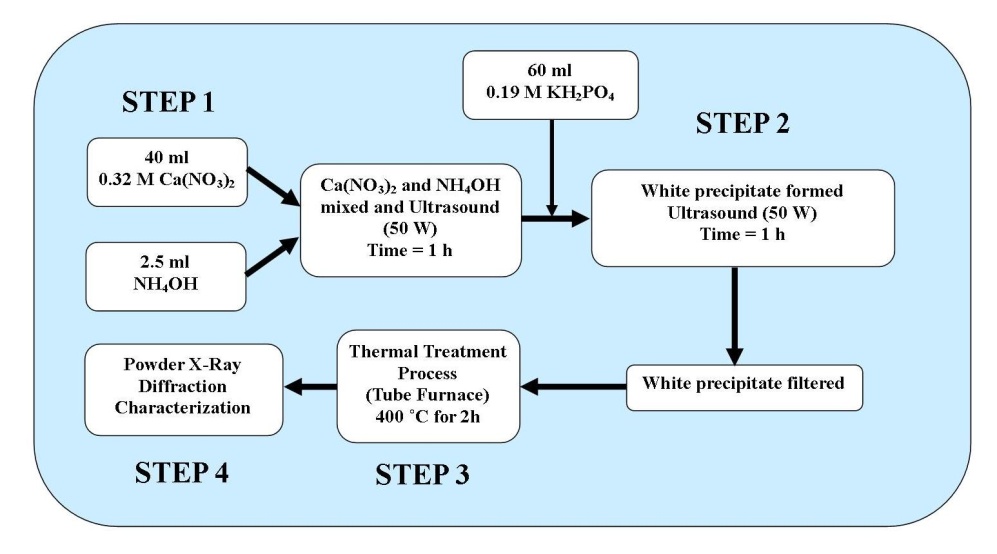 | Figure 2. Schematic of the synthesis procedure used to produce nanometre scale HAP powders |
3. Results and Discussions
3.1. Results of XRD and FESEM Analysis
- A typical powder XRD pattern of a synthesised nanometre sized HAP powder thermally treated at 400˚C for 2 h is presented in Figure 3(a). Inspection of Figure 3(a) reveals the presence of crystalline nanometre sized HAP phases, which were found to be consistent with the phases listed in the ICDD database. The main (h k l) indices for nanometre sized HAP: (002), (211), (300), (202), (130), (002), (222) and (213) being indicated in Figure 3(a). The crystalline size, t(hkl), of the synthesized nano-HAP powder was calculated from the XRD pattern using the Debye-Scherrer equation[14-17].
 | (1) |
3.2. Modelling the Powder XRD Data
- Indexing experimental powder diffraction data is often the most challenging step in determining a crystal structure for a novel synthetic material. The Materials Studio software package contains the Reflex algorithm module, which provides access to the well-known and popular indexing algorithms, ITO[18], TREOR90[19] and DICVOL91[20]. Initially, the Cu Kα radiation source (background) used to measure the XRD pattern was subtracted from the data before the Reflex algorithm module was used to analyse the XRD data. Pattern indexing was carried out using the indexing module TREOR90 and a Hexagonal solution was found with unit cell parameters of a = b ~ 9.389 Å, c ~ 6.869 Å, α = β = 90° and γ = 120°. Subsequent Pawley refinement was used to validate the results of powder indexing, since any incorrect cell data has the potential to produce significant deviation between the simulated and the experimental powder patterns. The refinement confirmed good agreement between the calculated and the experimental data. The resultant weighted profile R-factor (Rwp) value was (5.39%), while the weighted parameter after background subtraction Rwp (w/o bck) was estimated to be 4.97%. The space group analysis revealed a hexagonal lattice type, with a space group of P63/m. The results of the refinement are present in Figure 4.
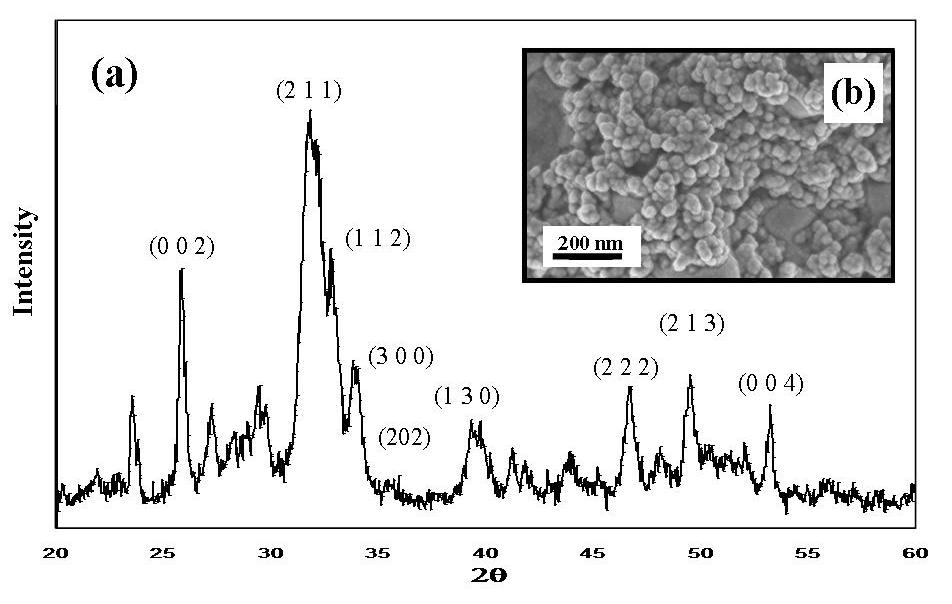 | Figure 3. (a) Typical experimental powder XRD spectrum of HAP sample, (b) FESEM micrograph showing the spherical morphology of 30 ± 5 nm HAP particles |
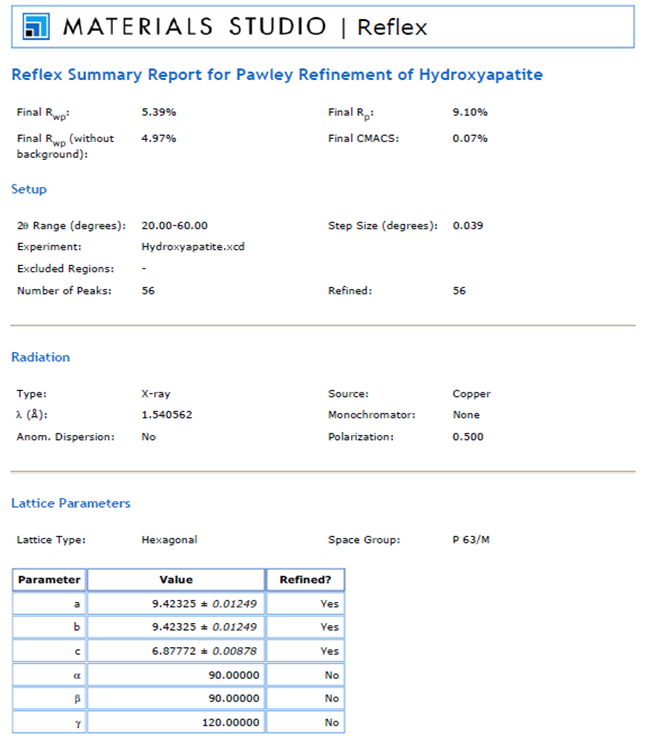 | Figure 4. Pawley refinement reports of the unit cell parameters for the synthesised HAP powder sample |
- The Endeavour® program was used to determine the crystal structure solution. Initially, the unit cell parameters and space group data from the Pawley refinement were entered into the Endeavour® software package. Further data such as the contents of the unit cell based on the formula sum for HAP[Ca10(PO4)6(OH)2] was entered atom by atom. The advantage of using the Pawley refinement data was that it significantly reduced the computing time and gave a rapid convergence of the data. During the structure solution calculation, the Endeavour® software matches the calculated diffraction pattern of each trial crystal structure to the "experimental” diffraction pattern. The structure solution was successfully completed and all crystal structure data necessary for the Rietveld refinement procedure determined. Unfortunately, the current version of Endeavour® was unable to perform the Rietveld refinement, therefore the crystal structure data was exported to the Materials studio 4.4 software modelling package for refinement. The subsequent Rietveld refinement calculated a Rwp value of 3.49 %, which was significantly smaller than the Rwp value of 5.39% calculated by the earlier Pawley refinement procedure. And since the Rietveld Rwp value of 3.49 % was lower than the Pawley refinement value there was no need to carry out any further refinement. The summary report of the Rietveld refinement for the HAP crystal structure is presented in Figure 5, while the resulting atomic arrangement of the HAP unit cell is schematically presented in Figure 6. The only fractional coordinates that the refinement procedure was unable to resolve were the H1 and O4, items 7 and 8 respectively. The Materials Studio software is currently unable to perform satisfactory refinement of these fractional coordinates.
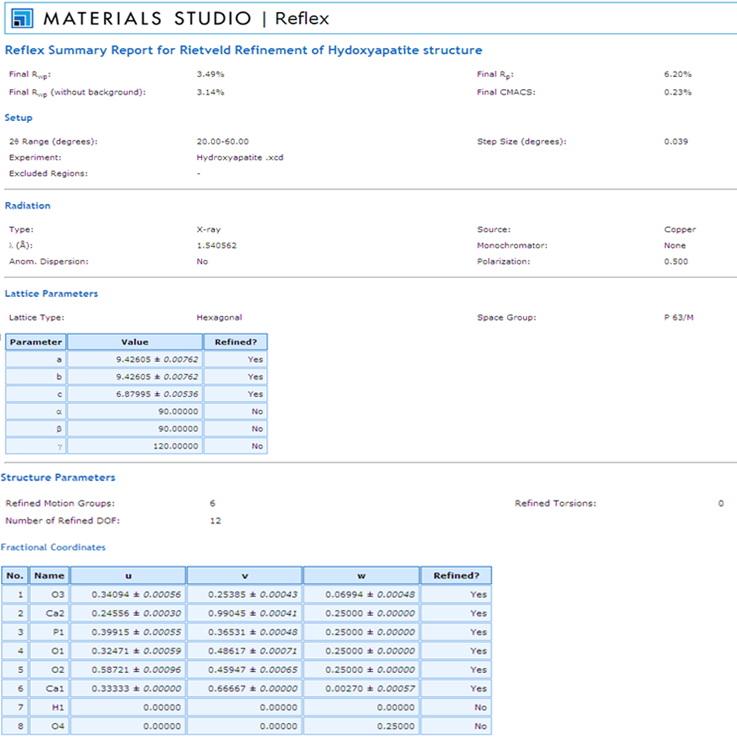 | Figure 5. The Rietveld refinement report of the HAP Structure |
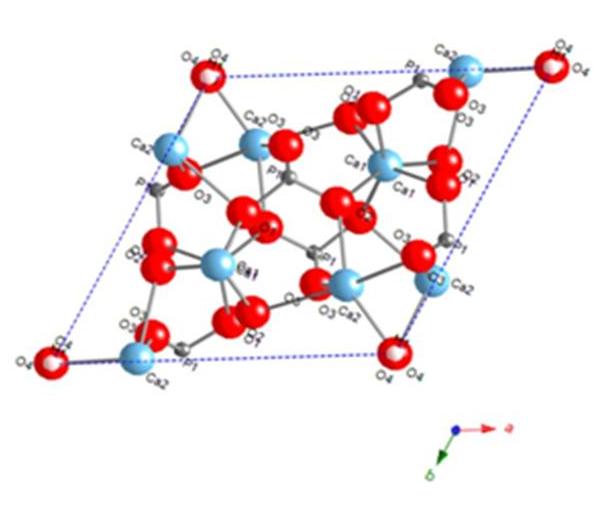 | Figure 6. Schematic of the final crystal structure of the HAP sample along C-axis calculated by Rietveld refinement |
4. Conclusions
- Nanometre scale crystalline HAP powders composed of spherical 30 ± 5 nm particles were synthesised under the influence of ultrasound irradiation and then thermally treated using a tube furnace. After the thermal treatment, the powders were characterized using powder XRD techniques and the resulting diffraction data was analysed using two commercially available software packages Materials Studio and Endeavour® 1.7b. Between the two software packages, a model of the HAP crystal structure was developed. Initially, the Pawley refinement method (results presented in Figure 4) was used to analyse the diffraction data. Then the refined Pawley data was incorporated into the Rietveld refinement technique (Figure 5) to develop a 3D model of the HAP crystal structure. The results of the 3D crystal structure modelling were presented schematically in Figure 6.
ACKNOWLEDGEMENTS
- This work was partly supported by the Western Australian Nanochemistry Research Institute (WANRI). Dr Derek Fawcett would like to thank the Bill & Melinda Gates Foundation for their research fellowship. The authors would like to thank Mrs. Sridevi Brundavanam for her assistance in the preparation of this article.
Disclosure
- The authors report no conflict of interest in this work.