-
Paper Information
- Next Paper
- Paper Submission
-
Journal Information
- About This Journal
- Editorial Board
- Current Issue
- Archive
- Author Guidelines
- Contact Us
American Journal of Materials Science
p-ISSN: 2162-9382 e-ISSN: 2162-8424
2013; 3(3): 41-54
doi:10.5923/j.materials.20130303.01
Review on the Bending Strength of Wood and Influencing Factors
 Abstract
 Reference
 Full-Text PDF
 Full-text HTML
Günther Schneeweiß1, Sonja Felber2
1Institute of Materials Science and Technology, Vienna University of Technology, A-1040 Vienna, Austria
2Institute for Building Construction and Technology, Vienna University of Technology, A-1040 Vienna, Austria
Correspondence to: Sonja Felber, Institute for Building Construction and Technology, Vienna University of Technology, A-1040 Vienna, Austria.
| Email: |  |
Copyright © 2012 Scientific & Academic Publishing. All Rights Reserved.
The bending strength values of clearwood specimens are examined in the range of flexural fracture. The values should be higher under centre loading than under third-point loading due to the size effect and decrease with increasing span length. The equations used for the size effect are criticised. The maximum tensile stress in the beams is lower for centre loading and higher for third-point loading, than calculated according to the classical beam theory. This requires a first correction of the simple size effect to a size/stress effect. Sometimes the measured values show a trend, contrary to the size/stress effect, caused by deformation at the load points. These deformations depend on the loading configuration, the orientation of the annual rings, and the compression strength perpendicular to grain. The evaluation of the measured values can lead to incorrect conclusions using just the equations of the simple size effect.
Keywords: Bending Strength, Flexural Fracture, Size Effect, Centre Loading, Third-Point Loading, Span Length, Stress Distribution, Deformation at Load Points, Annual Ring Orientation, Compression Strength Perpendicular to Grain
Cite this paper: Günther Schneeweiß, Sonja Felber, Review on the Bending Strength of Wood and Influencing Factors, American Journal of Materials Science, Vol. 3 No. 3, 2013, pp. 41-54. doi: 10.5923/j.materials.20130303.01.
Article Outline
1. Introduction
- Small clear specimens are considered, with fibre direction in the longitudinal direction of the beams. The values of the bending strength are described in dependence of the span-depth ratio (span length L /specimen depth D). The specimens show flexural fractures above a critical value of the span-depth ratio and shear fractures below. Only the range of flexural fractures is examined in this paper. The used loading configurations are centre loading and third-point loading (in some cases two-point loading).Two special cases of the annual growth ring orientations are regarded, namely annual rings parallel (vertical annual rings) and annual rings normal to the direction of the load (horizontal annual rings).The compression strength perpendicular to grain at the load points is important for flexural fracture. Deformations can reduce the bending strength.
2. Stress Distribution
- The classical(elementary) beam theory[1] supposes a linear distribution of the longitudinal stresses across the beam depth. The bending stresses calculated under these suppositions should be at the same time the stresses in the extreme fibres of the tension and compression zone. The graph of the bending stresses shows according to the beam theory for centre loadinga triangular and for third-point loading a trapezoidal shape a long the beam length. Salient points (kinks) should appear inthe graphs of these bending stresses. Consequently, they also show up in the graphs of the stresses at the extreme fibres of the tension zone. No such salient points can occur, if there are no external loads, effecting in the tension zone.Seewald[2] calculated the stress distributions for beams under centre loading and third-point loading, supposing a linear elastic, homogenous, and isotropic material. The validity of the stress distributions calculated can be proved experimentally.The stress distribution can be determined according to a method of Schneeweiß[3] and[4] experimentally in the following way: a great number of the same specimens is tested; the locations of the fracture origins are determined. The frequency distribution of the fracture origins is used to calculate the stress distribution. Fracture occurs mainly at or near the point of the maximum stress, and less often, where the stress is lower.Fig. 1 shows as an example the frequency distribution of the location of fractureof 72 concrete specimens as a histogram. The specimens had a cross-section of 120 x 120mm². They were tested with a span length of L = 300mm under third-point loading. The mentioned methodin[3] and[4] results ina stress distribution with two maxima of the stress between the two load points, as can be seen in Fig. 1. This corresponds to the stress distribution calculated by See wald evaluated by Naschold[5] and Tucker[6]. The stress distribution for centre loading was also determined in[4], showing at the mid-span a stress distribution with a horizontal tangent instead of the salient point. Steinhardt[7] achieved such a stress distributio nusing the brittle lacquer test for beams of spruce.Naschold[5] calculated the maximum tensile stress in beams as shown in Fig. 2. The maximum stress at third-point loading (the stress at both maxima) shall increase steadily with decreasing span-depth ratio. The maximum stress decreases for centre loading until L/d = 1.7, compared to the beam theory, and then increases strongly. The difference between the maximum stresses under centre and third-point loading are 19.4 % for L/d = 2 and 3.4 % for L/d = 8.
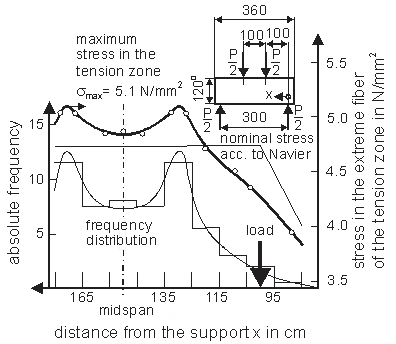 | Figure 1. The effective distribution of the extreme fibre stress in the tension zone at third-point loading calculated of the frequency distribution of the fracture origins of concrete specimens |
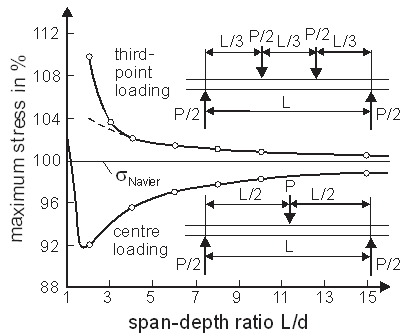 | Figure 2. Differences between the maximum stress in the extreme fibres of the tension zone and the nominal bending stress according to Navier[1] calculated by Naschold[5] using the stress distribution of Seewald[2] |
3. Size Effect
- It can be assumed, according to the theory of the size effect (weakest link theory), that the strength is dependent on the size of the highly stressed volume.
3.1. Tensile Strength
- The tensile strength of defect-free specimens decreases strongly with increasing length of the specimens. Corresponding data of defect-free specimens can be found in the papers of Roš[9] (fir), Graf and Egner[10] (spruce), Rein[11] (pine heartwood and pine sapwood), Sumiya and Sugihara[12] (hinoki, lauan, and beech), Chudziński[13] (pine), Schneeweiß[14] (spruce), and Kunesh and Johnson [15] (Douglas fir, and hem fir). The data arepartly cited dependent on the area of the cross-section instead of the specimen length (Vorreiter[16] and Kunesh and Johnson [15]).The maximum tensile stress in the extreme fibres of large beams was statistically below the tensile strength of small size standard specimens (Comben[17] and Malhotra and Bazan[18]). The difference became smaller as the size of the beam decreased. The uniaxial tensile strength is for specimens of the same volume lower than the extreme fibre tension stress of beams.In regard to research on construction timbers see Glos and Burger[19], Burger and Glos[20], Steiger[21] and[22], Burger[23] (with literature overall view), and Takeda and Hashizume[24].
3.2. Compression Strength
- Data on spruce of Schneeweiß[25] supplemented with data of the literature led to the following strength-volume dependence:The compression strength decreases with increasing specimen volume, goes through a minimum, increases slightly to a maximum, and finally decreases again according to the size effect. Spruce showed the minimum at about 50 cm³ and the maximum at about 1000 cm³.This volume dependence of the compression strength was also observed for concrete specimens (Schneeweiß[26]). It can be explained by the interaction between a size effect and a surface layer effect[25] and[26].Steiger[22] examined spruce timbers with volumes of 864, 2048, 2560, and 8064 cm³. He found the maximum at 2048 cm³.The values of tests of Okohira et al[27] showed on the average this wavy trend.
3.3. Bending Strength
- The size effect of defect-free specimens was reduced to a depth effect by Tanaka[28], Monnin[29] and[30],Čižek[31], and Ylinen[32]. The weakest link theory was not mentioned.Tests of Johnson[33], Talbot[34], Cline and Heim[35], Newlin and Trayer[36], and Schlyter and Winberg[37] deal mainly with the comparison of the bending strength of timber with the one of small specimens.Sumiya and Sugihara[12] mentioned the weakest link theory of Epstein[38], who used the probability density function of Gauß for the strength values. The authors confirmed the linear regression between the strength and(log V)1/2 according to this theory for tensile tests on lauan and hinoki and bending tests on beech (V = specimen volume).Later on the extreme value distribution of type II of Fisher and Tippett[39] hasbeen used instead of the distribution of Gauß:Schneeweiß[40] to[42], Bohannan[43], Schneeweiß [44], Madsen and Buchanan[45], Madsen[46], and Madsen and Tomoi[47].Bohannan[43] replaced in the weakest link theory the volume of the beams by the aspect ratio (product of length and depth). He concluded that the bending strength is independent of the width. Schneeweiß[44] found in tests on small clear specimens with varying width a maximum of the bending strength at about b/d = 4. An analysis of the bending strength of timbers (data of Chaplin and Nevard[48] and Thunell[49]) of different sizes showed a dependence of the size effect from the width[44]. Madsen[46] concluded from his data on defect-free Douglas fir that the volume effect is a more appropriate representation regarding the size effect than the aspect ratio.Madsen and Buchanan[45] modified the theory to allow different magnitudes of size effects for length, depth, and width.A synopsis of literature about the size effect of timber (and defect-free specimens) can be found in Denzler[50].
4. Criticism of the Weakest Link Theory
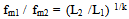
- It should be mentioned that the weakest link theory can be used for chains[51] but, generally, not for specimens with different shapes and sizes[44]. A decrease of the size effect resulted[52] in tests on chains, if parallel connection occurs in addition to series connection. A stochastic process is used instead of the weakest link theory[14] and[53] in case of other materials, e.g. steel.Equation (1) results from the weakest link theory using an extreme value distribution of type II with two parameters (2-parameter Weibull-distribution). fm1 and fm2 are the mean values of the bending strength. V1 and V2 are the volumes of the tested specimens. kis the formfactor of the distribution. Equation (2) with (1/k) = 0.87v can be used as an approximation of equation (1), with v as coefficient of variation[44].
 | (1) |
 | (2) |
5. Flexural Fracture Curves (Theory)
- The (theoretical) dependence of the bending strength from the span-depth ratio (flexural fracture curve) is obtained, as shown in Fig. 3[42] and[54]. Considered are: a) the distribution of the longitudinal stresses in a beam calculated by Seewald; b) the size effect; c) the transition fromflexural fracture to shear fracture. Not considered is that the deformation at the load points can diminish the bending strength, which is explained in detail later.The size effect is reduced to a length effect regarding beams with constant cross-section and a pre-set loading configuration. Equation (1), therefore, can be written as:
 | (3) |
6. Flexural Fracture Curves (Tests)
- Schneeweiß[42] carried out bending tests on simply supported beams of oak and spruce subjected to both, centre loading and third-point loading, to check the dependences according to Fig. 3.The cross-section of the specimens was kept constant for specimens within each of the series. The length of the specimens and, therefore, the span-depth ratio was changed.Oak specimens (4 series) were loaded with the direction of load normal to the annual rings(horizontal annual rings). The angles between the direction of load and the annual rings were for spruce specimens (6 series)between 41 and 67°.
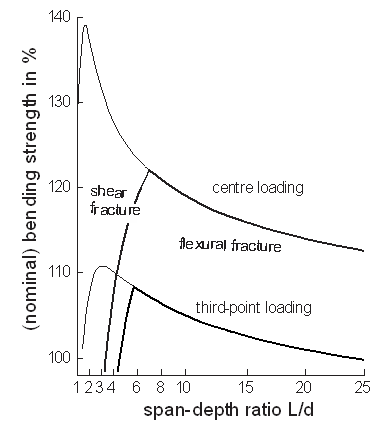 | Figure 3. The bending strength according to both, the size effect and the effect of the actual stress distribution (schematic) |
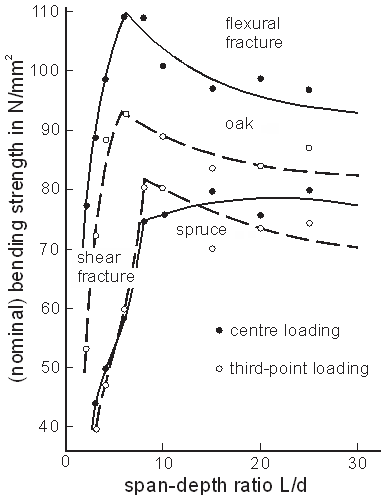 | Figure 4. Differences in the shape of the fitting curves of the bending strength of wood with high (oak) and low values (spruce) of the compression strength perpendicular to grain |
7. Bending Strength and Span Length
7.1. Tests of Baumann
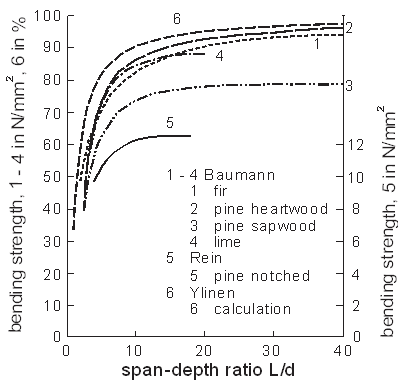
- Two different length effects can be expected for small clear specimens according to Fig. 4. These are increasing or decreasing of the bending strength increasing span length. Examples for the increasing strength are the well-known data for centre loading of Baumann[56] for the following species of wood:fir, pine heartwood, pine sapwood, and lime.Data exist for the three species of wood mentioned before, both for the direction of the load normal to the annual rings(horizontal annual rings) and for the direction of the load parallel to the annual rings (vertical annual rings)in dependence of L/d.Baumann[56] did not distinguish between shear fracture and flexural fracture. The average bending strength values of both annual ring orientations were fitted by a curve, increasing continuously with increasing span length. These fitting curves, according to equation (4) (designations of Baumann), are shown in Fig. 5. The equation is based on the assumption that at span-depth ratios above L/d = 40 no further increase of the bending strength occurs:
 | (4) |
 | Figure 5. Examples of increasing bending strength with increasing beam length |
7.2. Further Tests from Literature
- Ylinen[59] calculated the length effect for simply supported beams. The load was distributed uniformly in the middle of the span over a range c (length of the bearing plate at the load point). The calculation of Ylinen was performed without consideration of the size effect and the possibility of shear fracture. The curves are determined for beams with rectangular cross-section and straight horizontal annual rings with distinct differences of the properties of earlywood and latewood. Ylinen received, as Baumann, contrary to the calculation of Seewald, curves increasing steadily with L/d. In both calculations the curves approach to a limit value. The equation, obtained by Ylinen, agrees with equation (4) of Baumann under special assumptions.Rein[11] found the same length effect as Baumann[56] for beams of pine with a notch at mid-span. The calculated curves of Ylinen [59] and the fitted curve of Rein[11] are shown in Fig. 5.Tests of Bechtel and Norris[60]on Sitka spruce resulted in an increase of the bending strength, as well under centre loading, as also under two-point loading, with an increase of the span-depth ratios from L/d = 10 to L/d = 14. The increase was smaller in tests with two-point loading than for centre loading.Chudziński[13] tested beams with different length, resulting in higher bending strength values for longer beams.Bohannan[43] analysed the length effect of beams of Douglasfir. 343 and 210 beams were tested with centre loading at span lengths of 36 and 46mm and led to average bending strength values of 91.4 and 92.1 N/mm².Most of the time a decrease of the bending strength with increasing span length was established in construction wood. This is according to Madsen and Buchanan[45] valid, independent of the loading configuration (centre loading, two-point loading, and third-point loading).
8. Centre –and Third-Point Loading
8.1. Tests on Defect-Free Specimens
- A higher bending strength is expected in tests under centre loading than under third-point loading, caused by the size/stress effect.The ratio of the values of the considered characteristics, determined for beams under centre loading and under third-point (or two-point) loading, is called RCT. Bohannan[43] calculated RCT according to the size effect
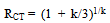 | (5) |
8.1.1. Tests on Oak
- The width of the specimen was 20 mm, the depth 40mm, the span length 320mm forcentre load in gand 480mm for third-point loading. The span length was chosen in a way that the shear length wasthe same in both specimen types. 12 beams were cut out of the tested plank next to each other. Theannual rings were partly normal to the loading direction (beams out of the middle of the plank), partly they ran from edge to edge (beams out of the edge of the plank) of the cross-section. Each beam was cut into three specimens, which were taken for both loading configurations, alternately lying behind each other. The average bending strength resulted for third-point loading in 95.6 N/mm², for centre loading in113.9 N/mm² corresponding to RCT = 1.19.
8.1.2. Tests on Spruce
- Four beams with a quadratic cross-section with an edge length of 35 mm were cut out of a plank next to each other. Seven specimens were taken of the beams lying behind each other. They were tested with a span length of 300mm under centre loading, with one of 340mm under two symmetrically placed loads in a distance of 40mm, and with one of 450mm under third-point loading. The shear length was the same for the three types of tests. The average bending strength in the tests was 76.5 N/mm² for two-point loading and 76.1 N/mm² for third-point loading.The bending strength was a little higher under two-point loading than under third-point loading according to the length effect. The highest bending strength should result under centre loading. Actually, the lowest value of 59.2 N/mm² was obtained and resulted in RCT = 0.78. An indentation of the bearing plates into the wood could be found. This was also shown by the average remaining indentation depth of 0.95 mm for third-point loading and 1.70 mm for centre loading.
8.2. Tests on Construction Wood
- The data were approximately according to the size/stress effect for timber beams, which means, the bending strength was higher in tests under centre loading than under third-point loading: Bohannan[43], Madsen and Nielsen[62], Madsen and Buchanan[45], Ehlbeck and Colling[63], Kessel [64], Madsen[65], and Denzler[50].Madsen[65], for example, stated in a table the ratio of the bending strength centre loading/third-point loading to RCT = 1.22.
9. Bending Strength and Annual Ring Orientation
9.1. General Notes
- Duhamel du Monceau[66] was the first, who stated that beams placed with vertical annual rings are carrying more load than beams with horizontal annual rings. Later on, this problem was discussed by Nördlinger[67], Wijkander[68], and Rudeloff[69].The specimens shall be, according to ASTM D 143-2003, placed that the load acts through the bearing block to the tangential surface near the pith. Tests on vertical annual rings are intended in other standards.In the following, some factors influencing the measured bending strength are summarized.
9.2. Horizontal Rings, Pith near the Compression or Tension Side
- Bending tests on beams with horizontal annual rings can be performed that the wood next to the pith can be arranged in the tension or compression zone. As an example, bending tests of Tetmajer[70] on pine, spruce, white fir, and larch, with bending in the direction away from the pith (near the compression side), resulted in lower bending strength values than in the opposite direction. The result in oak was changing. In beach the opposite resulted.
9.3. Annual Ring Width
- Grotta et al.[71] found in test on Douglas fir beams that vertical rings give higher bending strength, up to an annual ring width of 3.6 mm, and higher or lower strength values (both cases occurred) above this annual ring width.
9.4. Moisture Content
- Markwarth and Wilson[72] examined beams of Sitka spruce and Douglas fir in the green and air-dried or kiln-dried condition. Both species of wood showed in the green condition a higher bending strength with vertical rings. This was also true for the kiln-dried Douglas fir, but not for the air-dried Sitka spruce, where the difference was negligible (58.3 and 58.4 N/mm²).
9.5. Position of Earlywood or Latewood
- Grotta et al.[71] tested defect-free specimens of small dimensions with horizontal annual rings. It was found to be important, whether the surface fibres in the compression or tension zone were of earlywood or of latewood. Forsaith[73] researched this problem in detail.
9.6. DataTaken from Literature
9.6.1. Softwood
- The published data of Baumann[56] in Fig. 6 for fir, pine heartwood, and pine sapwood were averaged separately for each of the two annual ring orientations. It was assumed that for L/d ≥ 8 only flexural fractures occur. The data for smaller span-depth ratios are not shown.
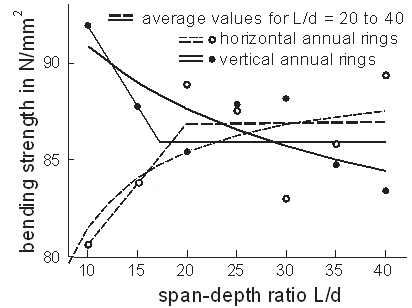 | Figure 6. Average values of the bending strength for the two annual ring orientations using data of Baumann on fir, pine heartwood, and pine sapwood, evaluated by two different versions (curves according to equations (3) and (4)) |
9.6.2. Hardwood
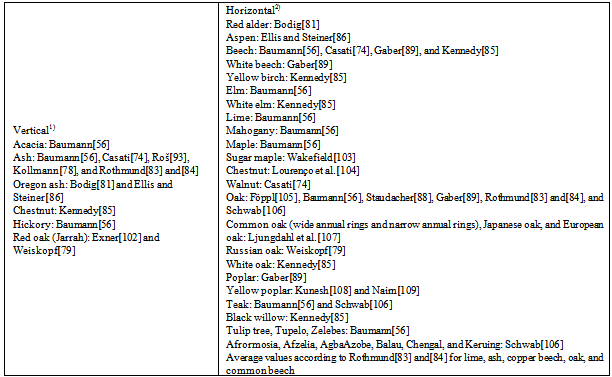
- The dependence of the bending strength over a widerange of the span-depth ratio was determined by Baumann[56]for lime and by Schneeweiß[42] for oak, but not for both annual ring orientations. Data could be found in references for softwood and hardwood for both annual ring orientationsbut onlyfor one span length, see table 2.
|
10. CompressionStrength Perpendicular to Grain
10.1. General Notes
- The behaviour of specimens under compression perpendicular to grain can be defined by different characteristics (stress at the proportional limit, maximum stress, and stress corresponding to a certain offset or total strain (Gehri[80])). In the following it is just established, if the value of the examined characteristic has been higher or lower for radial (load direction normal to the annual rings) or tangential compression (load direction tangential to the annual rings). The term strength is used independent of the characteristic determined.
10.2. Softwood
- Softwood (and ring porous hardwood) has a distinct alternation of lower density earlywood and higher density latewood. The dense latewood layers have to support the major part of the loadin tangential compression. The latewood layers fail,according to Bodig[81], like long columns or plates, and are the controlling factors. The participation of the earlywood layers in the support of the load is, because of low strength, not as important as the lateral support of the latewood layers.The first failure is in radial compression, located in the weakest earlywood layer (additional failures occur in the same or in several other earlywood layers, as the compression progresses). Latewood layers act as load distributors. A low ray volume is typical for softwood. The strength in radial compression is determined only by earlywood, while in tangential compression latewood is the controlling factor.
10.3. Hardwood
- Hardwood has higher ray volumes than softwood. Rays have a supporting effect in radial direction (Huber and Prütz[82], Rothmund[83] and[84], Bodig[81], and Kennedy [85]). The effect of latewood, raising the strength in tangential compression, was already mentioned. Therefore, the ratio between the strength of radially and tangentially loaded specimens increases with higher ray volume and decreases with the latewood percentage (Kennedy[85]). Ring porous hardwood has partly higher volumes of latewood, diffuse porous hardwood in generally lower ones (Kennedy[85]). Therefore, the radial strength of diffuse porous hardwood is obviously higher than the tangential one, but for ring porous hardwood the differences may be small (Kollmann[57]).
10.4. Factors Influencing the Measured Strength Values
10.4.1. Definition of the Compression Strength Perpendicular to Grain
- The choice of the definition of the compression strength can cause different assessments (Bodig[81] and Ellis and Steiner[86]), if the stress-strain curves for the two annual ring orientations intersect.
10.4.2. Density
- Different densities can cause different test results for the same species of softwood. Rothmund[83] and[84] received for high density spruce and pine specimens higher strength values in tangential than in radial and for specimens with low density higher strength values in radial than in tangential compression. The specimens of oak were stronger in radial than in tangential compression, independent of their density.
10.4.3. Ring Curvature
- The curvature of the annual rings can influence the strength of the specimens according to Madsen et al.[87], especially, in tangential compression.
10.4.4. Height
- The latewood layers buckle in specimens with vertical annual rings easier, the greater the specimens’ height (Staudacher[88]). The influence of the height of the specimens is in radial compression significantly lower than in tangential one (Gaber[89] and Rothmund[83]). Small specimenheights, therefore, advantage higher strength in radial compression.So, different authors can find different results concerning the strength of specimens with vertical or horizontal annual rings of the same species.
10.5. Results of a Literature Research
10.5.1. Softwood
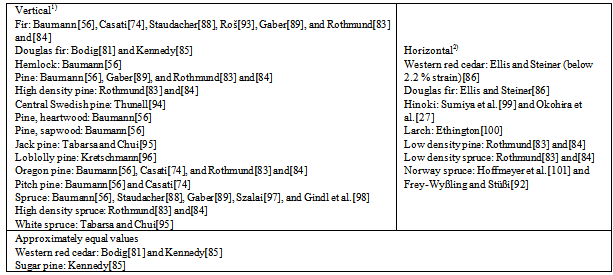
- Some authors (Vorreiter[16], Kollmann[57], Bodig[81], Perelygin[90], Kennedy[85], and Mönck and Rug[91]) stated that softwood shows a higher strength perpendicular to grain in tangential compression (vertical annual rings) than in radial one (horizontal annual rings).Exceptions arise, see table 3, from low densities, as for instance in case of western red cedar (0.322 g/cm³, Kennedy[85] or 0.323 g/cm³, Ellis and Steiner[86]),sugar pine (0.276 g/cm³, Kennedy[85]), low density pine (0.39 g/cm³, Rothmund[83] and[84]), low density spruce (0.33 g/cm³, Rothmund[83] and[84]). Low density is correlated with low latewood percentage (sugar pine 3.4 %, Kennedy[85] and western red cedar 15 %, Kennedy[85]).The data of Frey-Wyßling and Stüßi[92] may be influenced by the large specimens’ height of 75 mm, which promote higher strength in radial compression.
|
10.5.2. Hardwood
- Some authors mention that specimens of hardwood in radial compression shall generally show higher strength values: Vorreiter[16] and Mönck and Rug[91]. Table 4 gives the results of the literature search. Data of Casati[74] on small hardwood cubes show, probably due to the small height of 20 mm, higher strength values in tangential than in radial compression for the wood species alder, elm, poplar, and white poplar. These findings are not confirmed by other authors and not included in table 4.
|
11. Bending Strength and Compression Strength Perpendicular to Grain
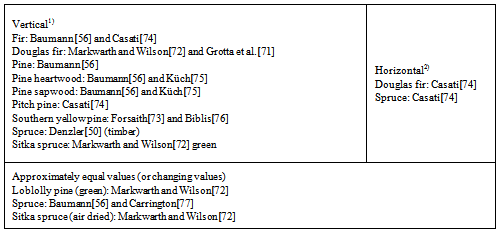
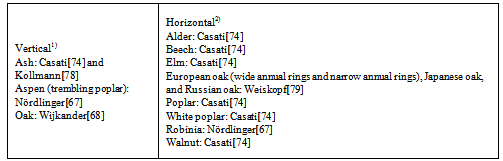
- It can be seen that in general both, the bending strength and the compression strength perpendicular to grain, in case of softwood are higher for vertical annual rings and in case of hardwood higher for horizontal annual rings. There are some exceptions, but also in these cases conformity can be seen. Spruce and Douglas fir show changing results in both types of tests. Ash, as a ring porous hardwood, results in both types of tests into higher values for vertical annual rings, contrary to the statements before. All this confirms the opinion that the compression strength perpendicular to grain influences the bending strength.In the following some facts are given, which support this opinion:Data on oak with vertical annual rings show according to Fig. 4a nearly unnoticeable influence on the strength perpendicular to grain, because for oak this one is very largefor horizontal annual rings(16.7 N/mm²) as well as for vertical ones (11.6 N/mm²)(Baumann[56]).Fig. 6 shows in the range of L/d = 8 to L/d = 20 that the average bending strength for three tested species of wood, these are fir, pine heartwood, and pine sapwood, increased with increasing span-depth ratio for horizontal annual rings and decreased for ones. Additionally, it should be mentioned that this tendency also appliesseparately for all three species of wood.The compression strength perpendicular to grain for horizontal annual rings were stated in Baumann[56] for these three species of wood with 3.6, 5.5, and4.7 N/mm², for vertical annual rings on the other hand with 7.6, 8.6, and 9.4 N/mm².Therefore, the lower strength values for horizontal annual rings were responsible for the decrease of the bending strength with decreasing beam length.
12. Summary, Conclusions
- A decrease of the bending strength could be expected with increasing span length caused by size effects. Furthermore, the bending strength under centre loading should be higher than under third-point loading.The weakest link theory leads, using the two-parameter Weibull distribution, to a straight line in a diagram log (bending strength) versus log (span length). The slope of the fitting straight line has to be determined by the coefficient of variation of the individual values, if the measured values are expected to obey this theory. In general, this connection was not checked in literature.The actual occurring maximum bending stressin the tension region depends on the span length and is lower for centre loading and higher for third-point loading, than stated in the beam theory. This effect overlaps the size effect to a size/stress effect, which means, the slope of the straight line mentioned decreases more under centre loading(for L/d > 2) and less under third-point loading than according to the weakest link theory. There are larger differences of the bending strength between centre and third-point loading in case of a smaller span length. Altogether, the size effect prevailed.A fundamental change of this trend results, if the bending strength is diminished caused by the deformation under the bearing plates.The assumed size/stress effect could be found in tests on oak as well for centre as also for third-point loading. The tests on beams of spruce resulted for third-point loading in the expected shape of the curves. The bending strength decreased in tests under centre loading with decreasing span length and sank even below the one tested under third-point loading. It is to notice that under third-point loading the load was transferred by two bearing plates and under centre loading only by one with the same dimensions. The compression strength perpendicular to grain is higher for oak than for spruce.Literature research and own evaluations showthat especially the values of the bending strength under centre loading can decrease with decreasing span length, contrary to the weakest link theory.Generally, the compression strength perpendicular to grain is higher or lower for those annual ring orientations, in which the bending strength of the wood types tested was also higher or lower.All these test results could be explained by a deformation under the bearing plates.Summarizing, the simple weakest link theory cannot be used directly, because bending specimens do not meet the requirements of this theory as chains do. Furthermore, this theory does not consider the actual stress distribution in a beam under bending (an accommodation is possible), and the deformation at the load points diminishes more or less the bending strength.It may be possible to use the fundamental relations of the theory, but just if the coefficients are determined by tests.
References
| [1] | Navier, L.M.H. 1879. Mechanics of Architecture. 2nd Ed., p. 62. Helwingsche Verlags-Buchhandlung, Hannover (in German). |
| [2] | Seewald, F. 1927. Stresses and Deformations of Beams with Rectangular Cross-Sections. Abhandlungen aus dem Aerodynamischen Institut der T. H. Aachen, No. 7, pp. 11-33 (in German). |
| [3] | Schneeweiß, G. 1963. Calculation of the Stress Distribution Using the Fracture Frequency.ÖsterreichischesIngenieur-Archiv, 17(2): 107-135 (in German). |
| [4] | Schneeweiß, G. 1986. Checking of Loading Equipments, Stress Distributions, and Material Inhomogeneity by Means of the Frequency Distribution of Fracture Origin. Materialprüfung, 28(11): 354-356 (in German). |
| [5] | Naschold, G. 1941. The Extreme Fibre Stresses of Straight Rectangular Beams under Single Loads. Der Bauingenieur, 22(5/6): 40-49 (in German). |
| [6] | Tucker, J., Jr. 1941: Statistical Theory of the Effect of Dimensions and of Method of Loading upon the Modulus of Rupture of Beams. Proc. ASTM 41: 1072-1094. |
| [7] | Steinhardt, O. 1938. Research on Wooden Joints or Wooden Structures Using Field of Forces. HolzalsRoh- und Werkstoff, 1(14): 537-538 (in German). |
| [8] | Hooley, R.F. and Hibbert, P.D. 1967. Stress concentration in timber beams. J. of the Structural Division, Proc. of the American Society of Civil Engineers, 93(ST2): 127-139. |
| [9] | Roš, M. 1925. S.I.A.-Standards for Wooden Structures. EMPA, Zürich (in German). |
| [10] | Graf, O. and Egner, K. 1937/38. Variability of the Tension Strength of Spruce with the Shape and Size of the Gripping Heads of the Standard Specimen and with the Enlarging of the Cross-Section of the Specimen. HolzalsRoh- und Werkstoff, 1(10): 384-388 (in German). |
| [11] | Rein, W. 1945. Notch Sensitivity of Wood. Dr.-Ing. thesis, Technische Hochschule Darmstadt, Deutschland (in German). |
| [12] | Sumiya, K. and Sugihara, H. 1957. Size effets in the tensile and bending strength of wood. J. Japan Wood Res. Soc., 3(5): 168-173. |
| [13] | Chudziński, Z. 1964. Strength Properties Determined by Different Testing Procedures for Solid Pinewood, Veneer-, Fibre-, Chip-, and Flax-Boards. Holztechnologie, 5(4): 233-240 (in German). |
| [14] | Schneeweiß, G. 1972. Fracture and Formation of Carbide and Ferrite Cracks in Tensile Specimens Taken from Low Carbon Steels as a Composite Stochastic Process. Archiv Eisenhüttenwesen, 43(12): 913-917(in German). |
| [15] | Kunesh, R.H. and Johnson, J.W. 1974. Effect of Size on Tensile Strength of Clear Douglas-fir and Hem-fir Dimension Lumber. For. Prod. J., 24(8): 32-36. |
| [16] | Vorreiter, L. 1949. Handbook of Wood Technology, Vol. I: General, Woodology, Wood Preservation, and Modification of Wood. Verlag Georg Fromme& Co., Wien(in German). |
| [17] | Comben, A.J. 1957. The Effect of Depth on the Strength Properties of Timber Beams with an Analysis of the Stresses and Strains Developed. Great Britain Dept. of Sci. and Ind. Res., For. Prod. Res. Spec. Rep. No. 12, Her Majesty´s Stationary Office, London, England. |
| [18] | Malhotra, S.K. and Bazan, I.M.M. 1980. Ultimate bending strength theory for timber beams. Wood Sci., 13(1): 50-63. |
| [19] | Glos, P. and Burger, N. 1995. Influence of the Dimensions on the Tensile Strength of Structural Lumber. Bericht 91501, Institut für Holzforschung, Universität München, Deutschland, 127 pp (in German). |
| [20] | Burger, N. and Glos, P. 1996. Influence of the Dimensions on the Tensile Strength of Structural Lumber. HolzalsRoh- und Werkstoff, 54(5): 333-340(in German). |
| [21] | Steiger, R. 1995. Bend-, Tension-, and Compression Tests on Swiss Spruce Wood. Forschungsbericht No. 207 des Instituts für Baustatik und Konstruktion, Fachbereich Stahl- und Holzbau, ETH Zürich. BirkhäuserVerlag, Basel(in German). |
| [22] | Steiger, R. 1996. Mechanical Properties of Swiss Spruce Structural Timber Subjected to Bend-, Tension-, Compression-, and Combined M/N-Stress. Dr. thesis, ETH Zürich, Schweiz(in German). |
| [23] | Burger, N. 1998. Effect of the Dimensions of Wood on the Strength of Lumber Subjected to Tensile Stress in Grain Direction. Dr. thesis, Techn. Univ. München, Deutschland (Berichte aus dem Bauwesen, Shaker Verlag, Aachen) (in German). |
| [24] | Takeda, T. and Hashizume, T. 1999. Differences of tensile strength distribution between mechanically high-grade and low-grade Japanese larch lumber I: Effect of length on the strength of lumber. J. Wood Sci, 45(3): 200-206. |
| [25] | Schneeweiß, G. 1964. Compressive Strength and Hoeffgen Hardness. HolzalsRoh- und Werkstoff, 22(7): 258-264 (in German). |
| [26] | Schneeweiß, G. 1964. The Basic Trend of the Size Effect in the Compression Test of Concrete.ÖsterreichischenIngenieur-Archiv, 18(1/2): 22-46 (in German). |
| [27] | Okohira, Y., Masuda, M., and Suzuki, N. 1989. The Size Effect of Compressive Strength of Wood. Bull Faculty Bioresources, Mie Univ., Japan, No. 2, pp. 13-21. |
| [28] | Tanaka, F. 1909. International Association for Testing Materials. V. Conference, Copenhagen. Review on the Conference, II. Abteilung: Die Kongreßverhandlungen, pp. 190-191 (in German). |
| [29] | Monnin, M. 1919. Physical Essay, Statics and Dynamics of Wood. Bull. Section Technique de L’AeronautiqueMilitaire, fascicules 29 et 30, Juin et Juillet, Paris (in French). |
| [30] | Monnin, M. 1932. Testing of Wood. International Association for Testing Materials, Congrés de Zurich, 6-12 Septembre 1931, Tome II, pp. 85-115, Éditions A.I.E.M., Zurich (in French). |
| [31] | Čižek, L. 1932. Contribution to Monnin[30], International Association for Testing Materials. Kongreß Zürich, Zürich, Schweiz, 1931, Kongreßbuch Vol. II, pp. 178-179 (in German). |
| [32] | Ylinen, A. 1942. About the Effect of the Specimen Size on the Bending Strength of Wood. HolzalsRoh- und Werkstoff, 5(9): 299-305 (in German). |
| [33] | Johnson, J.B. 1898. Progress in Timber Physics. Influence of size on test results; distribution of moisture. USDA, Division of Forestry, Circular No. 18, pp. 1-13. Washington. |
| [34] | Talbot, A.N. 1909. Tests of Timber Beams. Univ. of Illinois. Eng. Exper. Station, Bull. No. 41. |
| [35] | Cline, M. and Heim, A.L. 1912. Tests of structural timbers. USDA, Forest Service - Bull. 108. For. Prod. Lab. Series. Government Printing Office, Washington. |
| [36] | Newlin, J.A. and Trayer, G.W. 1924. Form Factors of Beams Subjected to Transverse Loading only. Nat. Adv. Comm. for Aeronaut. Rep. No. 181, pp. 375-393. (Reprinted as USDA, Forest Service, For. Prod. Lab. Rep., No. 1310, Madison, Wis., 1941). |
| [37] | Schlyter, R. and Winberg, G. 1929. The strength of Swedish redwood timber (pine) and its dependence on moisture-content and apparent specific gravity. StatensProvningsanstalt, Meddelande 42, Stockholm, Sverige, (also IVA, handlingar No. 92, 1929). |
| [38] | Epstein, B. 1948. Statistical aspects of fracture problems. J. Appl. Phys., 19(2): 140-147. |
| [39] | Fisher, R.A. and Tippett, L.H.C. 1928. Limiting forms of the frequency distribution of the smallest and the largest member of a sample. Proc. Cambr. Phil. Soc., 24, pp. 180-190. |
| [40] | Schneeweiß, G. 1961. About the Effect of the Dull Edge on the Bending Strength of Structural Timber. Holzforschung und Holzverwertung, 13(6): 101-109 (in German). |
| [41] | Schneeweiß, G. 1962. The Calculation of the Bending Strength (of Wood) Using the Strength of Uniaxial Tests. ÖsterreichischesIngenieur-Archiv, 17(1): 1-31 (in German). |
| [42] | Schneeweiß. G. 1964. The Influence of Method of Loading, Span Length, and Compressive Strength Perpendicular to Grain on the Bending Strength. HolzalsRoh- und Werkstoff, 22(11): 418-423 (in German). |
| [43] | Bohannan, B. 1966. Effect of size on bending strength of wood members. USDA, Forest Service, For. Prod. Lab., Research Paper FPL 56, Madison, Wis. |
| [44] | Schneeweiß, G. 1969. Infuence of Dimensions on the Bending Strength of Wooden Beams. HolzalsRoh- und Werkstoff, 27(1): 23-29 (in German). |
| [45] | Madsen, B. and Buchanan, A.H. 1986. Size effects in timber explained by a modified weakest link theory. Can. J. Civ. Eng., 13(2): 218-232. |
| [46] | Madsen, B. 1990. Size effects in defect-free Douglas fir. Can. J. Civ. Eng., 17(2): 238-242. |
| [47] | Madsen, B. and Tomoi, M. 1991. Size effects occurring in defect-free spruce-pine-fir bending specimens. Can. J. Civ. Eng., 18(10): 637-643. |
| [48] | Chaplin, C.J. and Nevard, E.H. 1937. Strength Tests of Structural Timbers, Part 3. Development of Save Loads and Stresses, with Data on Baltic Redwood and Eastern Canadian Spruce. For. Prod. Res. Rec. No. 15, Her Majesty´s Stationary Office, London, England. |
| [49] | Thunell, B. 1944. Effect of Certain Quality Influencing Factors on the Bending Strength of Swedish Redwood. SvenskTräforskningsinstitutet, TrätekniskaAvdelningen, Medd. No. 1, Stockholm (in Swedish). |
| [50] | Denzler, J.K. 2007. Modelling of the Size Effect of Spruce Subjected to Bending. Dr. thesis, Techn. Univ. München, Deutschland (in German). |
| [51] | Schneeweiß, G. 1966. Influence of the Chain Length on the Final Load of Chains. Materialprüfung, 8(6): 217-222 (in German). |
| [52] | Schneeweiß, G. 1970. Contribution to the Statistical Description of the Size Effect on the Stength Behaviour of Different Materials. Habilitationsschrift, Techn. Univ. Wien, Österreich (in German). |
| [53] | Schneeweiß, G. 1973. The Quasi-Brittle Fracture of Steels as a Problem of the Stochastics of Materials.ArchivEisenhüttenwesen, 44(2): 119-124 (in German). |
| [54] | Schneeweiß, G. 1962. Shear Fracture of Wooden Beams Sujected to Bending Stresses. Holzforschung und Holzverwertung, 14(3): 41-47 (in German). |
| [55] | Barrett, J.D., Lam, F., and Lau, W. 1995. Size effects in visually graded softwood structural lumber. J. of Materials in Civil Engineering, 7(1): 19-30. |
| [56] | Baumann, R. 1922. Previous Results of Tests on Wood in the Materials Testing Laboratory of the Technical University Stuttgart. Forschungsarbeiten auf dem Gebiete des Ingenieurwesens, No. 231, Verlag des VDI, Berlin (in German). |
| [57] | Kollmann, F. 1951. Technology of Wood and Wooden Materials, 2. Ed., Vol. 1. Springer Verlag: Berlin, Göttingen, Heidelberg, Reprint 1982 (in German). |
| [58] | Kollmann, F.F.P. and Côté, W.A., Jr. 1968. Principles of Wood Science and Technology. Vol. I, Solid Wood. Springer-Verlag, Berlin, Heidelberg, New York. |
| [59] | Ylinen, A. 1945. Determining the Stresses and Deflections of Wooden Beams with Rectangual Cross-Section. The Royal Swedish Institute for Engineering Research, Proceedings No. 182, Stockholm (IVA, handlingar No. 182) (in German). |
| [60] | Bechtel, S.C. and Norris, C.B. 1959. Strength of wood beams of rectangular cross section as affected by span-depth ratio. USDA, Forest Service, For. Prod. Lab., Rept. No. 1910, Madison, Wis. |
| [61] | Kühne, H., Fischer, H., Vodoz, J., and Wagner, Th. 1955. About the Influence of Water Content, Density, Grain Direction, and Annual Ring Position on Strength and Deformability of Swiss Spruce, Fir, Larch, European Beech, and Oak. Eidgenössische Materialprüfungs- und Versuchsanstalt für Industrie, Bauwesen und Gewerbe, Zürich, Schweiz, Bericht No. 183, Februar (in German). |
| [62] | Madsen, B. and Nielsen, P.C. 1976. In-grade testing: size investigation on lumber subjected to bending. Structural Research Series Report No. 15, Department of Civil Engineering, University of British Columbia, Vancouver, Canada. |
| [63] | Ehlbeck, J. and Colling, F. 1987. The Bending Strength of Glued Laminated Beams in Dependence of the Properties of the Board Lamination. bauenmitholz, 89(10): 646, 651-655 (in German). |
| [64] | Kessel, M.H. 1990. Strength Tests on Oak Beams. bauenmitholz, 92(3): 174-180 (in German). |
| [65] | Madsen, B. 1992. Structural Behaviour of Timber. Timber Engineering Ltd., North Vancouver, British Columbia, Canada. |
| [66] | Duhamel du Monceau, H.L. 1767. About Transport, Conservation, and Strength of Wood, Book V: About the Strength of Wood, on the One Hand Pieces, on the Other Hand Assemblies, Both with Different Sizes. L. F. Delatour, Paris (in French). |
| [67] | Nördlinger, H. 1860. Technical Properties of Wood. J. G. Cotta'scherVerlag, Stuttgart (in German). |
| [68] | Wijkander, A. 1897. Determination of the Strength Properties of Swedish Wood Types Performed in the Material Testing Laboratory of the Chalmers Institute. Bihang till TekniskaSamfundetsHandlingar, No. 11, Göteborg, S. 7-13 (in German). |
| [69] | Rudeloff, M. 1899. The Present State of Wood Research and of the Standardization of Testing Procedures. Mittheilungen aus den Königlichen technischen Versuchsanstalten zu Berlin, 17. Jahrgang, Verlag von Julius Springer, Berlin (in German). |
| [70] | Tetmajer, L. 1896. Methods and Results of the Tests on Swiss Construction Timbers. Mitteilungen derMaterialprüfungs-Anstalt am schweiz. Polytechnikum in Zürich, 2. Auflage, Heft II, Zürich (in German). |
| [71] | Grotta, A.T., Leichti, R.J., Gartner, B.L., and Johnson, G.R. 2005. Effect of growth ring orientation and placement of earlywood and latewood on MOE and MOR of very-small clear Douglas-fir beams. Wood and Fiber Science, 37(2): 207-212. |
| [72] | Markwardt, L.J. and Wilson, T.R.C. 1935. Strength and related properties of wood grown in the United States. Forest Products Laboratory, Division of Research, Forest Service, USDA Washington, D.C., Technical Bulletin, No. 479, Sept. |
| [73] | Forsaith, C.C. 1933. The Strength Properties of Small Beams (Match Stick Size) of Southern Yellow Pine. Bulletin of the N.Y. State College of Forestry at Syracuse University, Vol. 6, November, Technical Publication No. 42. |
| [74] | Casati, E. 1932. Tests Comparing Specimens with Different Dimensions for Some Species of Wood. International Association for Testing Materials. Congrès de Zurich, Tome II, 1931 (Editions A.I.E.M., Zurich) (in French). |
| [75] | Küch, W. 1937. Tests on Pine Wood. Luftwissen, 4(8): 254-255 (in German). |
| [76] | Biblis, E.J. 1971. Flexural Properties of Southern Yellow Pine Small Beams Loaded on True Radial and Tangential Surfaces. Wood Science and Technology, 5(2): 95-100. |
| [77] | Carrington, H. 1922. Young’s Modulus and Poisson’s Ratio for Spruce. Philosophical Magazine and Journal of Science, Ser. 6, 43(257): 871-878. |
| [78] | Kollmann, F. 1941. The Ash and its Wood. Verlag von Julius Springer, Berlin (in German). |
| [79] | Weiskopf, A. 1913. Hard Wood for Fabrication of Train Carriages. AnnalenfürGewerbe und Bauwesen, 72(6): 102-109, 72(7): 117-125, 72(8): 142-150 (in German). |
| [80] | Gehri, E. 1997. Timber in compression perpendicular to grain. Int. Conf. of IUFRO S 5.02 Timber Engineering. Copenhagen, Denmark, 16-17 June 1997, pp. 355-374. |
| [81] | Bodig, J. 1965. The effect of anatomy on the initial stress/strain relationship in transverse compression. For. Prod. J., 19(5): 197-202. |
| [82] | Huber, B. and Prütz, G. 1938. About the Percentage of Fibers, Tracheas, and Parenchyma on the Composition of Different Wood. HolzalsRoh- und Werkstoff, 1(10): 377-381 (in German). |
| [83] | Rothmund, A. 1944. About the Resistance of Wood Against Pressure Perpendicular to Grain. Dr. thesis, Techn. Hochschule Stuttgart, Deutschland (in German). |
| [84] | Rothmund, A. 1949. About the Resistance of Wood Against Pressure Perpendicular to Grain. Bauplanung und Bautechnik, 3(12): 393-398 (in German). |
| [85] | Kennedy, R.W. 1968. Wood in Transverse Compression. For. Prod. J., 18(3): 36-40. |
| [86] | Ellis, S. and Steiner, P. 2002. The behaviour of five wood species in compression. IAWA Journal, 23(2): 201-211. |
| [87] | Madsen, B., Hooley, R.F., and Hall, C. 1982. A design method for bearing stresses in wood. Can. J. Civ. Eng., 9(2): 338-349. |
| [88] | Staudacher, E. 1936. Building Material Wood. Contributions to the Knowledge of Material Properties and Structural Elements. Promotionsarbeit, ETH Zürich, Gebr. Leemann& Co., Zürich (in German). |
| [89] | Gaber, E. 1940. Compression Tests Perpendicular to Grain on Soft- and Hardwood. HolzalsRoh- und Werkstoff, 3(7/8): 222-226 (in German). |
| [90] | Perelygin, L.M. 1965. Science of Wood. Drevesinovedenie, translated from the Russian by A. Gladstein. Higher School Publ. House, Moscow,199 p. |
| [91] | Mönck, W. and Rug, W. 2000. Building in Timber: Design and Construction Considering Eurocode 5. 14. Aufl., VerlagBauwesen, Berlin (in German). |
| [92] | Frey-Wyßling, A. and Stüßi, F. 1948. Strength and Deformation of Softwood Perpendicular to Grain. SchweizerischeZeitschriftfürForstwesen, 99(3): 106-114 (in German). |
| [93] | Roš, M. 1937. Wood as Building Material. In: I. Schweizerischer Kongreß zur Förderung der Holzverwertung, Bern, Schweiz, 27.-31. Oktober 1936, pp. 32-72 (in German). |
| [94] | Thunell, B. 1941. Strength Properties of Swedish Pine-Wood as Determined from Small Clear Specimens. The Royal Swedish Institute for Engineering Research, Proceedings No. 161, Stockholm, Sverige, 45 p. (IVA Handlingar No. 161). |
| [95] | Tabarsa, T. and Chui, Y.H. 2001. Characterizing microscopic behavior of wood under transverse compression, part II. Effect of species and loading direction. Wood and Fiber Science, 33(2): 223-232. |
| [96] | Kretschmann, D.E. 2008. Influence of Juvenile Wood Content on Shear Parallel, Compression, and Tension Transverse to Grain Strength and Mode I Fracture Toughness for Loblolly Pine. USDA, Forest Service, For. Prod. Lab., Research Paper FPL-RP-647, 25 p., Madison, Wis. |
| [97] | Szalai, J. 1992. Indirect Determination of Shearing Strength of Wood Using the Anisotropic Strength Theory. HolzalsRoh- und Werkstoff, 50(6): 233-238 (in German). |
| [98] | Gindl, W., Müller, U., and Teischinger, A. 2003. Transverse compression strength and fracture of spruce wood modified by melamine-formaldehyde impregnation of cell walls. Wood and Fiber Science, 35(2): 239-246. |
| [99] | Sumiya, K., Kawagoe, N., and Sugihara, H. 1960. On the Size Effect in the Compression Strength of Hinoki. Wood Research, Bulletin of the Wood Research Institute, Kyoto Univ., Kyoto, Japan, No. 24, September, pp. 46-48. |
| [100] | Ethington, R.L., Eskelsen, V., and Gupta, R. 1996. Relationship between compression strength perpendicular to grain and ring orientation. For. Prod. J., 46(1): 84-86. |
| [101] | Hoffmeyer, P., Damkilde, L., and Pedersen, T.N. 2000. Structural Timber and Glulam in Compression Perpendicular to Grain. HolzalsRoh- und Werkstoff, 58(1/2): 73-85. |
| [102] | Exner, W.F. 1871. Mechanical Technology of Wood, Vol. 1, 1st Part: Mechanical Technological Properties of Wood. W. Braumüller, Wien, Österreich (translation and revision of Chevandier, E. and Wertheim, G.: Mémoiresur les propriétésmécanique du bois. Paris, 1846) (in German). |
| [103] | Wakefield, W.E. 1957. Determination of the Strength Properties and Physical Characteristics of Canadian Wood. Can. Dept. of Northern Affairs and National Resources. Canadian Forestry Service, Bulletin, No. 119, 64 pp. |
| [104] | Lourenço, P.B., Feio, A.O., and Machado, J.S. 2007. Chestnut wood in compression perpendicular to grain: Non-destructive correlations for test results in new and old wood. Construction and Building Materials, 21(8): 1617-1627. |
| [105] | Föppl, A. 1904. The Compression Strength of Wood Perpendicular to Grain. Mitteilungen aus dem mechanisch-technischen Laboratorium der k. Technischen Hochschule München, Neue Folge, No. 29, Theodor Ackermann, München (in German). |
| [106] | Schwab, E. 1986. Characteristic of the Behaviour of Hardwood Perpendicular to Grain. HolzalsRoh- und Werkstoff, 44(7): 259-263 (in German). |
| [107] | Ljungdahl, J., Berglund, L.A., and Burman, M. 2006. Transverse anisotropy of compressive failure in European oak – a digital speckle photography study. Holzforschung, 60(2): 190-195. |
| [108] | Kunesh, R.H. 1968. Strength and elastic properties of wood in transverse compression. For. Prod. J., 18(1): 65-72. |
| [109] | Nairn, J.A. 2006. Numerical Simulations of Transverse Compression and Densification in Wood. Wood and Fiber Science, 38(4): 576-591. |