-
Paper Information
- Next Paper
- Previous Paper
- Paper Submission
-
Journal Information
- About This Journal
- Editorial Board
- Current Issue
- Archive
- Author Guidelines
- Contact Us
American Journal of Materials Science
p-ISSN: 2162-9382 e-ISSN: 2162-8424
2012; 2(6): 171-175
doi: 10.5923/j.materials.20120206.02
Dielectric Properties of Biocompatible and Biodegradable Polycaprolone and Polylactide and Their Nanocomposites in the Millimeter Wave Band
 Abstract
 Reference
 Full-Text PDF
 Full-Text HTML
V. V. Meriakri1, D. S. Kalenov1, M. P. Parkhomenko1, S. Zhou2, N. A. Fedoseev1
1Kotel'nikov Institute of Radio Engineering and Electronics, Russian Academy of Sciences, Fryazino Branch, 1 Vvedenskii sq., Fryazino, Moscow region, 141190 Russia
2Southwest Jiaotong University, School of Materials Science and Engineering 111, 1st Section, Northern 2nd Ring Road, Chengdu, Suchan, CN 610031,China
Correspondence to: V. V. Meriakri, Kotel'nikov Institute of Radio Engineering and Electronics, Russian Academy of Sciences, Fryazino Branch, 1 Vvedenskii sq., Fryazino, Moscow region, 141190 Russia.
| Email: |  |
Copyright © 2012 Scientific & Academic Publishing. All Rights Reserved.
Dielectric properties of biocompatible and biodegradable poly-ε-caprolone (PCL) and polylactide (PLA), as well as their nanocomposites, are measured in the millimeter (MM) wave band. It is found that the complex dielectric permittivity of PCL and its nanocomposites increases with temperature in the interval from 40 to 50℃, while that of PLA and its nanocomposites increases in the interval from 85 to 90℃. The samples of PLA with carbon nanotubes prepared with melamine show much lower absorption compared with the same samples prepared without melamine. The latter fact can be attributed to the formation of clusters of nanotubes in these samples.
Keywords: Applications, Biocompatibility, Biodegradable, Dielectric Properties, Nanostructured Polymers
Cite this paper: V. V. Meriakri, D. S. Kalenov, M. P. Parkhomenko, S. Zhou, N. A. Fedoseev, "Dielectric Properties of Biocompatible and Biodegradable Polycaprolone and Polylactide and Their Nanocomposites in the Millimeter Wave Band", American Journal of Materials Science, Vol. 2 No. 6, 2012, pp. 171-175. doi: 10.5923/j.materials.20120206.02.
Article Outline
1. Introduction
- Polycaprolone (PCL) and polylactide (PLA) are widely used in biomedicine for wound covering and prosthetics, including tooth implantation[1, 2]. The main advantages of these materials are their biocompatibility and slow degradation accompanied by release of water and carbon dioxide; the latter fact makes these polymers a perfect ecologically pure packing material. Therefore, the study of the electrical and dielectric properties of these materials, in particular, the absorption of electromagnetic waves of different frequency bands, is of great scientific and practical interest. Data on the preparation process and material characterization, including dielectric properties of PCL and PLA, are presented elsewhere [3
 16]; for example, data on the dielectric properties of pure PCL and PLA at frequencies from
  to 106 Hz[3,4], and data on the properties of PLA in the frequency band 0.5–10 GHz[5]. However, there are no data on the dielectric properties of PCL and PLA and their nanocomposites in the millimeter (MM) wave band. The importance of these data is associated, in particular, with a recent increase in the application of MM waves in medicine [29]. We have measured for the first time the dielectricproperties of crosslinked poly-ε-caprolone (cPCL) and PLA, as well as their composites with carbon nanotubes (CNTs), in the frequency range from 85 to 118 GHz and in the range of temperatures from 20 to 90℃.
2. Materials
- 1. The samples of crosslinked poly-ε-caprolone (cPCL) and its nanocomposites were fabricated at the Southwest Jiaotong University, Chengdu, PRC [26] by the reaction of PCL diol with methacrylic anhydride [27]. 2. The samples of PLA and its nanocomposites were fabricated at the École Nationale Supérieure de Chimie de Lille, France. The synthesis of PLA was done by reactive extrusion via ring opening polymerization of L,L-lactide using a continuous single-stage process [28].
3. Measurement Methods
- The propagation constant
 of electromagnetic waves traveling in an infinite medium with complex refractive index
 is given by
  | (1) |
 (Np/m) and the phase constant
 are related to the real n and imaginary κ parts of the refractive index by the formulas
  | (2) |
 | (3) |
 is the wavenumber in vacuum and λ is the wavelength in vacuum. Thus, having determined
  and
and  experimentally, we can find the parameters n and κ of the medium under test. The measurements were carried out in the range of frequencies from 85 to 118 GHz by a panoramic VSWR and attenuation meter based on an RG4-14 oscillator. The block-diagram of the setup is shown in Figure 1.
 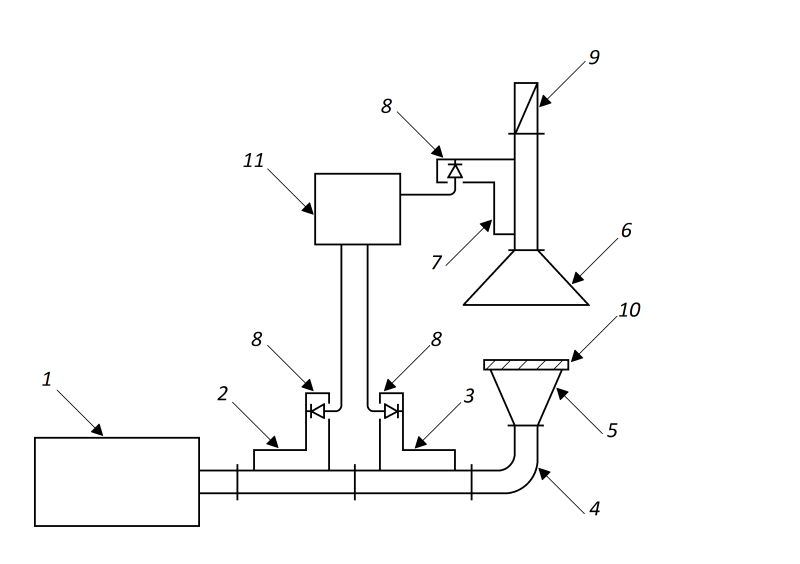 | Figure 1. Block diagram of the setup |
 | (4) |
 | (5) |
 is the propagation constant in vacuum (in air).From (4) we can determine the decay constant α in the medium:
 | (6) |
 into (2), we obtain the imaginary part κ of the refractive index of the sample:
  | (7) |
 | (8) |
 | (9) |
 of the medium is related to its complex refractive index
  by the formula
  , from which we obtain an expression for determining the real ε1 and imaginary ε2 parts of the dielectric constant of the sample under test:
  | (10) |
 | (11) |
4. Measurement Results
4.1. Investigation of Samples of cPCL and Its Nanocomposites

 GHz, we also observed an increase in ε2 in this temperature interval with a maximum at T = 45℃ in all the samples. The results of these measurements are presented in Table 1. Note that, within the measurement accuracy (3% for n and 15% for κ), we did not observe any dielectric dispersion in this frequency band. Table 1 shows that the maximal increase in κ and ε2 is caused by the introduction of carbon nanotubes into cPCL. The introduction of Fe3O4 did not lead to a noticeable change in the absorption of the samples.
4.2. Investigation of Samples of PLA and Its Nanocomposites
- The results of the measurements of the dielectric properties of PLA and its nanocomposites are presented in Table 2. Here sample 1 is pure PLA, sample 2 is PLA prepared with 1% of MWNT of diameter 40 – 60 nm, and length of 515 m with melamine and sample 3, PLA prepared with 1% of the same MWNT without melamine. The measurements were carried out in the same frequency band as those of the cPCL samples but in a larger temperature interval (T = 25–90℃), because, in the temperature interval of 50–90℃, the authors of [3] observed an increase in the ε2 of pure PLA with a maximum at 85℃. We also observed an increase in ε2 in all the samples (pure PLA and its nanocomposites) in this temperature interval.
|

5. Discussion
5.1. Samples of cPCL and Its Nanocomposites
- Earlier we have investigated the dielectric characteristics of samples 1
 4 at frequencies from
  to 2 106Hz by a BDS40 broadband dielectric spectrometer (Novocontrol) [10]. The results of these measurements are presented in Figures 2
 5.
5. 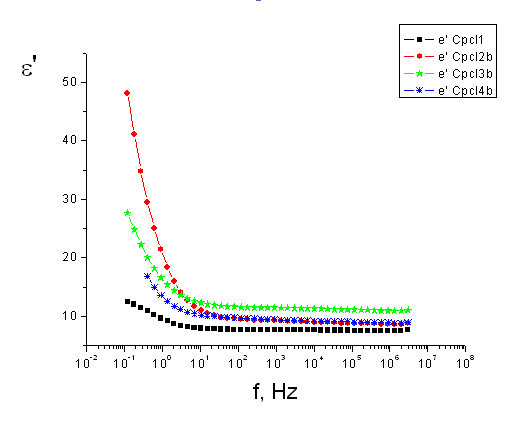 | Figure 2. Real part of permittivity of cPCL and its nanocomposites at frequencies  Hz Hz |
 10 Hz. For all samples, ε1 measured at frequencies about 3•106 Hz is greater than the values of ε1 obtained in our MM wave measurements (ε1 = 7
 13 at 3•106 Hz for nanocomposites and 6 for pure cPCL). This means that there is a marked dispersion of ε1 in all samples at frequencies from 3•106 Hz to 80 GHz.
 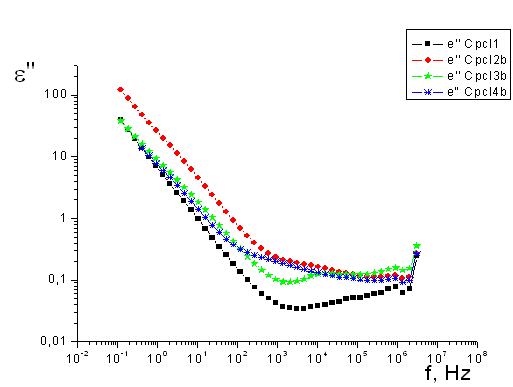 | Figure 3. Imaginary part of permittivity of cPCL and its nanocomposites at frequencies  Hz Hz |
 3•106 Hz without regard to conductivity σ.
 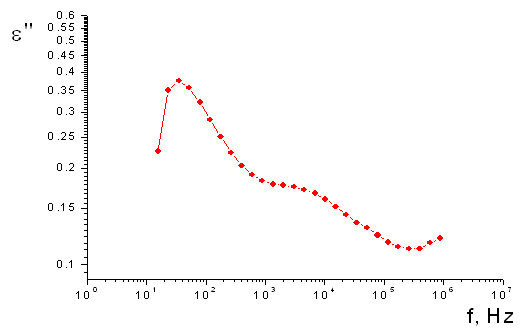 | Figure 4. Imaginary part of permittivity of sample 2 at frequencies  Hz without regard to conductivity σ Hz without regard to conductivity σ |
 | Figure 5. Imaginary part of permittivity of sample 1 at frequencies  Hz without regard to conductivity σ Hz without regard to conductivity σ |
5.2. Samples of PLA and Its Nanocomposites
- These samples were investigated by TEM microscopy at the École Nationale Supérieure de Chimie de Lille, France, by professor S. Bourbigot. Figures 6 and 7 present 200 nm TEM microscope images of the samples of PLA+1%MWNT (without melamine) and PLA+1%MWNT (with melamine), respectively. The sample of PLA+1%MWNT (with melamine) is characterized by a much more uniform distribution of MWNT without aggregation of nanoparticles compared with the sample of PLA+1%MWNT (without melamine). This is the reason for the difference in ε2 of these two samples in Table 2. Measurements of the dielectric properties of PLA+1%MWNT (without melamine) and PLA+1%MWNT (with melamine) by the resonance method at frequency of 11 GHz [10] confirmed the difference between the absorption in these two samples. The dielectric permittivity of PLA+1%MWNT (without melamine) at frequency of 11 GHz is 1 = 9.16 and 2 = 3.23. The dielectric permittivity of a PLA+1%MWNT (with melamine) at frequency of 11 GHz is 1 = 4.36 and 2 = 0.30.
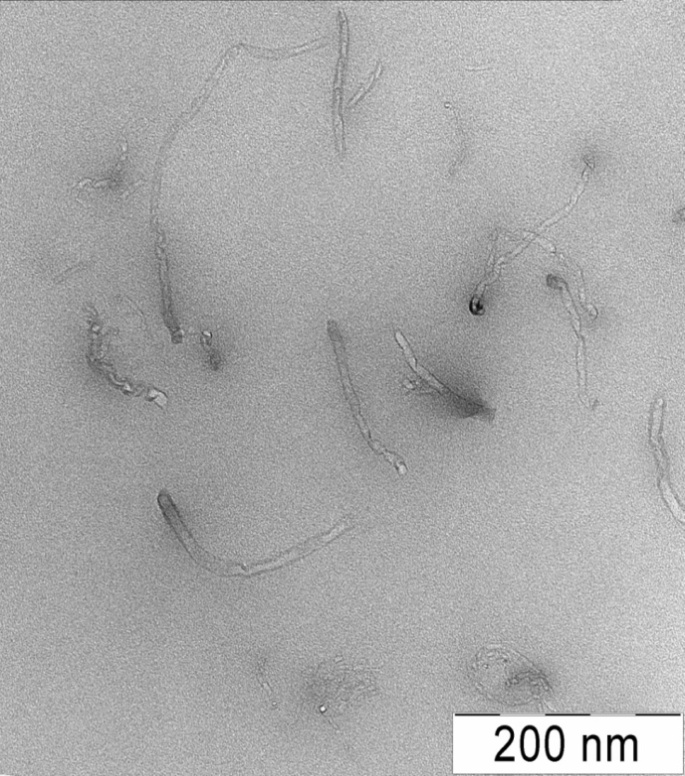 | Figure 6. TEM microscopy picture of PLA+1%MWNT (without melamine) sample |
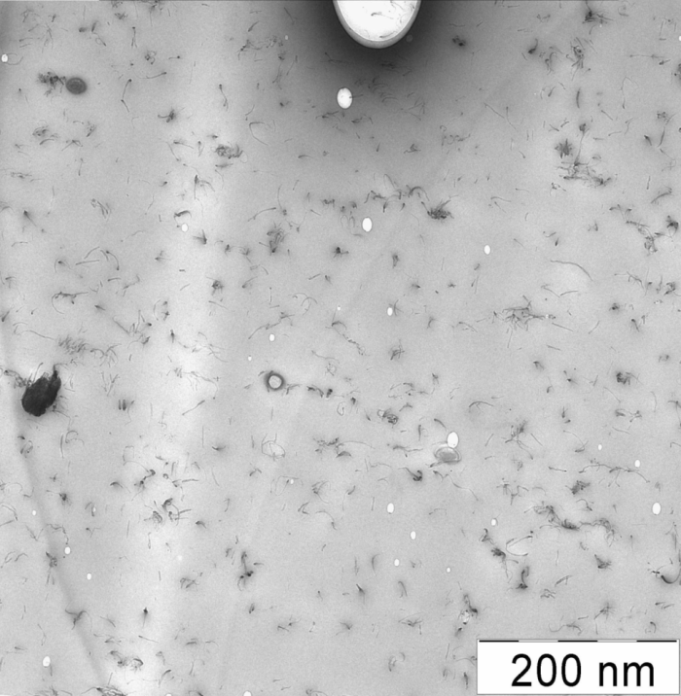 | Figure 7. TEM microscopy picture of PLA+1%MWNT (with melamine) sample |
6. Conclusions
- We have carried out the measurements of the dielectric properties of biocompatible and biodegradable crosslinked polycaprolone and polylactide polymers and their nanocomposites at frequencies from 85 to 118 GHz and in the temperature interval in which the samples show considerable dependence of absorption of electromagnetic waves on temperature. We have found that the complex dielectric permittivity of PCL and its nanocomposites increases with temperature in the interval from 40 to 50℃, while that of PLA and its nanocomposites increases in the interval from 85 to 90℃. The samples of PLA with carbon nanotubes prepared with melamine show much lower absorption compared with the same samples prepared without melamine. The latter fact can be attributed to the formation of clusters of nanotubes in these samples.These materials may find application, in particular, in medical diagnostics and therapy with the use of MM waves [29].
ACKNOWLEDGEMENTS
- We are grateful to Professor S. Bourbigot for supplying and TEM microscopy investigation of PLA samples and useful discussions.This work was supported by the Russian Foundation for Basic Research, project nos. 10-02-13310-RT_OMN and 11-02-93965-YuAR_a.
References
| [1] | A.P. Gupta and V. Kumar: Eur. Polymer J. 43 (2007)  . . |
| [2] | Y. Ikada and A. Tsuji: Macromolecular Rapid Communications, 21 (2000) 117–150. |
| [3] | J.L.E. Ivirico, J.M.M. Dueñas, A.A. Balado, J.L.G. Ribelles and M.S. Sánchez: J. Polymer Sci. Part B: Polymer Phys. 47 (2009) 183–193. |
| [4] | Nor'aini Ahmad Zawawi, Alyani Ismail, Abdan Khalina, and Mohd Adzir Mahdi: Key Engineering Materials 471 472 (2011) 472 (2011)  |
| [5] | P.Syroukal, M. Konty, V. Skelarik, P. Kucharczyk, 6th Int. Conference on Times of Polymers (TOP) and Composites AIP Conference Proceedings 1459 (2012), Ishia, Italy, 20 22. 22. |
| [6] | J. Baschnagel: 2 Int. Workshop “Nonlinear Response of Soft Matter” Konstanz, Germany (2011) 70 71. 71. |
| [7] | A. Bur, Y. Lee, S. Roth, P. Srart: Polymer 46 (24): (2005) 10908 10918. 10918. |
| [8] | E Laredo: 6th Int. Conf. on Broadband Dielectric Spectroscopy and its Applications, Book of Abstracts, Madrid, Spain (2010) 121. |
| [9] | D. Wu, Y. Yang, M. Zhang, W. Yu: Biomolecules, 10, (2009) 417; A. Bello, M. Grimao, E. Laredo, D. Wu: 6th Int. Conf. on Broadband Dielectric Spectroscopy and its Applications, Book of Abstracts, Madrid, Spain (2010) 287. |
| [10] | V.V. Meriakri, I.A. Chmutin, N.V. Rivkina, S. Zhou, Materials of Int. Conf. ACN’2911 Advanced Carbon Nanomaterials, P 2.29, S. (2011) St. Petersburg, Russia 137. |
| [11] | Arrese-Igor, A, Alegrio, J. Moreno, J. Colmenaro: Macromolecules (2010) 44, 3611. |
| [12] | W. Coffey, Yu. Kalmykov, S. Titov: NATO Advanced Research Workshop “Broadband Dielectric Spectroscopy and its Advanced Technological Application”, Perpignan, France, (2011), 22. |
| [13] | K. Fukshima, C. Abbate, D. Iobuani, M. Gennari, G. Camjno: Polymer Degrad. Stabil. (2009) 94, 1646 1655. 1655. |
| [14] | K. Fukshima, D. Iobuani, C. Abbate, M. Areno, P. Pizzerelli: Polymer J. (2011) 47, 139 152. 152. |
| [15] | C. Zhang, H. Lu: J. Material Science, Materials in Medicine (2010) 21, 3077 3081. 3081. |
| [16] | O. Russo, B. Vetrano, D. Aciemo 6th Int. Conf. on Times of Polymers (TOP) and Composites AIP Conference Proceedings 1459 (2012), Ischia, Italy, 23 25. 25. |
| [17] | D. Kalenov, V. Meriakri, M. Parkhomenko Sh. Zhou: 6th Int. Conf. on Times of Polymers (TOP) and Composites AIP Conference Proceedings 1459 (2012), Ischia, Italy, 77 79. 79. |
| [18] | Bourbigot, M. Delichatios, V. Meriakri, I .Nikitin, M. Parkhomenko: Conference STEPI 8,(2008) Montpepier, France P 47. |
| [19] | B. Bisceglia, P. Leo, A. Pastore, S. von Gratowski, V. Meriakri: Journal of Microwave Power and Electromagnetic Energy (2011) 45 (1) 1 13. 13. |
| [20] | V.V. Meriakri, E.E. Chigrai, M.P. Parkhomenko: 6th Int. Conf. on Broadband Dielectric Spectroscopy and Its Applications, Book of Abstracts, Madrid, Spain (2010) 163. |
| [21] | V.V. Meriakri, M.P. Parkhomenko, E.E. Chigryai, I.P. Nikitin, C.L. Pan, R.P. Pan: 2010 Int. Kharkov Symposium on Physics and Engineering of Microwaves, Millimeter and Submillimeter Waves, IEEE Catalog Number: CFP10780-CDR, ISBN: 978-1-4244-7898-9, INV-4, Kharkov, Ukraine (2010) 10 14. 14. |
| [22] | V. Meriakri, E. Chigryai, and I.P. Nikitin: Int. THz Conference, Villach, Austria (2011) 143 147. 147. |
| [23] | V.V. Meriakri, E.E. Chigrai, I.P. Nikitin, M.P. Parkhomenko, S.V. von Gratowskl: NATO Advanced Research Workshop “Broadband Dielectric Spectroscopy and Its Advanced Technological Application,” Perpignan, France ( 2011) 48. |
| [24] | V. Meriakri, E. Chigryai, M. Parkhomenko, R. Denisyuk, S. von Gratowski: Journal of Biofuels (2011) 2 (1), 8 13. 13. |
| [25] | V.V. Meriakri, M.P. Parkhomenko, E.E. Chigryai, I.P. Nikitin, C.L. Pan, R.P. Pan, Liquid Crystals (2010) 37 (11), 1453 1457. 1457. |
| [26] | Xiaotong Zheng, Shaobing Zhou, Yu Xiao, Xiongjun Yu, Xiaohong Li, PeizhuoWu, Colloids and Surfaces B: Biointerfaces (2009) 71, 67 72. 72. |
| [27] | J.L.E. Ivirico, M.S. Sánchez, R. Sabater i Serra, J.M.M. Dueñas, J.L.G. Ribelles, M.M. Pradas: Macromol. Chem. Phys. (2006) 207, 2195 2205. 2205. |
| [28] | S. Bourbigot, G. Fontaine, A. Gallos, S. Bellayer, Polymers for Advanced Technologies (2011) 22 (1), 30 37. 37. |
| [29] | O.V. Betskii, N.D. Devyatkov and V.V. Kislov: Biomedical Radio Engineering (1998) 4, 19–29 (in Russian). |