Solomon C. Udensi
Department of Physics, Federal University of Technology Owerri, P.M.B. 1526 Owerri, Imo State, Nigeria
Correspondence to: Solomon C. Udensi , Department of Physics, Federal University of Technology Owerri, P.M.B. 1526 Owerri, Imo State, Nigeria.
| Email: |  |
Copyright © 2012 Scientific & Academic Publishing. All Rights Reserved.
Abstract
Two different powder samples of ZnO with minuscule additives, of Bi2O3 and Sb2O3 were prepared through ball milling, in solutions containing deionized water and polyvinyl alcohol (PVA) using zirconia balls. The powder samples were sieved to obtain particle size ranges of ≤ 38μm (Z, ZB, ZBS) and ≤ 63μm (Z1, ZB1, ZBS1). The sample pellets were sintered at 800℃/60mins and 1100℃/600mins and their microstructures examined using SEM and X-ray for densification and coarsening kinetics. Grain growths were observed for samples ZB and ZB1 at both temperatures due to the formation of bismuth-rich liquid phase, whereas for ZBS and ZBS1 grains growths were hindered because of the enclosure of spinel phase which pinned grain boundary motion. SEM micrographs show high densities for particle size range of ≤ 38μm at both temperatures, while for particle size range of ≤ 63μm, densification was highest at 1100℃/600mins.The decisive parameters which controlled densification were found to be temperature, sintering time and particle geometry. In the cases where all three parameters were utilized (Z, ZB, ZBS at 1100℃/600mins), denser materials were obtained. Also equal masses of representative samples of ZB and ZB1 were seen to be electrically comparable from the nonlinear plot.
Keywords:
Ceramics, Particle size, Green body, Grain boundary, Pyrochlore-type, Bismuth-rich
Cite this paper:
Solomon C. Udensi , "Comparative Studies of The Effect of Particle Size on the Microstructural Characteristics of Bi2O3 and Sb2O3 Additives on Sintered Zno Ceramics", American Journal of Materials Science, Vol. 2 No. 5, 2012, pp. 153-159. doi: 10.5923/j.materials.20120205.04.
1. Introduction
Density controlled materials and components from metals and/or ceramic powder compacts are usually prepared by sintering processes, which involve the application of thermal energy. Generally, sintering seeks to produce and reproduce materials with tailored microstructures. Tailoring these microstructures implies controlling the particle grain sizes, sintered densities, including ‘size distribution’ of other phases, such as pores. For optimum sinterability of any green body, the range of the powder particle sizes, as reported widely, should be between 0.1 and 100µm representing a total surface energy range of 500 and 0.5 J/mole[1] respectively. However, the change in energy during oxide formation ranges between 300 and 1500KJ/mole. Therefore in order to strike a balance between the total surface energy of the powder and that for the oxide formation, a series of optimization is required so as to control variables necessary for sintering.  | (1) |
Both radii are connected by the equation, r2 = ᴧr1. For the initial stage of sintering (there usually three stages), the exponent, α, are shown to be 3, 4, 1, and 4 respectively for lattice diffusion, grain boundary diffusion, viscous flow, and surface diffusion. Furthermore, capillary pressure difference originating from difference in particle curvatures, diffusivity, viscosity etc., which are temperature dependent variables, had been identified to be important driving forces for sintering[1].Yttria - stabilized Zirconia (YSZ), Zirconia (ZrO2) and alumina (Al2O3) balls are known for their “hard-to-wear property” and so are used where less contaminant are estimated during milling[4-6]. For this work Zirconia balls were used. Literatures which have reported studies on sintered ZnO and its derivatives seem, to my knowledge, to have left out comparative investigations on the effect of particle sizes and/or of temperature on the microstructure of polished-etched surfaces of ZnO. This study is necessary, if we want to produce functional technical ceramics with exceptional mechanical, electronic, optical, thermal etc. properties, which could be employed in work environments (e.g. in electronic, aviation and defence industries) where malfunctions/degradations are not be contemplated. In this paper, reports of analytical investigations using scanning electron microscope (SEM), energy dispersive X-ray (EDX), and X-ray diffraction (XRD) etc. are presented.
2. Experimental
2.1. Materials
150g of three powder samples labelled Z, ZB and ZBS comprising of 100% mol ZnO (Z), 99% mol ZnO plus 1% mol Bi2O3 (ZB) and 98% mol ZnO plus 1% mol Bi2O3 plus 1%mol Sb2O3 (ZBS) respectively were prepared by calculating the proportion by mass of the compounds. Each sample was then mixed with deionized water (little water should be added to avoid sedimentation of the heaviest compound, Sb2O3) and 1% mol polyvinyl alcohol (PVA), a binder, to increase the mechanical strength of the pellets during uniaxial pressing. The resulting slurries were ball-milled (with Zirconia balls) for 1 hr and dried at a modest temperature of 50℃. The dried samples were then ground using agate mortar/pestle and sieved through a 38µm sieve. The same procedure was followed and finally sieved through a 63µm sieve, in this case the three powder samples were labelled Z1, ZB1 and ZBS1. 1.5g of samples Z, ZB, ZBS, Z1, ZB1, and ZBS1 each was respectively pressed into a disc of diameter 1 centimetre by the application of a uniaxial pressure of 100MPa with a Carver laboratory press. The initial height (ho), initial weight (Wo), and the diameter were recorded before calculating the porosity. Three specimens of each sample were then sintered at 800℃ and 1100℃ for 1 hour and 10 hours in a laboratory oven. The percentage contraction (%Δh), percentage weight loss (%ΔW) and final density (% Dens.) were calculated using the data obtained after sintering (i.e. final height (h), final weight (W) and final diameter), with the understanding that the theoretical density of ZnO is 5.78g/cm3[7].
2.2. Sample Preparation
The samples were of two categories, high density samples (sintered at 1100℃ and 800℃ with more than 80% densification) and less density samples (less than or equal to 80% densification). Both groups of the samples were broken into smaller sizes and held firmly in position, in a mould, using an epoxy resin (araldite and hardener in the ratio of 8:2). Unlike the less density samples whose grain boundaries are easily seen, the high density samples were polished on a portable Struers bench polishing machine, using SiC grinding papers and diamond paste of increasing fineness (15, 9, 6, and 1µm) and intermittently cleaned in an ultrasonic bath. The polished surfaces were then etched by dipping them, for 3 minutes, in a solution containing 5M solution of NaOH. Etching reactions were stopped with the use of alcohol to prevent damage being done to the samples. The etched surfaces were sputter-coated with layers of carbon, to aid SEM and EDX studies. The samples were also investigated using powder x-ray diffraction for crystalline phase identification. Also the average grain size (G) of each sample was resolved using Mendelson’s intercept method in stereology[8].
3. Results and Discussion
For a green body to be well sintered, the competition between densification rate and coarsening rate should be made to favour the former. In the case of coarsening, particles’ centres are stationary even though, there is reduction in surface area. So the driving mechanisms for sintering must be lattice diffusion and grain boundary diffusion (once a grain boundary is formed)[1]. If coarsening takes place too rapidly, sintering will not occur because of abrupt reduction in surface area and the consequent increase in convex radii (i.e. assuming that the particles are spherically shaped). Therefore care must be taken to control sample variables and heat treatment process in order to favour densification. Tables 1 and 2 show the results obtained from sintering samples whose mean particle sizes were 38μm and 63μm respectively. Their percentage densifications were also shown in the two multiple bar charts below (figures’ 1 and 2). One could see with ease that the densifications of the samples with mean particle sizes’ of 38μm[9, 10], even though sintered at various temperatures and time were comparatively better than those of 63μm. Furthermore, for both grain sizes, the densifications were greater for those samples sintered at 1100℃ for 10 hours[11] than samples sintered at 800℃. The contractions, samples with 63μm grain sizes had to undergo were also greater than those of 38μm, lending credence to the fact that bigger particle sized samples would have to travel longer distances from the surface to the neck region for densification to occur. Also, in so doing, pores which affect densification were enclosed.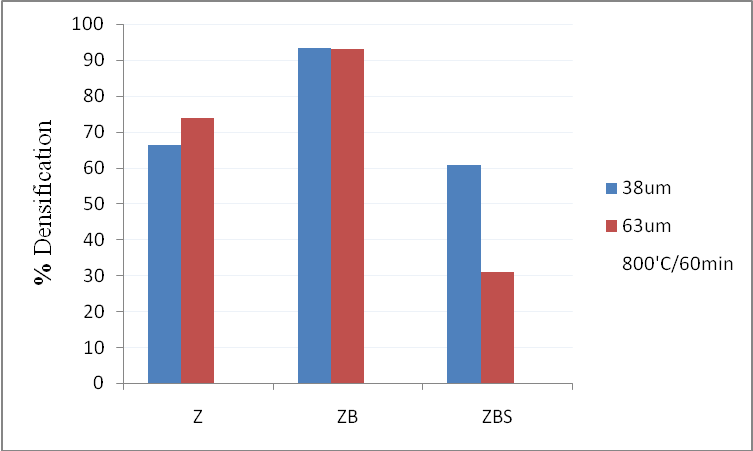 | Figure 1. Densifications Z, ZB, ZBS, Z1, ZB1, ZBS1 at 800℃ for 60mins |
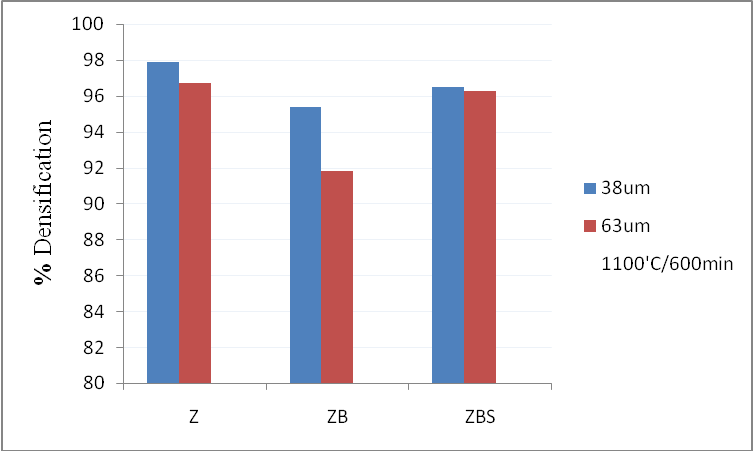 | Figure 2. Densifications Z, ZB, ZBS, Z1, ZB1, ZBS1 at 1100℃ for 600mins |
| Table 1. Results obtained from sintering samples whose mean particle size was 38μm at 800℃/60mins and 1100℃/600mins |
| | Sample (38μm) | T(℃)/t(min) | %Δw | %Δh | %Dens. | G (μm) | | Z | 800/60 | -1.5 | -3.2 | 66.4 | 0.5 | | ZB | -3.1 | -14.2 | 93.3 | 1.7 | | ZBS | -1.2 | -0.7 | 60.6 | 0.2 | | Z | 1100/600 | -2.4 | -16.5 | 97.9 | 11.9 | | ZB | -5.4 | -15.4 | 95.4 | 18.8 | | ZBS | -4.3 | -16.6 | 96.5 | 11.9 |
|
|
| Table 2. Results obtained from sintering samples whose mean particle size was 63μm at 800℃/60mins and 1100℃/600mins |
| | Sample (63μm) | T(℃)/t(min) | %Δw | %Δh | %Dens. | G (μm) | | Z1 | 800/60 | -1.8 | -8.8 | 73.7 | 0.84 | | ZB1 | -2.1 | -13.7 | 93.0 | 2.42 | | ZBS1 | -1.7 | -1.8 | 30.9 | 0.29 | | Z1 | 1100/600 | -1.4 | -16.7 | 96.7 | 22.3 | | ZB1 | -5.4 | -14.7 | 91.8 | 28.2 | | ZBS1 | -4.6 | -16.3 | 96.3 | 22.2 |
|
|
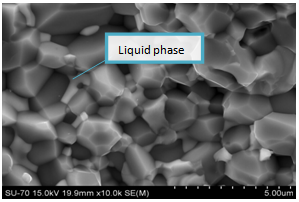
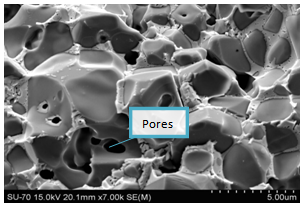
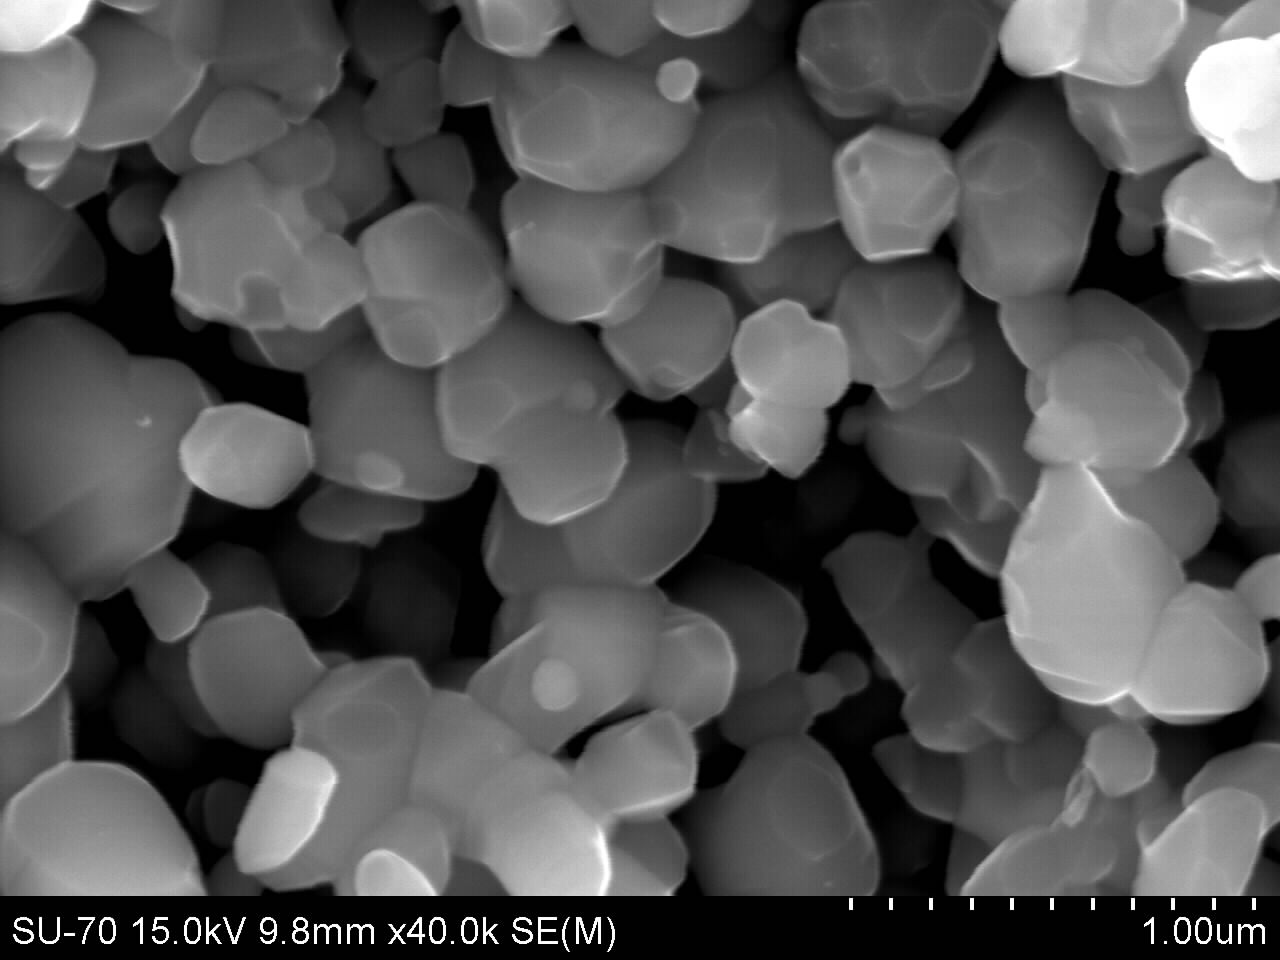
The SEM images of both sample types and sizes are shown below. There is considerable elimination of pores. This mainly is due to the application of pressure, during pressing into smaller discs/pellets. However, there are more pores in samples with particle sizes of 63μm; this is because of abnormal grain growth which made it difficult to eliminate pores. The sample of figure 4 (i.e. 63μm) attained higher density than that of figure 3 (i.e. 38μm), even though with higher porosity occasioned by bigger particle size. This is because good densification requires more time and high temperatures. Figures 5 and 6 are the micrographs whose samples (ZnO) contain 1% Bi2O3. There was an emergence of ZnO-Bi2O3 liquid phase with eutectic temperature of 740℃[1]. This temperature is well below the sintering temperatures, reported herein. The liquid phase was confirmed by EDX (figure 7) to be rich in Bismuth. There was less porosity in sample ZB1 when compared with Z1, because the liquid easily filled the voids through capillary action. These bismuth formations at the grain boundaries also gave the sample its non-ohmic behaviour[12]. 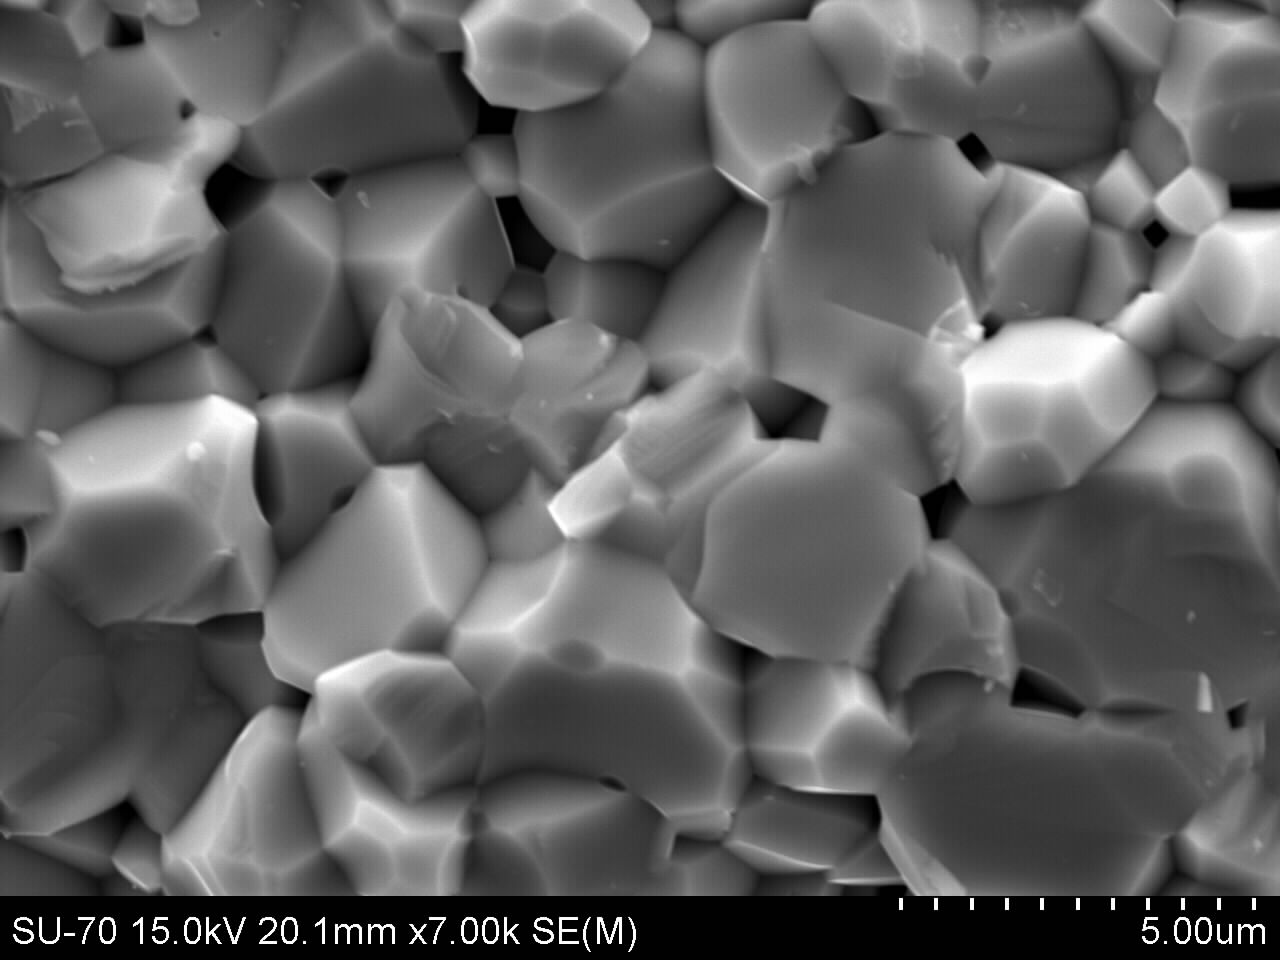 | Figure 3. SEM micrographs of Z sintered at 800℃ for 60mins |
 | Figure 4. SEM micrographs of Z1 sintered at 1100℃ for 600 mins |
 | Figure 5. SEM micrographs of ZB sintered at 800℃ for 60 mins |
 | Figure 6. SEM micrographs of ZB1 sintered at 1100℃ for 600 mins |
 | Figure 7. EDX of sample ZB sintered at 800℃ for 60mins |
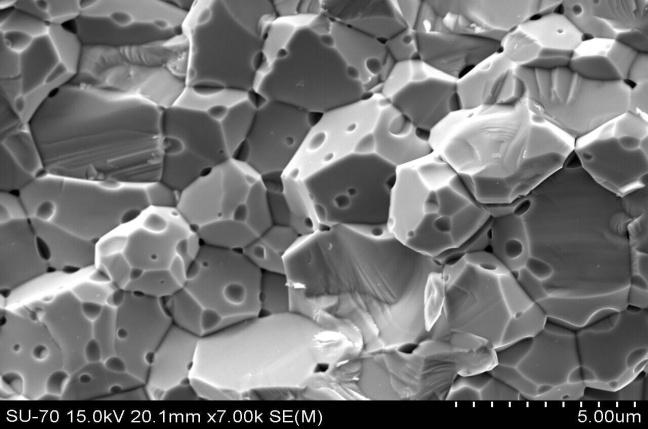
Figures 8 and 9 are the micrographs of ZBS and ZBS1 sintered at 800℃ for 60minutes. Their densities fell well below that of ZnO sintered at 800℃/60mins but not 1100℃. This was attributed to the hindering effect towards densification by the chemical reaction between oxidized antimony and bismuth oxides, to form an intermediate pyrochlore-type of phase (which usually occurs at temperatures above 750 – 800℃).4ZnO + 3Bi2O3 + 3Sb2O3 –> 2Zn2Bi3Sb3O14 + 4O2There was no available Bismuth to form any liquid phase, unlike in the cases of ZB and ZB1. As a result of this, there was reduction in material transfer, leading to smaller grain sizes. This pyrochloric phase[13] was further established by X-ray diffraction in figure 10. The peaks from the graph are attributable to ZnO and Zn2Bi3Sb3O14. 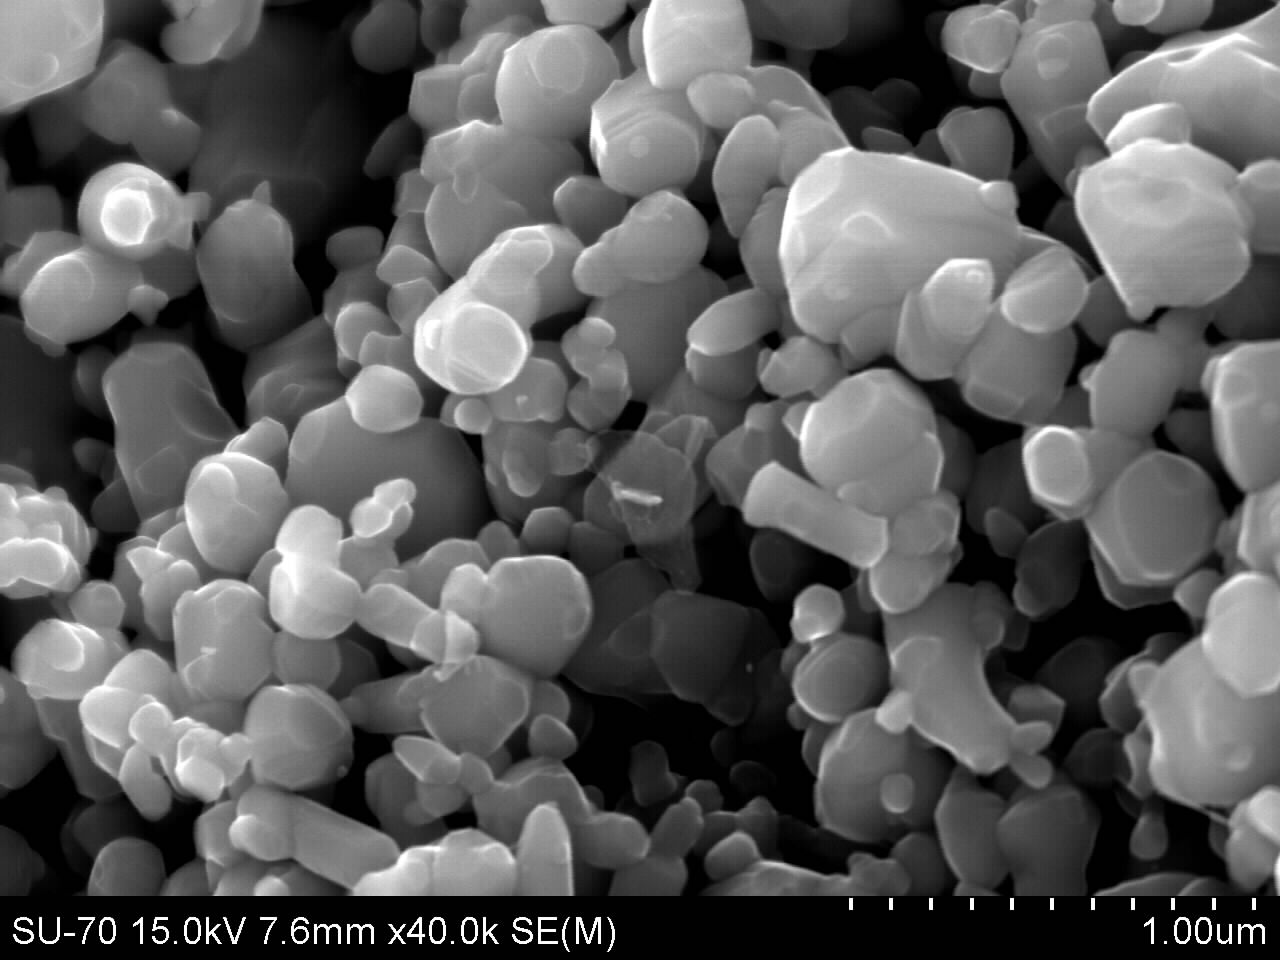 | Figure 8. SEM micrographs of ZBS sintered at 800℃/60mins |
 | Figure 9. SEM micrographs of ZBS1 sintered at 800℃/60mins |
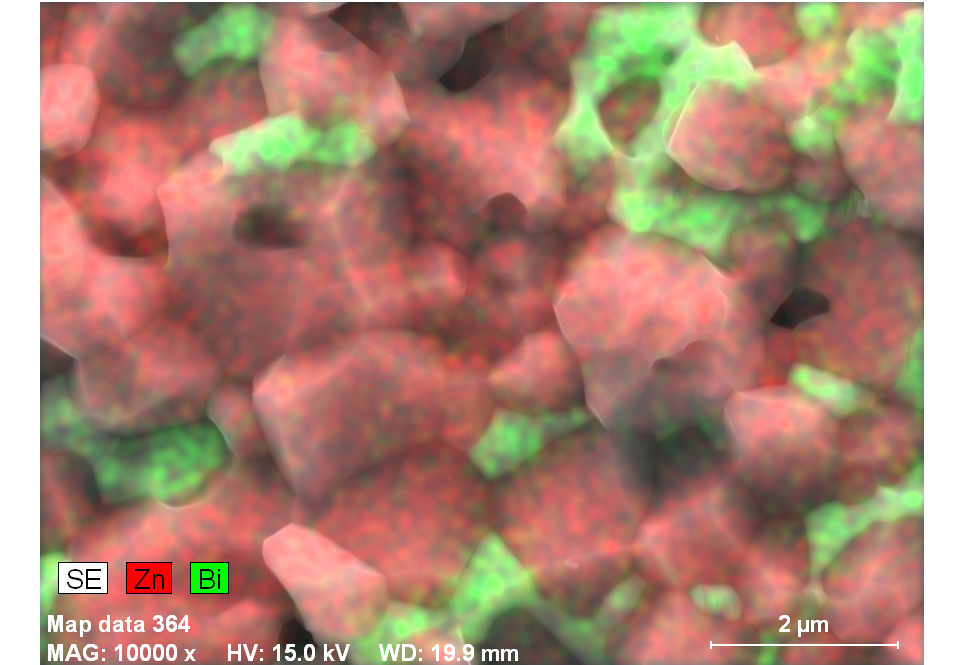
In the cases of the samples ZBS and ZBS1 sintered for 1100℃/600mins, there were formation of spinel phase (figure 11) and characterized by EDX to be rich in bismuth (figure 12). These ‘spinel phases’ formed inclusions which pinned the grain boundaries’ motion, and so restricted the ZnO grain growth.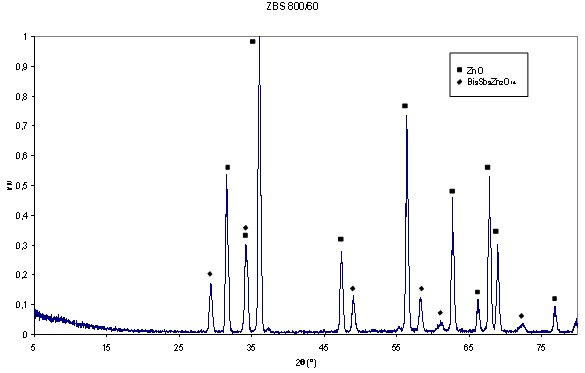 | Figure 10. SEM micrographs of Z1 sintered at 800℃/60mins |
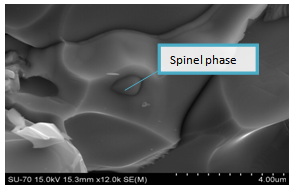 | Figure 11. Micrograph of ZBS showing spinel phase surrounded by Bismuth at 1100℃600mins |
The electrical characteristics (i.e. V versus I) of Z, ZB and ZB1, all sintered at 1100℃/600mins were plotted, using data obtained from a Keithley multimeter. For each of the sample types, whose thickness was approximately 2.00 millimetres with silver electrodes, at least three different tests were taken. The voltage was increased in steps of approximately 0.03 volt. The applied electric field (E) and current density (J) were thus calculated, from the surface parameters of the samples.Figure 13 shows a somewhat linear E versus J relationship for sample Z, and non-linear characteristics for samples ZB and ZB1[14, 15].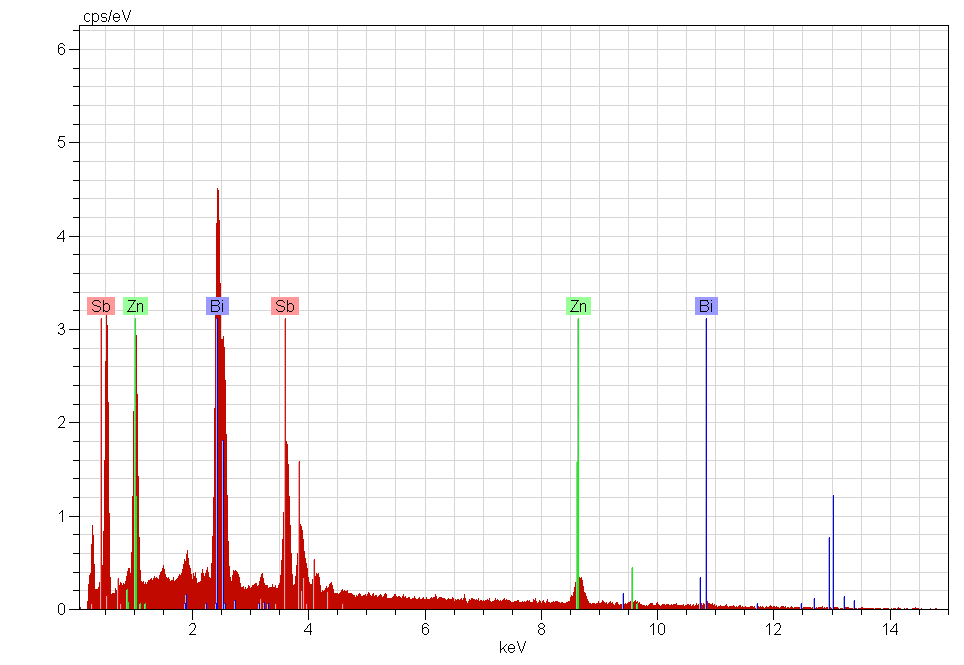 | Figure 12. EDX showing spinel phase surrounded by Bismuth rich phase |
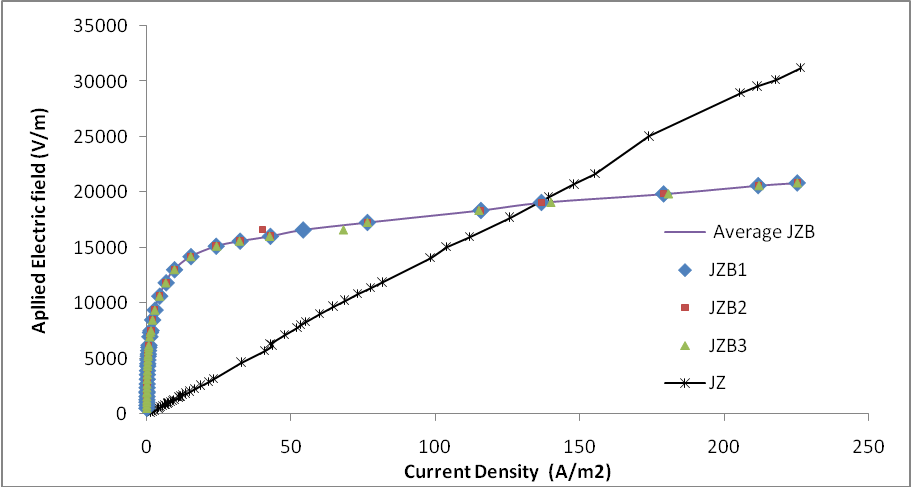 | Figure 13. Graph of applied electric field versus current density for samples Z, and ZB sintered at 1100 for 600minutes |
The different geometries of the grains in ZB and ZB1, and the different orientations of the grain boundaries gave the bulk sample characteristic junction property, which inhibited current flow at low applied voltages, but broke down beyond a critical voltage value[16]. The non-linear behaviours in ZB were possible because of the bismuth-rich liquid phase, which afforded it surge proof property when voltages were applied across them.
4. Conclusions
This paper has reported the comparative studies of the effect of particle size on the Microstructural characteristics of Bi2O3 and Sb2O3 additives on sintered ZnO ceramics. To produce better technical ceramics, high density ZnO are preferred to low density ZnO. The following conclusions are inferred:• High densifications were recorded for samples whose particles sizes were 38μm (see figure 2, for sample sintered at 800℃ for 60 mins, Z) and 63μm (see figure 1, for sample sintered at 1100℃ for 600 mins, Z1). One could see that for improved tailored materials to be produced from sintering processes, one should ensure very small particle sizes of ZnO or start with coarser material but extend heating time, bearing in mind how to reduce the attendant porosity. Sintering these two groups of sample for shorter times left the coarser (63μm) samples with greater porosity, whereas, both particle size ranges (i.e. 38μm and 63μm) attained greater density when sintered for longer times (for 600 mins herein). For longer times, enough time was available for the pores to coalesce and migrate to the surface. • The maximum grain size for samples sintered at 1100℃ was 22.2μm as against 11.9μm, for those sintered at 800℃ (e.g. for ZBS1 and for ZBS). This is because the total number of grain boundaries for the coarser 63μm grains are more than six, a criterion for grain growth. • Varistor characteristics were exhibited by samples with additives (e.g. ZB and ZB1). This is due to the emergence of highly resistive ZnO-Bi2O3 liquid phase in a highly conductive ZnO matrix, which is rich in bismuth. These liquid phases separated by grain boundaries form a network of back - to - back p-n junctions of different orientations. From figure 13, one could see that equal mass of arbitrary oriented grains are electrically equivalent.• The densities of ZBS and ZBS1 were below that of ZnO due to the hindering effect of the intermediate pyrochlore – type phase which usually occur between 750 - 800 ℃• For ZBS and ZBS1 sintered above pyrochloric temperature, (herein at 1100℃) there was an emergence of a bismuth–rich spinel phase, which formed inclusions that restricted grain growth.
ACKNOWLEDGEMENTS
I am grateful to the Department of Ceramics and Glass Engineering of the University of Aveiro, Portugal for the characterization my samples and to the technical expertise of Augusto Luis Barros Lopes, for his insightful tutelage in the field of electron microscopy.
References
| [1] | Suk- Joong L. Kang; Sintering Densification, Grain Growth, and Microstructure, copyright (2005) Elsevier Butterworth-Heinemann. ISBN 07506 63855 |
| [2] | M.A. de la Rubia, M. Peiteado, J.F. Fernandez, A.C. Caballero; Compact shape as a relevant parameter for sintering ZnO-Bi2O3 varistors, Journal of the European Ceramic Society 24(6), 1209-1212 (2004) |
| [3] | D. Demirskyi, D. Agrawal and A. Ragulya; A scaling law study of the initial stage of microwave sintering of iron spheres, Scripta Materialia 66 (2012) 323–326 |
| [4] | Y. W. Lao, S. T. Kuo, W. H. Tuan; Influence of ball milling on the sintering behavior of ZnO powder, Ceramics International, 35(3), 1317-1320 (2009) |
| [5] | P. Nunes, E. Fortunato, P. Vilarinho, R. Martins; Effect of different dopants on the properties of ZnO thin films, International Journal of Inorganic Materials, 3(8), 1211–1213 (2001) |
| [6] | R. Ghosh, G. K. Paul, and D. Basak; Effect of thermal annealing treatment on structural, electrical and optical properties of transparent sol–gel ZnO thin films, Mater. Res. Bull. 40 (11), 1905–1914 (2005). |
| [7] | Choon-W. Nahm; The effect of sintering temperature on varistor properties of (Pr, Co, Cr, Y, Al)-doped ZnO ceramics, Materials Letters 62, 4440–4442, (2008) |
| [8] | Ervin E. Underwood; “Quantitative stereology”, Addison-Wesley publishing, p23-39 (1970) |
| [9] | S. Bernik, S. Macek, and A. Bui; The characteristics of ZnO–Bi2O3-based varistor ceramics doped with Y2O3 and varying amounts of Sb2O3 .Journal of the European Ceramic Society, 24(6), 1195–1198, 2004. |
| [10] | D. C. Halls and C. Leach; Spectroscopic cathodoluminescence studies of additive free zinc oxide and varistor ceramics. Acta Materialia, 46(17), 6237–6243, 1998. |
| [11] | Liyi Shi, Dong Xu, Zhenhong Wu, Qingdong Zhongb, and Xinxin Wu; Microstructure and electrical properties of ZnO–Bi2O3-based varistor ceramics by different sintering processes, Journal of European Ceramic Society 29, 1789–1794 (2009) |
| [12] | Choon-W. Nahm; Effect of sintering temperature on varistor properties and aging characteristics of ZnO–V2O5–MnO2 ceramics, Ceramics International 35, 2679–2685, 2009 |
| [13] | S. Ananthakumar, S. Anas, R. V. Mangalaraja, M. Poothayal, and S. K. Shukla; Direct synthesis of varistor-grade doped nanocrystalline ZnO and its densification through a step-sintering technique, Acta Materialia 55, 5792–5801 (2007) |
| [14] | W. Onreabroy, T. Tunkasiri, and N. Sirikulrat; Effect of alumina surrounding in sintering process on ZnO-Bi2O3 varistors doped with CoO, Materials letters 59, 283-288 (2005) |
| [15] | Zupei Yang, Xiaolian Chao, Xiaohui Huang, Difei Ma and Jinghui Zeng; Electrical characteristics and low-temperature sintering of BiFeO3-modified Pb(Zr, Ti)O3-Pb(Fe2/3W1/3)O3-Pb(Mn1/3Nb2/3)O3 ceramics with ZnO addition, Current Applied Physics 9, 1283- 1287 (2009) |
| [16] | Choon-W. Nahm; Impulse degradation behaviour of Co-Cr-Al-Y-doped ZnO-Pr6O11-based varistors with sintered temperature, Ceramics international 37, 265-271 (2011) |
 Abstract
 Reference
 Full-Text PDF
 Full-Text HTML