-
Paper Information
- Next Paper
- Previous Paper
- Paper Submission
-
Journal Information
- About This Journal
- Editorial Board
- Current Issue
- Archive
- Author Guidelines
- Contact Us
American Journal of Materials Science
p-ISSN: 2162-9382 e-ISSN: 2162-8424
2012; 2(3): 87-94
doi: 10.5923/j.materials.20120203.10
The Sensitivity of Hopping Transport in Dipolar Glasses and Molecularly Doped Polymers to Localised Dipole Ordering
 Abstract
 Reference
 Full-Text PDF
 Full-Text HTML
David M. Goldie
Division of Electronic Engineering and Physics, University of Dundee, Dundee, DD1 4HN, United Kingdom
Correspondence to: David M. Goldie, Division of Electronic Engineering and Physics, University of Dundee, Dundee, DD1 4HN, United Kingdom.
| Email: |  |
Copyright © 2012 Scientific & Academic Publishing. All Rights Reserved.
The influence of ordered dipole regions upon hopping transport through dipolar glasses and molecularly doped polymers has been evaluated via Monte Carlo simulation. Ordered dipole regions were introduced as a set of randomly distributed cubes throughout disordered dipolar lattices where the number and size of the cubes could be independently varied. Within each cube neighbouring dipoles were anti-aligned to minimise the local energetic disorder but the specific dipole orientation for each inserted cube was randomly selected. Whilst the underlying density of states appears to become energetically narrower as the overall proportion of disordered dipole sites is diluted by inserted ordered cubes this is not generally reflected in the associated transport properties. It is demonstrated that the lattice potential that is associated with background non-aligned dipoles in dipolar glasses have a controlling influence upon the observed macroscopic mobility. Confirmation of the importance of such non-aligned dipoles is provided by complimentary simulations using molecularly doped polymers where the dopant dipoles are agglomerated and ordered into cubic regions. The implication of the simulation results for the interpretation of experimental transport data in dipolar glasses and molecularly doped polymers is evaluated.
Keywords: Monte Carlo, Hopping, Localised Dipole Ordering
Article Outline
1. Introduction
- The use of organic materials as the active elements in a diverse range of plastic electronic products has become commercially attractive due to the possibility of synthetically optimising the constituent materials to the target application. Novel applications have been demonstrated in niche markets such as displays, imaging systems and chemical sensors. Many plastic electronic products demand that the organic materials are deposited as a thin-film over a large area using either solvent based casting or vacuum deposition methods. The viability of candidate organic materials for device applications is normally assessed using such thin-films and a benchmark parameter that is often experimentally measured is the carrier mobility using transient photoconductivity or current injection methods[1]. Such experiments have generated a valuable database of mobility parameters for a diverse range of organic materials. An interesting subset of this data is focussed upon organic materials whose transport occurs via hopping processes which are controlled by energetic disorder due to background dipole electric fields[2-4]. Such hopping systems frequently involve redox reactions between pole moment. Examples of such systems include pure dipolar glasses (DGs) where the molecules are usually condensed into a thin-film using thermal evaporation, and molecularly doped polymers (MDPs) where the small molecules are used to dope a supportive polymer using spin-coating from a common solvent. It is normally desirable to deposit such DGs and MDPs in an amorphous form to ensure that the electrical and mechanical properties of the film are globally maintained. The amorphous structure ensures that the orientation of internal dipole directions is random and that the associated Gaussian distribution of energetic sites through which carriers hop is correlated[5,6]. Monte Carlo simulations of hopping transport through such correlated Gaussian landscapes has resulted in the Gaussian disorder model (GDM)[7]. The GDM has been successfully used to characterise the dependence of the mobility to electric field and temperature for many DG and MDP materials[7,8].The assumption that the dipole distribution remains entirely random throughout DG and MDP systems may be invalidated, however, under circumstances where local ordering of neighbouring dipole moments is favoured. Local ordering is likely to arise as a result of dipole-dipole interactions that result in molecular agglomeration and crystallisation[9-12]. Under these circumstances the ability of the GDM model to parameterise the associated hopping transport may be compromised. A particularly important test for the GDM model under these circumstances is to examine to what extent it is capable of detecting the underlying presence of local dipole ordering through the parameters that are returned. To investigate the GDM sensitivity to local dipole order a series of Monte Carlo hopping simulations have therefore been conducted using initially amorphous landscapes into which a number of locally ordered regions were introduced. Simulations with local ordering have been performed to model both DGs and MDPs. This work extends independent previous Monte Carlo studies which have either considered short-range order in MDPs using non-correlated random orientation vectors[12], or have examined the effect of introducing ordered regions into DG energy landscapes by using pre-determined Gaussian distributions to perform the allocation of site energies[13-15]. By contrast the generation of energy landscapes in the present study has been achieved using a fundamental electrostatic calculation of the dipole potential, where local variations of the potential have been introduced using dipoles that are locally ordered within cubic regions that have a specified volume. Using this approach, the sensitivity of hopping transport to the total concentration of ordered dipoles, and the associated ordered volume size that is employed, has been independently evaluated.
2. Simulation Details
- Monte Carlo simulation of carrier hopping through DG and MDP structures was performed using cubic lattices where the fundamental cube size comprised NxNxN sites with a lattice constant of size a. For DGs dipoles having an identical dipole moment (p) were randomly oriented at each of the fundamental cube lattice sites. The resulting electronic energy for each site was then determined using an Ewald summation of the electric potentials due to all other surrounding dipoles[16]. To implement periodic boundary conditions and ensure that site energies near the faces of the fundamental cube would remain correlated the Ewald calculation included the electric potential contribution from the surrounding 27 identical copies of the fundamental cube. The energy scale of landscapes generated using this procedure was proportional to p/4πεa2 where ε is the DG permittivity. A subset of smaller nxnxn ordered cubes (OCs) were introduced into these DG landscapes to evaluate the influence of local dipole ordering. These OC regions were randomly seeded throughout the fundamental cube and for each OC location the dipoles were anti-aligned with their nearest neighbours to effect cancellation of dipole potentials and so introduce lower local site energies relative to the surrounding DG landscape. The anti-alignment orientation assigned to each OC was, however, randomly selected. The individual volume of the OCs introduced was restricted to (n/N)3 ≤ 0.125 and the number (m) of such cubes was controlled to give an overall concentration (C) of ordered to total fundamental sites. Due to possible overlap of the OC site locations due to the random seeding procedure it was generally found that C ≤ m(n/N)3 with equality only holding for dilute OC lattices. For example, to achieve C = 0.5 it was found that m ~ 80 for n/N = 0.2 whereas m ~ 5 for n/N = 0.5.Monte Carlo hopping through the generated energy landscapes was conducted using a standard Miller-Abrahams selection criteria[17] for nearest and next-nearest neighbour sites which ignores the dependence of the hopping rate upon the mutual orientation of the transport sites. To ensure that energetic equilibration of carriers was established during hopping a macroscopic transport distance of 2000 lattice planes along the applied electric field direction was used to determine individual carrier transit times. Statistical averaging of transit times using a minimum population of 20 carriers was used to calculate the hopping mobility (µ) associated with the applied electric field strength (F). The electric field strengths used during simulation generally spanned a broad range with F < ~ 1.5 Fmax where Fmax represents the upper field limit where the energy landscape is “flattened” and carrier velocities saturate[18]. To fully parameterise the mobility results with the GDM, simulations were furthermore conducted across a broad range of temperatures for a selected energy landscape. Appropriate temperature ranges were dictated by the energetic characteristics of the landscape and the achievement of practical simulation times.
3. Results and Discussion
3.1. Simulation of Dipolar Glasses
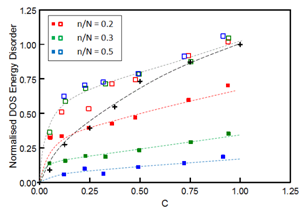
- Previous work has demonstrated that the distribution of site energies in pure DG lattices is well described by a single Gaussian density-of-states (DOS)[5,19]. The standard deviation (σDOS) of the DOS is consequently a convenient parameter to characterise the underlying energetic disorder of the associated lattice and may be determined through application of the GDM to mobility data[3,4,7]. In the present work the continued ability of a Gaussian distribution to describe the DOS of DG lattices into which OC regions were introduced was first examined. To generate a sufficient number of site energies whose statistical distribution could be realistically examined through binning the minimum fundamental cube size used for this study corresponded to N = 10. The use of larger N sizes generated increasingly smoother distributions for a fixed bin interval (typically 30 bins across the entire energy spectrum) but the additional computational overhead encountered limited the maximum fundamental cube size to N = 15. Fitting of the lattice DOS to a Gaussian distribution was performed using a least-squares procedure to generate σDOS parameters and this process was successively repeated over five sets of random number seeds to allow σDOS averaging. The results of these DOS studies are presented in Figure 1 which shows the dependence of σDOS upon the overall concentration of inserted OCs for various n/N ratios.In Figure 1 the data have been normalised relative to the reference σDOS for the pure (m = 0) DG lattice. As anticipated the amount of energetic disorder is observed to progressively fall as the total concentration of OC sites becomes larger. The rate of fall of σDOS depends upon the n/N ratio where it is noted that the insertion of large OCs is more effective than small OCs in reducing the overall energetic disorder at high C values. The relative inefficiency of smaller n/N OCs to reduce σDOS is understandable, however, since with increasing m the probability of overlap of OC locations is enhanced and dipole anti-alignment at the overlap locations is lost. This phenomenon is further illustrated in Figure 1 for the n/N = 0.5 (placed) and single cube data sets. In the n/N = 0.5 (placed) situation the seed locations for the OCs have been specified to ensure that no overlap occurs and in this case C = 1 is achieved when m = 8 exactly. Compared to the randomly seeded n/N = 0.5 data the n/N = 0.5 (placed) results show an enhanced σDOS fall rate with C. The rate of fall for the placed results is comparable with the single cube data which has been obtained for DG lattices into which a single n/N cube has been inserted. Completely anti-aligned ordering of all dipoles in the fundamental cube may be achieved under these circumstances for n/N = 1 where it is confirmed in Figure 1 that σDOS → 0.
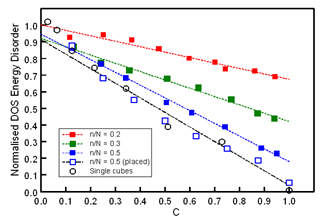 | Figure 1. Dependence of the normalised DOS energetic disorder of DGs upon the total concentration of inserted OCs for various n/N cube ratios. The dashed lines represent the best fit of the data to Equation 2 |
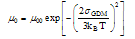 | (1) |
 | Figure 2. Examples of simulated Monte Carlo mobility data for a DG where n/N = 0.5, m = 3 and C = 0.36. The energy scale used corresponded to p/4πεa2 = 43 meV (a) electric field dependence of the mobility at temperatures indicated (b) temperature dependence of µ0 where the solid line represents the best fit of the data to Equation 1 |
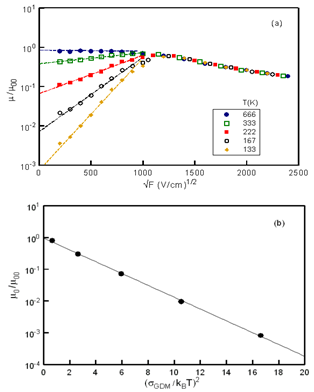
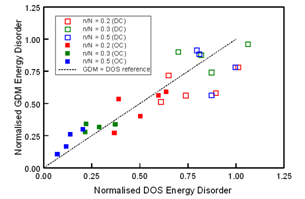
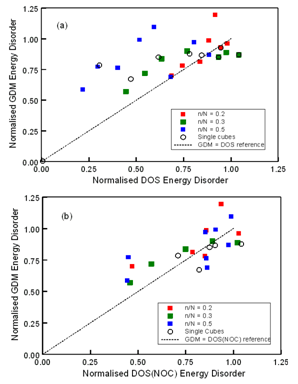 | Figure 3. Comparison of normalised GDM and DOS energy disorder magnitudes for DGs with inserted OC regions as indicated. (a) σGDM against σDOS; dashed line represents σGDM = σDOS as a reference guide (b) σGDM against σDOS(NOC) ; dashed line represents σGDM = σDOS(NOC) as a reference correlation guide |
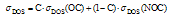 | (2) |
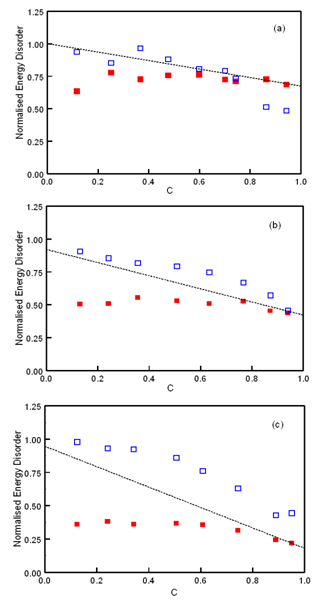 | Figure 4. Normalised DOS energy disorder parameters of DGs upon the total concentration of inserted OCs. The open symbols correspond to σDOS(NOC) data, and the closed symbols to σDOS(OC) data. The dashed lines correspond to the fitted σDOS results in Figure 1 (a) n/N = 0.2 (b) n/N = 0.3 (c) n/N = 0.5 |
3.2. Experimental Dipolar Glass Data
- An interesting DG material that is prone to crystallisation when deposited as a thin-film is N,N′-Bis (3-methylphenyl) -N,N′-diphenylbenzidine (TPD). A considerable literature exists concerning the determination of the mobility of hole carriers in TPD using direct time-of-flight methods[20-25], and indirect techniques such as current injection[25,26], photo-conductivity[27,28] and field-effect transistor configurations[25,29,30]. A survey of the TPD hole mobility values that have been obtained as F → 0 using these approaches reveals that the highest values (~ 10-3 cm2V-1s-1) are consistently returned from the direct time-of-flight method. Other indirect methods may sometimes return mobility values that surprisingly may range up to almost two orders of magnitude lower[27,30]. Very little information regarding the associated structural condition of these TPD films is available but it seems unlikely that the highest mobility values reflect significant dipole ordering as the direct time-of-flight measurements are generally performed using thicker films which are less prone to crystallisation. A more realistic explanation is that the indirect methods demand the formation of ohmic contacts and these may be difficult to achieve for thinner films where crystallisation is more easily initiated through surface humidity exposure[25,31,32]. Confirmation of the relative insensitivity of the fundamental TPD hole mobility to crystallisation in thin-film structures is suggested from novel surface time-of-flight results[24] which give low-field mobility values that compare well with the conventional time-of-flight method performed through the film thickness. The stability of the TPD mobility to crystallisation would indicate that a significant fraction of dipoles sites remain unordered according to the present Monte Carlo characteristics and that µ0 ~ 10-3 cm2V-1s-1 is determined by the underlying σDOS(NOC) magnitude of these disordered TPD dipoles.
3.3. Simulation of Molecularly Doped Polymers
- The controlling influence of the NOC sites upon the transport mechanism in DGs may be further investigated by removing the entire NOC dipole population. The removal procedure leaves a hopping lattice that is populated only by the OC sites. Such a pure OC lattice could be used to represent a MDP system (MDP(OC)) in which all of the dopant dipoles have agglomerated and anti-aligned within an inert polymer matrix that does not facilitate transport. Alternative MDP systems would include a lattice in which the dipoles have again fully agglomerated into cubes but remain disordered (MDP(DC)), and a reference MDP (MDP(R)) where no agglomeration occurs and the dipoles are randomly dispersed throughout the polymer matrix. For each of the MDP systems described the effects of agglomeration and dipole alignment may be explored as a function of the fraction (C) of total sites in the fundamental cube that are occupied by dopant dipoles. Earlier Monte Carlo work using MDP(R) lattices has been conducted to investigate the dependence of Fmax upon C[18].The dependence of σDOS upon C for each of the MDP scenarios is summarised in Figure 5 where data for the MDP(OC) and MDP(DC) lattices have been generated using several n/N cube ratios. All of the σDOS results given in Figure 5 employed identical magnitudes for p and a to ensure a consistent energy scale, and the Gaussian fitting procedure was only applied to the distribution of lattice energies at occupied dipole sites as these are the relevant sites through which hopping may proceed. A single Gaussian provided an excellent fit in all MDP cases and the data have been normalised to the σDOS magnitude for the MDP(R) system when C = 1.For the reference MDP(R) system σDOS shows the expected increase with C (σDOS ∝ C2/3[5, 18]) as the nearest-neighbour dipole distance becomes progressively shorter. A similar dependence is observed for the MDP(DC) data at higher concentrations where the effect of agglomeration upon nearest-neighbour distance becomes insignificant compared to the MDP(R) case. However, for lower concentrations (C < 0.5) agglomeration maintains a much shorter nearest-neighbour distance compared to the reference situation which results in higher agglomerated site energies. The independence of the DOS to the agglomerated cube size in the MDP(DC) system reflects the short-range nature of the random dipole potential. By contrast the combined effects of agglomeration and dipole alignment is seen to have a dramatic effect in Figure 5 upon the DOS of MDP(OC) systems. Dipole anti-alignment is highly efficient at reducing the effective dipole potential within individual cube sites so that the overall energy disorder is consequently smaller for MDP(OC) systems relative to both the MDP(DC) and MDP(R) systems across the entire C range. The effectiveness of disorder reduction is generally improved for larger n/N cube sizes as these offer less opportunity to upset the anti-alignment of dipoles in regions of OC overlap.
 | Figure 5. Dependence of the normalised DOS energetic disorder of MDPs upon the total concentration of dopant dipoles for various n/N cube ratios.. The open symbols correspond to MDP(DC) systems, the closed symbols to MDP(OC) systems, and the cross symbols to MDP(R) systems.The dashed lines represent a guide for the eye in all cases |
 | Figure 6. Comparison of normalised GDM and DOS energy disorder magnitudes for MDPs using various n/N cube ratios. The open symbols correspond to MDP(DC) systems, the closed symbols to MDP(OC) systems, and the cross symbols to MDP(R) systems. The dashed line represents σGDM = σDOS as a reference correlation guide |
3.4. Experimental Molecularly Doped Polymer Data
- A further experimental complication that may exist in some MDP materials originates from the choice of host polymer which may introduce an additional background fluctuation (σP) to that arising from the dopant dipoles (σDOS). The existence of a finite σP will depend upon whether the polymer itself possesses an inherent dipole moment or may be induced to become dipolar through internal van der Waals interactions. Under the normal assumption that σP and σDOS are uncorrelated the effective MDP energy disorder detected by GDM is then σGDM = √( σP2 + σDOS2)[3,5]. Provided σP is not dependent upon the internal structure of the dopant dipoles, the relative locations of the DOS characteristics given in Figure 5 (where σP = 0) remain invariant, however, and the detection of agglomeration is still possible. Polystyrene based MDPs offer a promising opportunity to study agglomeration effects as they provide a relatively low σP background and appear to induce clustering of small dopant molecules such as TPD[11].
5. Conclusions
- Hopping in DGs continues to proceed mainly via a transport path that is associated with disordered dipole sites until a significant fraction of these sites are replaced by ordered dipole regions. A significant concentration of ordered dipole regions may therefore remain undetectable in DGs via GDM analysis of mobility data. The effect of dipole ordering is much more apparent in MDPs where the dopants are forced to agglomerate. Agglomeration effectively removes the transport path that is associated with disordered dipole sites in DGs and constrains carriers to hop exclusively via the agglomerated sites. Mobility measurements are consequently anticipated to provide a more sensitive detection method for the presence of ordered dipole regions in fully agglomerated MDPs compared to DGs.