-
Paper Information
- Next Paper
- Previous Paper
- Paper Submission
-
Journal Information
- About This Journal
- Editorial Board
- Current Issue
- Archive
- Author Guidelines
- Contact Us
American Journal of Materials Science
p-ISSN: 2162-9382 e-ISSN: 2162-8424
2012; 2(2): 15-21
doi: 10.5923/j.materials.20120202.04
Electricalconductivity and Dielectric Properties of Bi0.5(Na0.7K0.2Li0.1)0.5TiO3 Ceramic Material
 Abstract
 Reference
 Full-Text PDF
 Full-Text HTML
K. Ch.Varada Rajulu 1, Tilak B 2, K. Sambasiva Rao 2
1Dept. of Physics, CENTEC, IPIRTI, Bangalore, Karnataka, 560022, India
2Dept. of Physics, Andhra University, Visakhapatnam, India
Correspondence to: K. Ch.Varada Rajulu , Dept. of Physics, CENTEC, IPIRTI, Bangalore, Karnataka, 560022, India.
| Email: |  |
Copyright © 2012 Scientific & Academic Publishing. All Rights Reserved.
Solid state reaction route is used by adopting calcination, dry pressing and sintering for the preparation of polycrystalline Bi0.5(Na0.7K0.2Li0.1)0.5 TiO3(BNKLT) material. Studies of dielectric and conductivity parameters of the material were studied as a function of frequency(45Hz to 5MHz) and temperature(RT-600℃). At higher temperatures the conductivity curves were found to be merging, due to the effect of release of space charge.The conductivity parameters such as ion-hopping rate (ωp), fitting parameters (n(T), A(T)) and the charge carrier concentration(K') terms have been calculated using Almond and West formalism.A strong dispersion in both the components of complex dielectric constant, appear to be a common feature in ferroelectrics associated with good ionic conductivity and is referred to as the low frequency dielectric dispersion(LFDD).This offered an opportunity to obtain a good candidate for replacing the lead based ceramics.
Keywords: Conductivity, Activation Enthalpy, Carrier Concentration, Dielectric Relaxation
Article Outline
1. Introduction
- An increasing amount of attention has been paid to lead-free or low lead- content ceramics in recent years, in consideration of environmentalprotection. Actually, research on lead free dielectric or ferroelectric materials has begun a few decades ago. Unfortunately, the best properties from the currently investigated lead-free ferroelectric materials are still not as good as expected. Since it was discovered by smolenskii et al in 1961[1], (Bi0.5Na0.5)TiO3(BNT) has attracted much attention due to its good ferroelectricity. Its piezoelectric and electromechanical properties were greatly enhanced by forming solid solutions with potassium (K), Barium (Ba) and Lithium (Li) kind of dopants[2-5]. [Bi0.5 (Na1-x-y KxLiy)0.5]TiO3 is considered to be a new kind of material for lead-free piezoelectric and many efforts have been made to investigate the fabrication of high-performance piezoelectric with BNT[5-7]. Literature survey revealed that there is no previous research on conductivity, dielectric relaxation properties of BNKLT ceramic materials.Transport and relaxation properties can be described at higher temperatures with reference to inter particle interaction[8]. The electrical conductivity studies indicate the nature of charge species involved in the conduction on application of electric field. Impedance spectroscopy has appliedsuccessfully in the investigation of ferroelectric materials[5]. The dielectric constant obtained from ac data would be unambiguous and would have a better physical significance than those obtained from capacitance measurements at chosen fixed frequencies.The factors that mainly influence the magnitude of the ionic conductivity are concentration of mobile ions and their mobility, which in turn depend on the ion-hopping rate. The enthalpy for the ionic hopping process has profound influence on the magnitude of the electrical conductivity. Hence, an attempt was made to study the conductivity and dielectric relaxation behaviourof BNKLT ceramic material. This study reveals clear understanding on the role of the macroscopic parameters such as fitting parameters (n, A), hopping rate(ωp), activation enthalpy(Hm) and carrier concentration (K') on the conductivity of Bi0.5(Na0.7K0.2Li0.1)0.5TiO3 (BNKLT)ceramic material.The present research on conductivity and dielectric relaxation behaviour of BNKLT is first of its kind in the world.
2. Experimental Work
- In the present work, solid state reaction route is used for the preparation of polycrystalline material. Bi0.5(Na0.7K0.2Li0.1)0.5TiO3(BNKLT) ceramic material have been prepared by taking the raw materials of Analar Grade chemicals(oxides and carbonates) Bi2O3, Na2CO3, K2CO3, Li2CO3 and TiO2in the preparation of the composition. The powders were mixed with desired weight ratio with approximately 3% excess Bi2O3 and Na2CO3, to compensate the weight loss due to their high vapour pressure. The powders were mixed and grounded well in dry and methanol medium before each calcination. The resultant grounded mixture was calcined twice at 850℃ for 2hr with intermediate grinding. After calcination, the ceramic powder was mixed with polyvinyl alcohol (5%), as the binder and pelletized into discs of 13 mm diameter and about 1-1.5 mm thickness. After binder burnout, at 600℃ for 1 hr, the green discs have been sintered in a closed platinum crucible at 1135℃/2 hr.The measurement of dielectric (ε'), and conductivity (σ) as function of temperature (RT–600℃) and frequency (45 Hz to 5 MHz) have been carried out using computer interfaced LCR Hi-Tester (HIOKI 3532-50, Japan).
3. Results and Discussion
3.1. Electrical Conductivity
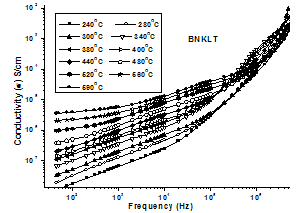 | Figure 1(a). Variation of conductivity with frequency at different temperatures |
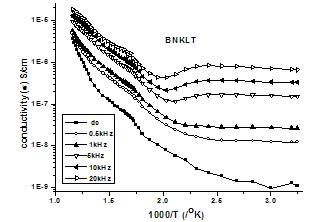 | Figure 1(b). Variation of d.c and a.cConductivity versus 1000/T |
 | (1) |
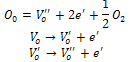
 is single ionized oxygen vacancy having one negative charge and
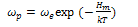
 is double ionized oxygen vacancy having no net charge on it.The creation of oxygen vacancies may help in production of Ti3+ ions at the centers of the octahedra. The hopping mechanism, which plays an important role in the conduction process according to the relation
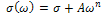
 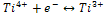 It is reported that titanate based perovskite oxide materials contain Ti3+ that are formed because of capture of electron released during the process of formation of oxygen vacancies by Ti4+. The polaronic conduction of 3d electrons on Ti3+ with low mobility must be predominant at low temperature. Thesepolaronic states are thermally dislocated,residual carriers and 3d electrons are strongly scattered by thermal phonons at high temperature, resulting in high electronic conductivity[17].The Arrhenius plots for d.c and a.c conductivity versus inverse temperature of BNKLT composition is shown in Fig.1(b). It is observed from the Fig.1(b) that the conductivity shows a temperature independent behaviour at low temperatures for all the frequencies. In high temperature region the conductivity is found to increase with increase of temperature. This rise in conductivity may be due to free as well as bound carriers in the material and hence Arrhenius type change in conduction becomes apparent.Further, It is evident from the Fig.1(b) that the conductivity of the material from RT to a certain temperature (<150℃) exhibits a decrease in conductivity with increase in temperature indicating a Positive Temperature Coefficient of Resistance (PTCR) behaviour. At moderate temperatures (150-250℃) the conductivity is observed to be independent of temperature but depends on frequency. The PTCR behaviour is intimately connected with the grain boundary[18]. The origin of the PTCR ceramics is usually explained on the basis of the Heywang[19] model, which assumes that the acceptor type states of the grain boundaries create equivalent potential barriers associated with resistive depletion layers near the boundaries. The PTCR is a result of the dependence of barrier heights on dielectric constant of grain or bulk in higher symmetry phase (T>Tm). The increase of dielectric constant, as T
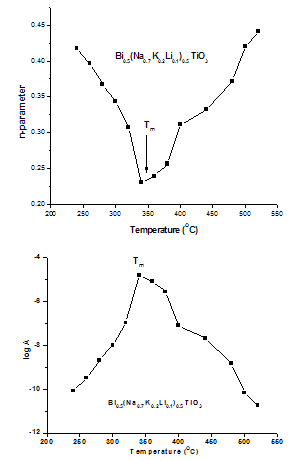 | Figure 2. Variation oftemperature dependence Exponential factor(n) and pre-factor (A) as a function of temperature |
|
 | (2) |
 | (3) |
 | (4) |
 | (5) |
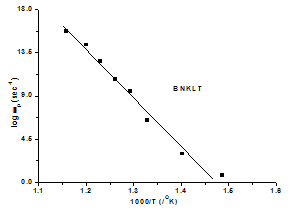 | Figure 3(a). The temperature dependence of hopping rate of various materials |
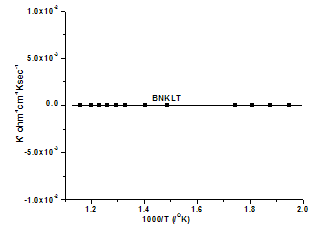 | Figure 3(b). Variation of K' with temperature |
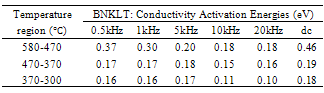
 is the hopping rate, Hm is the activation enthalpy for hopping ions, k is the Boltzmann constant and T is the absolute temperature. The hopping rate
 is calculated from equation(3). The Arrhenius format is shown in fig.3(a) by taking the value of slope from (fig.3(a)) and using the equation(5) the values of activation enthalpy was estimated for K+Li+ substituted BNT composition and the value is 0.42eV.After the hopping rates have been determined, it is possible to estimate the carrier concentration term K' by using the equation:
  | (6) |
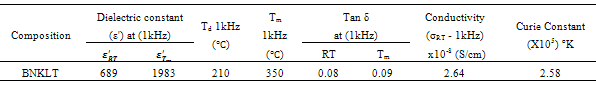
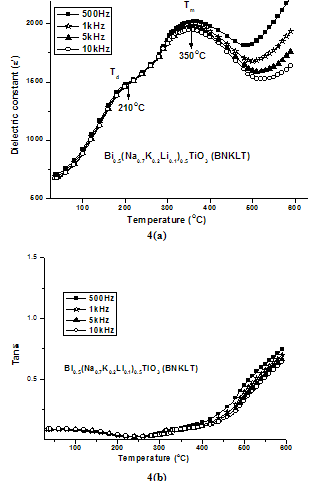 | Figure 4. Variation Dielectric Constant (ε') and loss tangent (Tanδ) with temperature on BNKLT material at various frequencies |
3.2. Dielectric Relaxation
- The value of dielectric constant(ε') increases with increasing in temperature attaining a maximum value at Tm. As a typical behaviour of normal ferroelectrics, dielectric constant increases gradually with increment in the temperature due to interfacial polarization becoming more dominant as compared to the dipolar polarization and passes through a maximum at Tm. The dielectric constant (ε') starts to decrease due to the phase transition from ferroelectric to the paraelectric phase. Two dielectric peaks have been observed in the studied material as it is evident from fig.4. The observed two dielectric peaks can be attributed to the factors caused by the phase transition from ferroelectric to anti-ferroelectric and anti-ferroelectric to paraelectric phase. Here, the transition between ferroelectric phase and anti-ferroelectric phase is called as depolarization temperature (Td), and the temperature corresponding to maximum value of dielectric constant is named as maximum temperature (Tm).K+Li+ substituted composition showed an increase in both Td (210℃) and Tm (350℃) compared to (Td=200℃ & Tm=325℃) composition. The Li+ in the Bi0.5(Na0.7K0.2Li0.1)0.5TiO3 ceramics act as soft additive which affects the dielectric properties. Owing to the ionic radius of Li+(0.76Å) being smaller than that of Na+(1.39Å), this substitution will result increasing in polarization, which benefits the increase of both
 and
and  The values
  and
and  are found to be 689 and 1983 respectively. Decrease in conductivity compared with has been observed in K+Li+ substituted BNT; it may also increase the values of both
 and
and [32]. The calculated Dielectric data have been shown in table2.A broad dielectric constant versus temperature (fig.4) response has been noticed in the BNKLT composition. They are A-site complex perovskites, with the composition (A'A'')BO3. A complex perovskite has a tendency to be disordered, in that there is no regular long range arrangement of the complex-site ions. This lack of order creates many micro regions of slightly different compositions and thus phase transition temperatures. The presence of these many different phases and thus different transition temperatures lead to a broadening of the overall phase transition temperature of the bulk material. Therefore it is assumed that, in K+Li+ modified BNT material the compositional fluctuations and microscopic inhomogenties causes the broadening of peak[33].The important characteristic of ferroelectric materials is the existence of critical temperature called the Curie point (Tc or Tm). The dielectric constant in most ferroelectric crystals has very large value near Curie point. It can be described by the Curie-Weiss law:
  | (7) |
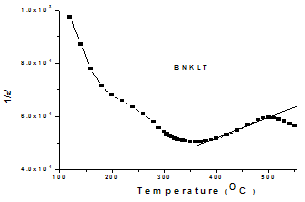 | Figure 5. Reciprocal Dielectric Constant (1/ε') Versus Temperature |
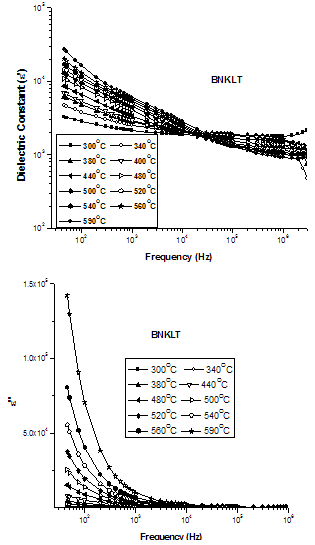 | Figure 6. Frequency dependence of dielectric constants, ε' and dielectric loss ε" |
 which act as space charge and contribute to the electrical polarization of perovskite materials, can thus be related to the dielectric loss.
|
 | (8) |
 | (9) |
 and
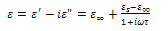
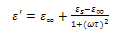
and  are the low and high frequency values of ε', ω=2πf and τ is the relaxation time.The complex dielectric constant as a function of the frequency ω in accordance with the Jonscher’s power law is given by
  | (10) |
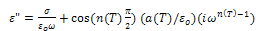
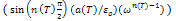
 is the high frequency value of the dielectric constant, n(T), a(T) fitting parameters.From the equation (10) the real and imaginary parts of the complex dielectric constant are given by the following relations.
 | (11) |
 | (12) |
 dominates at low frequency and
  is negligible. Therefore, for a constant n, equation (11) yields a straight line with a slope equal to n-1 in the double logarithmic plot of ε' and frequency. At higher frequencies the charge carriers fail to respond to the external field, therefore the measured dielectric constant is due to the contribution from the lattice polarization. This accounts for a linear decrease in the low frequency region.The determined values of n(T) and a(T) (obtained from conductivity measurements) theoretical values of ε' has been calculated by using equation(11). The experimental and theoretical values of ε' is fitted at different temperatures of BNKLT composition is shown in fig.7. It is seen from the fig.7 at higher temperatures the fitting of theoretical and experimental values of dielectric constant is good.
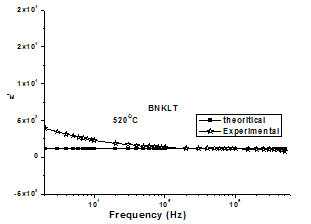 | Figure 7. Theoretical and experimental fitting of ε' BNKLT composition |
4. Conclusions
- The Pollicrystalline BNKLT material has been prepared by solid state sintering method. At higher temperatures the conductivity curves are found to be merging, due to the effect of release of space charge, appearance of space charge polarization takes place accompanied with the change in activation energy. The value of activation enthalpy was estimated for K+Li+ substituted BNT composition and the value is 0.42eV. The charge carrier concentration term remains almost constant over entire temperature range studied sample, which in turn reveals that there is no creation of charge carriers over the entire temperature range. K+Li+ substituted BNT composition showed an increase in both Td (210℃) and Tm (350℃) compared to BNT(Td=200℃ & Tm=325℃) composition. The room temperature tanδ value has been found to be the order of 10-2 in studied material under investigation indicating low loss material.
ACKNOWLEDGEMENTS
- The author K.Ch.Varada Rajulu would like to sincerely thank to IPIRTI, UGC-SAP and Naval Science and technological Laboratory, Visakhapatnam for their support.