-
Paper Information
- Previous Paper
- Paper Submission
-
Journal Information
- About This Journal
- Editorial Board
- Current Issue
- Archive
- Author Guidelines
- Contact Us
American Journal of Materials Science
p-ISSN: 2162-9382 e-ISSN: 2162-8424
2012; 2(1): 51-58
doi:10.5923/j.materials.20120201.10
Impacts of Heat Treatment on the Electrochemical Properties of AA3003 expose to 0.1M Hydrochloric Acid Media
 Abstract
 Reference
 Full-Text PDF
 Full-text HTML
Kelechukwu B. Okeoma1, Israel O. Owate2, Emeka E. Oguzie3, Iheborodike M. Mejeha1
1Department of Physics, Materials Science Unit, Federal University of Technology, Owerri, Imo State, Nigeria
2Department of Physics,Materials Science Unit, University of Port Harcourt, Rivers State Nigeria
3Electrochemistry & Materials Science Research Unit (EMRU) Department of Chemistry Materials Science option, Federal University of Technology, Owerri, Imo State, Nigeria
Correspondence to: Kelechukwu B. Okeoma, Department of Physics, Materials Science Unit, Federal University of Technology, Owerri, Imo State, Nigeria.
| Email: |  |
Copyright © 2012 Scientific & Academic Publishing. All Rights Reserved.
The impact of heat treatment on the electrochemical corrosion behaviour of control, oven quenched and air quenched samples of Aluminium alloy AA3003 was investigated by observing the changes that occurred in the open circuit potential, potentiodynamic polarization curve, and electrochemical impedance spectra within 0.1M HCl acid environment. The open circuit potential of the oven quenched sample shifted to more negative values, indicating shift into the active states. The cathodic branch of the polarization potential of the air quenched sample shifted into lower current density, indicating resistance to cathodic corrosion. The impedance analysis shows that the heat treatment of the sample facilitated dissolution of the samples in the medium. The calculated double layer capacitance buttresses the fact that the heat treatment caused the samples to be more susceptible to corrosion within the acid medium since the value is higher for heat treated samples. Finally, from the XRD data, heat treatment caused a decreased in peak intensity, size of crystalline particles, and a shift into higher diffracting angles for the particles and elimination of Mn from the crystalline particles that occurred at maximum peak.
Keywords: Heat treatment, Aluminium alloy AA3003, Open circuit potential, Impedance Spectra, Polarization, XRD Spectra.
Cite this paper: Kelechukwu B. Okeoma, Israel O. Owate, Emeka E. Oguzie, Iheborodike M. Mejeha, Impacts of Heat Treatment on the Electrochemical Properties of AA3003 expose to 0.1M Hydrochloric Acid Media, American Journal of Materials Science, Vol. 2 No. 1, 2012, pp. 51-58. doi: 10.5923/j.materials.20120201.10.
Article Outline
1. Introduction
- Aluminium and its alloys have found extensive usage and applications in various facets of industries, military, household appliances, automotive, aeronautics etc, due to their excellent physical and chemical properties as presented in high strength to weight ratio, excellent corrosion resistance, high ductility and malleability[1-6]. The excellent corrosion resistant properties have been ascribed to the protective oxide layer that readily covers the metal and its alloy immediately they are fabricated. The protective oxide layer on the metal and its alloys is attacked when exposed to aggressive environments while in service[7]. Due to the importance of these metal and the alloys, many researchers have investigated the interaction of the materials and their environments. Among the techniques adopted for the study of the degradation of aluminium and its alloys is the electrochemical spectroscopy. This is for such reason as (i) small signal which do not disturb the electrode properties and the mechanism of the corrosion is used; (ii) the possibility of studying the corrosion reactions and measuring the corrosion rates in low conductivity media and (iii) polarisation resistance as well as double layer capacitance data can be obtained in the same measurements[8,9]. It also offers the added advantage of characterizing corroding systems in terms of other physical properties such as time constant of the systems. Many researchers[10-12] have monitored the open circuit potentials versus time for corroding systems and made deductions from their observations. Particularly, Brett[12] on monitoring the variation of the open circuit potential with time opined that as the corrosion progressed, the corrosion potential decreased from passive to meta-stable and eventually entered the active state as the localized corrosion proceeded.The electrochemical impedance spectroscopy has been widely used to study corrosion phenomena,[13-17,1,8]. Many more researchers used both impedance spectroscopy and potentiodynamicpolarization to draw inferences from investigations of corroding systems,[18-23,1,10].The present study on the impacts of heat treatment on the electrochemical properties of aluminium alloy AA3003 in 0.1MHClaqueous acid media will investigate variation of open circuit potential with time for one hour; electrochemical impedance within the frequency range of 10mHz and 100kHz and polarization profile within potential range of -1.0 and -0.45V, for control, oven quenched, and air quenched samples of the aluminium alloy. ZSimpWin will be used to analyze the EIS data as to obtain lump components to support the effects of heat treatment on the alloy systems. XRD spectra analysis will also be undertaken to support the effects of heat treatment on the samples.
2. Experimental Techniques
- The working electrode employed in this research is aluminium alloy AA3003 of composition by weight percentage, Si- 0.36285, Fe- 0.54941, Mn- 1.21955, Cu- 0.07711, Al- 97.672 and others 0.11452, obtained from First AluminumNig, PLC. To investigate the effects of the heat treatments on the electrochemical properties of the alloy system, the material was grouped into control (as received) and heat treated. The heat treated was subjected to a temperature of 1500C for one hour and the oven quenched was left to cool in the oven at the rate of 0.2℃/hour after the oven was switched off, while the air quenched was brought out from the oven and allowed to cool in the open air. Each of the samples was dimensioned and cut 15mm by 15mm using hand cutting machine. A hole of diameter 0.25mm was drilled at the upper part of the coupon to enable a coated copper wire of about 30cm in length, whose both ends were made bare to be fixed to the electrode, and the other end to be connected to one of the three terminals of the potentiostat. The working electrode was then covered with a PTFE ribbon and an epoxy resin such that an area of 1cm2 was left uncovered at one side. The exposed surface was wet polished with an emery paper (grit# 1200), degreased in ethanol and rinsed with distil water and dried in warm air. The corrosive environment of 0.1MHCl solution was prepared from an analytical reagent grade of 36% purity obtained from FIN Lab. Nig. Ltd. The electrochemical experiments were conducted in a conventional three electrode glass cell of capacity 350ml using a VERASTAT- 3 teamed with V-3 studio software. A platinum foil and a saturated Calomel electrode (SCE) were used as counter and reference electrodes respectively. The reference electrode was connected to the Potentiostat through a Luggin’s capillary. The experiments were performed at room temperature of 30±2℃ in the following order: Open circuit potential versus time for one hour, impedance spectroscopy within frequency range of 10mHz and 100KHz, with signal amplitude perturbation ±5mV; and then polarization measurements between the potentials of -1.0 and -0.45V, the data were collected using V3 software and the graphs plotted with origin 8 and ZSinpWin supplied by PARC. The Tafel segments of the anodic and cathodic curves were extrapolated to obtain corrosion current densities. From the impedance data, plots of magnitude of impedance, imaginary, and real impedances and phase angles versus frequency are displayed to ensure full characterization. Also, in order to investigate the effects of heat treatment on the structure of aluminium alloy AA3003, X- Ray diffraction was carried out on the control, oven quenched and air quenched samples of the alloy. An X-Ray diffractometer system XPER- PRO equipped with copper anode generating Cu Kα radiation of wave length 1.54059A°, operating continuously at scan rate of 0.016 and at 40kV and 40mA was used.
3. Data Presentation and Discussion
3.1. Open Circuit Potential
- The evolution of the open circuit potential as function of time for control, and heat treated samples of aluminium alloy AA3003 exposed to 0.1M HCl aqueous environment are displayed in Fig.1.
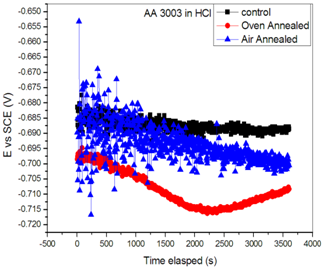 | Figure 1. Display of open circuit potential versus time for control, oven quenched and air quenched samples AA3003 in 0.1 M HCl aqueous environment |
 | (1) |
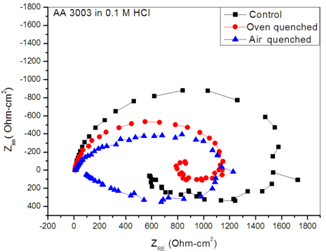 | Figure 2. Nyquist plots for control, Oven quenched and Air quenched Spectra of samples AA3003 in 0.1MHCl acid aqueous environment |
3.2. Electrochemical Impedance Spectra
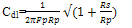
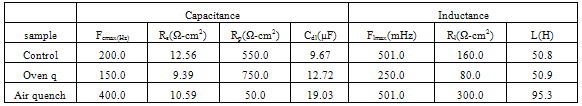
- Figure 2 displays the evolution of the plots of imaginary impedance component versus real impedance component of the corroding system for control; oven quenched and air quenched samples of AA3003 within 0.1M HCl aqueous acid environment as Nyquist plots. The Nyquist plots manifested depressed capacitive and inductive properties, showing that at least two time constants are involved in the corrosion process.Sherif and Mark[24] have suggested that the occurrence of depressed loops as an evidence of more than two time constants. It further indicates that such corrosion processes were not only controlled by charge transfer but other processes may be relevant. The capacitive loops are formed between high and intermediate frequencies, while the inductive loops are formed between intermediate and low frequencies.The diameters of capacitive and inductive semicircles decreased for the heat treated samples when compared with the control. This implies that the polarization resistance,Rp, decreased in the heat treated samples, meaning increase in the corrosion rate[33]. The origin of the time constants as displayed in the impedance spectra can be ascribed to the summation of corrosion activities that manifest in the impedance spectra. The individual activities may be investigated to identify the phenomenon that is responsible for each spectrum or that dominates each segment in the corrosion process. The spectra for control and air quenched samples show scattered points at intermediate frequency, depicting almost equal capacitive and inductive loops, though the loop for air quenched sample is smaller. The equal loops indicate equal resistance to corrosion at each stage, showing that the oxide layers of each of the sample resist the penetration of the acid equally. Apart from reduction in the size of the loops, the loop for oven quenched sample has smaller inductive loop when compare with its capacitive loop. The observations here support the OCP data in that for oven quenched sample spectrum, another capacitive loop has started forming after the inductive loop. This confirms the rise to higher potential observed in oven quenched sample’s OCP, suggesting that there must have been decrease in the number of active sites due to formation of protective oxide layers. Among researchers, it has been difficult to ascribe or give full explanations of the sources of the observed features in the corrosion impedance spectra. The evolution of the capacitive and inductive loops had not received any consensus on their origins. The trend of the time constants over the frequency region has been discussed by a number of authors. For example, Khaled[25] considered the high to intermediate frequency capacitive loop to the formation of oxide layers or to the oxide itself. In giving further explanation to the capacitive loop, Brett[12] opined that it is due to interfacial reaction of aluminium oxide at the metal/oxide/electrolyte interface. This process is initiated by the loss of electron by aluminium atom and consequent migration of the ions to the oxide/ solution interface driven by the high electric field, which is created by the reaction taking place at the interface. Lenderink et al[26] had suggested that for this process to be ascribed to one time constant implies either superposition of one time constant of minute but large processes or by dominance of one process over others. Another way of looking at it is by considering that the oxide film itself as a dielectric material. Bessone[27] investigated and found an inverse relationship between the capacitance and the voltageapplied to the system. The inductive time constant depicted between the intermediate and low frequencies has not been conclusively understood. Frers et al[28] attributed it to surface or bulk relaxation of the species in the oxide layer. While Burstein and co-worker[29,30] believed that the inductive loop is related to the presence of passive oxide film on aluminium. On their own,Bessone et al[25] suggested that the inductive time constant resulted from surface charge redistribution at the metal/oxide interface. Linderink et al [26] and Bessone et al[25] proposed that the adsorbed corrosion product intermediates from hydrogen ion reduction could cause the inductive loop. However, when one looks at the dissolution and formation processes taking place in corroding systems, one realizes that they involve migration of charged particles within these systems. This eventually results in the inductive reactance which is displayed in the inductive loops. This is manifested at certain frequency range depending on the properties of the corroding system. The inductive reactance can be defined as a measure of the impedance offered to the manifestation of the change in magnetic field in a system. The evolution of the inductive loop in a corroding system can then be attributed to the migrating ions within the corroding environment; this generates magnetic field, the reluctance to change in this magnetic field results to inductance. And this inductance manifests and dominates within a particular frequency range as is the case in the present experiment. The experiments of Andrieu, et al[31] support the occurrence of magnetic field suggested as the authors detected corrosion of aluminium by magnetic field measurements. Popovics et al[32] had monitored corrosion of metals through magnetic sensing; as[33-35] investigated the effects of magnetic fields on corrosion of metals. Branzoi et al[36] had indicated that chloride ions migrate into the oxide and aid in the dissolution and formation of chloride- oxide complex. The researchers,Popovics et al[32] and Sabewa[35] had monitored corrosion of metal using magnetic field, particularly[35] found that magnetic fields aid in faster dissolution of aluminium when the field is aligned at a particular direction. To buttress further, Maxwell’s equations and Biot-Sarvat law give credence to the fact that inductive loop can be explained by the migrating ions in a corroding system. From Figure 3, that display the Bode plots of control, oven quenched and air quenched samples of aluminium alloy AA3003 in 0.1M HCl, it is deducible that withinthe high frequency region the control and oven quenched samples exhibited similar pattern, while for the air quenched sample the maximum phase angle shifted to a higher frequency and attained a maximum phase earlier at frequency of about 400Hz. The maximum frequencies of the control and oven quenched occurred at about 200 and 150Hz respectively. Remarkably, the air quenched sample attained a height of about -60° indicating deviation from an ideal capacitor. The oven quenched and the control samples attained maxima of about -72° and -78° respectively. The heat treatment definitely caused the oxide layers of the alloy samples to deviate from ideal capacitive properties.Transition into the inductive property took longer time for the air quenched sample than for the control and oven quenched samples. Brett et al[15] attributed the formation of inductive loop at higher frequency as evidence of reduction of corrosion rate and alteration of the rate of oxide film relaxation. The maximum inductive phase increased from oven quenched 5° through control 19° to air quenched samples 39°, indicating a measure of the deviation from the properties of an ideal inductor. Table1 below shows the peak frequency of the capacitive loop Fcmax, solution resistance Rs, the polarization resistance Rp, Cdl – double layer capacitance, the maximum inductive frequency Flmax, the peak inductive impedance, Rl and the corresponding inductance L.
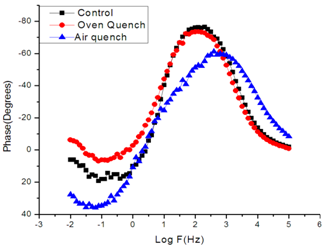 | Figure 3. Depicts the Bode phase diagram for Control, Oven quenched and Air Quench Samples of Aluminium Alloy AA3003 in 0.1M HCl acid environment |
 | (2) |
 | (3) |
|
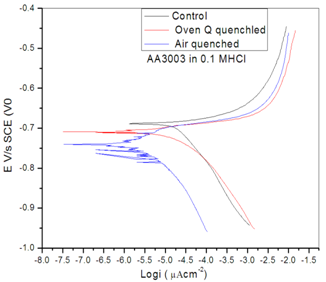 | Figure 4. Polarization profile of control, Oven quench and Air Quench Samples of Al alloy AA3003 in 0.1MHCl acid environment |
3.3. XRD Spectra
- The impacts of heat treatment on the control, oven quenched, air quenched samples of AA3003 was further investigated by studying the XRD spectral of the samples as are shown in Fig 5 below. These spectral showed a drastic decrease in the peak intensity in the heat treated samples. Heat treatment of the samples equally caused multiplicity and shifting of the peaks intensities to higher diffracting angles. The α phase and β phase occurred at higher diffracting angles in the heat treated samples. In the control sample, the α- phaseconsists of Al, Mn, Fe, particles, while the β phase consists only Al and Fe particles, but for the heat treated samples, α- phase and β phase consist mainly the Al, and Fe particles.The XRD diffractogram shows peaks with maximum intensities as diffracting angles 44.74°, 63.31°, and 65.14° for control, oven and air quenched sample and sizes of 17.95nm, 13.14nm, and 13.15nm respectively as calculated with Debye- Scherrerformular[43]. In fact there is multiplicity of the particles due to heat treatment of the aluminium alloy AA3003. This is reflected in the increased in the value of constant phase element Q for the heat treated samples, which may have resulted from increase in grain boundaries. And this increase is a source of susceptibility to corrosion as is observed in the experiments.It is evident that the crystalline particles as calculated are nano-particles being smaller than 100nm. Another observation is the conspicuous absence of Si particles in the spectra possibly as a result of low nominal concentration and the temperature at which the samples were treated[44].
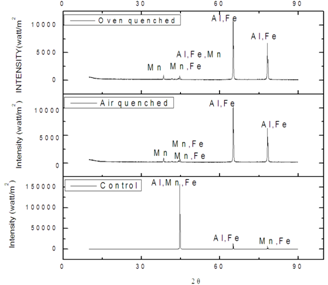 | Figure 5. XRD Spectra of control, oven quench and air quench samples of aluminium alloy AA3003 |
4. Conclusions
- The impact of Heat treatment of the electrochemical corrosion properties of Aluminium Alloy AA3003 within 0.1M HCl Acid environment was investigatedand showed that heat treatment degraded the alloy. This was shown in the open circuit potential, potentiodynamic polarization and impedance spectroscopy. The air quenched sample dissolved anodically, while oven quenched sample dissolved both cathodically and anodically when compare with the control sample. The diameters of the impedance loops of the heat treated samples are smaller than that of the control sample. The double layer capacitance increased in the heat treated samples with the air quenched sample being higher than oven quenched sample. This buttresses the fact that heat treated samples were attacked more than the control sample in the acid environment. The XRD data indicted decrease in peak intensity, crystalline size, and a shift into higher diffracting angle in the heat treated samples. There are multiple crystalline particles in the heat treated samples than in the control, this supports value of constant phase elements for the heated samples.In all samples, the particlescan be classified as nano particles since the particle sizes are very much less than 100nm. These particles aided in susceptibility of the samples within the 0.1 M HCl environment.
ACKNOWLEDGEMENTS
- TWAS is acknowledged for providing the electrochemical equipment used to carry out the experiment.Also First Aluminium is recognised for supplying sample coupons.
References
| [1] | E. M.Sherif, A.A. Almajid, F.H. Latif, H. Janaedi, Effect of Graphite on the Corrosion Behaviour of Aluminium Graphite Composite in Sodium Chloride Solution, In. J. Electrochem. Sci. 6, 1089, 2011. |
| [2] | M. Belkhaouda, L. Bazzi, R. Salghi, O. Jbara, A. Benlhachmi, B. Hammouti, J. Douglad, Effect of the heat treatment on the Behaviour of the Corrosion and Passivation of 3003 Aluminium Alloy in Synthetic Solution. J. Mater. Environ. Sci., 1, 25, 2010. |
| [3] | C.C. Yang, Electrodeposition of Aluminium in Molten ALCl3- - n- Butypyridinium Chloride Electrolyte, Mater. Chem. Physc. 37, 355, 1994. |
| [4] | M A. Amin, S.S. Abd El- Rehim, S.O. Moussa, A.S. Ellithy, Pitting Corrosion of Al and Al-Cu Alloy by ClO4- ions in neutral Sulphate Solution. ElectrochimicaActa, 53, 5644, 2008. |
| [5] | G.A. Capuano, W.G. Davenport, Electrodeposition of Aluminium from Alkyl Benzene Electrolyte. J. Electrochem. Soc., 118, 10, 1688, 1971. |
| [6] | H. O. Santos, C.T. Kunioshi, J. L. Rossi, I. Costa, The corrosion Behaviour of a Hypereutectic Al-Si alloy Obtained by Spray forming in Acid, Neutral and Alkaline Solutions. Mater. SCi. Forum, Vol. 350-1, 2006. |
| [7] | S. Gaute,Corrosion of Aluminium alloys, Dept. Mater. Technol. 7491, Troudhein, Norway, 2007. |
| [8] | M.Kissi, M. Bouklah, B. Hammouti, M. Benkaddour, Establishment of Equivalent Circuits from Electrochemical Impedance Spectroscopy Study of Corrosion Inhibition of Steel by Pyrazine in Sulphuric Acidic Solution. Appl. Surf. Sci. 252, 4190, 2006. |
| [9] | S.S. Abd El Rehim, H. H. Hassan, M.A. Amin, The corrosaion Inhibition Study of Sodium Dodecyl Benzene Sulphate to Aluminium and its Alloys in 1.0 M HClSoloution. MATER. Chem. Phys. 78, 337, 2002. |
| [10] | N. Sato, The Stability of Localized Corrosion, Corros. Sci. 37, 1947, 1995. |
| [11] | C. Park and H. Kwon, Electrochemical Noise Analysis of Localized Corrosion of Duplex Stainless Steel Aged at 4750C. Mater. Chem. Phys. 91, 355, 2005. |
| [12] | C.M.A. Brett, The Application of Electrochemical Impedance Techniques to Aluminium Corrosion in acidic Chloride Solutio. J. Appl. Electrochem. 20, 1000, 1990. |
| [13] | J. R. Macdonald, Impedance Spectroscopy. John Wiley & Sons, New York, 1987. |
| [14] | O.E. Barcia, J.L. Camara, O.R. Mattos, Measurements of Electrochemical Impedance on theAlloy Al 2024T3: An Analysis of Parameters used to predict the quality of the Anodic film. J. Appl. Electrochem. 17, 641, 1987. |
| [15] | C.M.A Brett, I.A.R. Gomes, J.P.S. Martins, Inhibition of Aluminium Corrosion in Chloride Media: An Impedance Study, J. Appl. Electrochem. 24, 1994. |
| [16] | C.M.A. Brett, H. Mohammadi, A. Amin, M. El Rhazi, Copper Modified Gold Electrode Specific for monosaccharide Detection Use in amperomtric Determination of Phenylmercuery based on Invertase Enzyme Inhibition,. Talanta, 62 951, 2004. |
| [17] | M. Metikos-Hukovic, R. Babic, Z. Grubac, The Study of aluminium Corrosion in Acidic Solution with Nontoxic Inhibitors. J. APPl.Electrochem. 32, 35, 2002. |
| [18] | M.A. Amin, Q. Mohsen, O.A. Hazzazi, Synergistic Effect of I- Ion on the Corrosion Inhibition of Al in 1.0 M Phosphoric Acid Solutions by Purine. Mater. Chem. Phys. 2008. Doi: 10: 1016/j. matchemphys. 10.057, 2008. |
| [19] | A.M. Abel- Gaber, E. Khamis, H. Abo- El Dahab, ShAdeel, Inhibition of Aluminium Corrosion in Alkaline Solution Using Natural Compound. Mater. Chem. Phys., 109, 297, 2008. |
| [20] | L. Diaz-Bollote, J.F. Lopez- Sansores, L.Maldonaldo- Lopez, L.F. Garfias- Mesias, Corrosion Behaviour of Aluminium Exposed to Biodiesel. Electrochem. Commm. 11, 41, 2009. |
| [21] | S. Caperali, A. Fossati, A Lavacchi, I Perissi, A. Tolstogouzov, U. Bardi, Aluminium Electroplated from Ionic Liquids as Protective Coating against Steel Corrosion. Corros. Sci. 50, 53l, 2008. |
| [22] | M.A. Amin, Q. Mohsen, G.A.M. Mersal, Inhibition of Uniform and Pitting Corrosion Processes of Al induced by SCN- Anions- Part 1. Effect of Glycine. Purtu. ElectrochemicaActa, , 28(2), 95, 2010. |
| [23] | C.D.S. Tuck, Use of Video, Techniques to Study the Electrochemical Activation and Corrosion of Aluminium Alloys. Farad. Discuss, 94,171, 1992. |
| [24] | E. M. Sherif, S. Park, Effects of 1, 4- Naphthoquinone on aluminium Corrosion in 0.5M Sodium Chloride Solutions, Electrochemica, Acta, 51, 1313, 2006. |
| [25] | K.F. Khaled, Electrochemical Investigation and Modeling of Corrosion Inhibition of Aluminium in Molar Nitric Acid using simeSulphur Containing Amines. Corros. Sci. 52,2905, 2010. |
| [26] | H.J. Linerincak, M.V.D. Linden, J.H.W. De Wit, Corrosion of Aluminium in Acidic and Neutral Solutions. ElectrochemicaActa, 38, 14, 1993. |
| [27] | J.B. Bessone, C. Mayer, K. Jutner, W.J. Lorenz, An EIS Study of Aluminium Barrier Type Oxide Film formed at Different Media. ElectrochimActa, 28, 171, 1983. |
| [28] | S.E. Frers, M.M. Stefenel, C. Mayer, T. Chierechie, AC Impedeance Measurements on Aluminium in Chloride Containing Solution and below PittingPotentials. J. Allp. Electrochem, 20, 996, 1990. |
| [29] | G.T. Burstein, R.J. Cinderey, The Potential of FreGhly generated Metal Surfaces Determined from the Guillotined Electrode- a new Technique, Corros. Sci. 32, 1195, 1991. |
| [30] | R.J. Cinderey, G.T. Burstein, Evolution of the Corrosion Potential of RepaasivatingAluminium Surfaces, Corros. Sci. 33, 475, 1992. |
| [31] | C. Andrieu, F. Dalard, J.J. Rameau, F. Alcouffe, M. Reboul, Aluminium Alloy Corrosion Detected by Magnetic Meaurement. J.Mater. Sci. 33, 3177, 1998. |
| [32] | J.S. Popovics, G. E. Gallo, P.L. Chapman, Corrosion monitoring of Metals through Magnetic Sensing. NDTCE 09, Non-Destructive Testing in Civil Engineering Nantes France, June 30th – July 3rd 2009. |
| [33] | Y.C. Tang, A.J. Davenport, Magnetic Field Effects on the Corrosion of Artificial Pit Electrodes and Pits in Thin Films. J. Electrochem. Soc. 154, 7, 2007, C362. |
| [34] | A. Chiba, K. Kawazu, O. Nakano, T. Tambera, S. Yoshihara, E. Sato, The Effects of Magnetic Fields on the corrosion of Aluminiumfoil in Sodium Chloride Solution, Corros. Sci. 36, 3, 1994. |
| [35] | E. Sabava, Magnetic Field Efects on the Aluminium Dissolution. Intern. Sci. Confm 4th-5th, June, 2009, Stara Zagora, Bulgaria. |
| [36] | V. Branzoi, F. Golgoriu, F. Branzoi, Aluminium Corrosion in Hydrochloric Acid Solution and the Effect of some Organic Inhibitors. Mater. Chem. Phys. 78,122, 2002. |
| [37] | A. Popova, E. Sokolova, S. Raicheva, M. Christov, AC and DC Study of the Temperature Effect on the Mild Steel Corrosion in Acidic Media in the Presence of Benzimidazole Derivatives, Corros. Sci. 43, 33, 2003. |
| [38] | N. Perez, Electrochemistry and Corrosion Science, Kluwer, Norwell, USA, 2004. |
| [39] | A. Davoodi, PhD Thesis, Royal Institute of Technol, Stockholm, Sweden, 2007. |
| [40] | F.B. Growcock, I Jasinski, Time Resolved Impedance Spectroscopy of mild Steel in Concentrated Hydrochloric Acid. Electrochem. Soc. 136, 2310, 1989. |
| [41] | S. Veleva, A. Popova, S. Raicheva, Proceedings of the 7th European Corros. Inhibit. Ferrera, 149, 1990. |
| [42] | R.G. Kelly, J.R. Scully, D.W. Shoesmith, R.G. Buchheit, ,Electrochemical Techniques in Corrosion Science and Engineering, Marcel Dekker, Inc. New York, Basel, 2002. |
| [43] | B.D. Cullity,Element of X-Ray Diffraction, 2nd Ed. Addison-Wesley Pub. Coy California, USA, 1978. |
| [44] | Y.J. Li, L. Arnberg, Evolution of eutectic intermetallic particlesin DC-Cast AA3003 alloy during heating and homogenization, Mater. Sci. Eng. A, 347, 2003. |