-
Paper Information
- Next Paper
- Previous Paper
- Paper Submission
-
Journal Information
- About This Journal
- Editorial Board
- Current Issue
- Archive
- Author Guidelines
- Contact Us
American Journal of Materials Science
p-ISSN: 2162-9382 e-ISSN: 2162-8424
2012; 2(1): 46-50
doi: 10.5923/j.materials.20120201.09
Synthesis, Structural and Magnetic Characterization of Ni-Doped ZnO Diluted Magnetic Semiconductor
R. Elilarassi , G. Chandrasekaran
Department of Physics, School of Physical, Chemical and Applied Sciences, Pondicherry University, Puducherry, 605014, India
Correspondence to: R. Elilarassi , Department of Physics, School of Physical, Chemical and Applied Sciences, Pondicherry University, Puducherry, 605014, India.
| Email: |  |
Copyright © 2012 Scientific & Academic Publishing. All Rights Reserved.
In the present work, Zn1−xNixO (x = 0.02, 0.04, 0.06 and 0.08) nanoparticles have been synthesized using sol-gel auto-combustion method. The structural and magnetic properties of the Ni-doped ZnO samples annealed at 800oC were characterized by Thermogravimetry/Differential thermal analysis (TG/DTA), X-ray diffractometer (XRD), Scanning electron microscope (SEM), FTIR spectrophotometer, Vibrating sample magnetometer (VSM) and Electron paramagnetic resonance (EPR) spectroscopy. Thermal analysis of as–prepared Zn0.98Ni0.02O sample shows that the synthesis process undergoes two stage weight losses before yielding Zn0.98Ni0.02O nanoparticles. Structural analysis using XRD reveals the formation of hexagonal wurtzite structure. SEM micrographs of Zn0.98Ni0.02O show the presence of spherical nanoparticles and the formation of well defined pores in the sample. FTIR study confirms the formation of ZnO with the stretching vibrational mode around 525 cm-1. VSM measurement of sample (Zn0.96Ni0.04O) shows the hysteresis loop at room temperature confirms the ferromagnetic property of the sample. EPR spectra of the nickel doped ZnO samples suggest that the exchange interaction between Ni2+ ions results in the ferromagnetic nature of the samples.
Keywords: Ni-doped ZnO, auto-combustion, X-ray diffraction, diluted magnetic semiconductor
Cite this paper: R. Elilarassi , G. Chandrasekaran , "Synthesis, Structural and Magnetic Characterization of Ni-Doped ZnO Diluted Magnetic Semiconductor", American Journal of Materials Science, Vol. 2 No. 1, 2012, pp. 46-50. doi: 10.5923/j.materials.20120201.09.
Article Outline
1. Introduction
- Diluted magnetic semiconductors (DMS) obtained by introducing a dilute amount of transition metal ions into semiconductors in which the transport and magnetic properties combined in a single substance. DMS have attracted immense interest among the researchers and intensively studied for their potential technological applications such as generating and manipulating spin-polarized currents[1]. DMS with the use of spin carriers in addition to charge carriers, as an added degree of freedom is a promising candidate material in the field of magnetic recording media[2]. In addition, DMS materials have several advantages such as instant-on computer, increased integration density, higher data processing speed, low electrical energy demand and compatibility of their fabrication processes[3]. Recently, investigations on oxide diluted magnetic semiconductors such as transition metal doped ZnO, TiO2, CeO2, SnO2, have triggered great revolution among the researchers for the emerging field of spintronics device applications. This is so because, a DMS based on III-V semiconductors such as GaAs, InAs doped with transition metals shows ferromagnetism only at very low temperatures[4,5]. For an efficient DMS material, its Curie temperature above room tempera- ture is desired. Transition metal doped ZnO have been under intense investigation since the theoritical prediction of curie temperature to be he above room temperature[6]. Many reports on the nickel doped ZnO diluted magnetic semiconductor with room temperature ferromagnetism in the form of thin films and nanocrystals[7-11]. Despite a number of reports available on nickel doped ZnO, still lot of controversies persists on the existence and origin of room temperature ferromagnetism in this system. In the present work, we have made an attempt to investigate Zn1−xNixO (0.02 < x <0.08) using the sol–gel auto-combustion method. The present synthesis method has several advantages such as cost effective, lesser synthesis time, requires low temperature for processing and requisite amount of final product. The results of the structural, thermal and magnetic characterization of synthesized Ni-doped nanocrystals are also presented. The powder samples of different concentration of Ni-doped ZnO have been characterized with regard to their thermal stability (TGA/DTA), phase(s) (XRD and FTIR), microstructure (SEM), and magnetic properties (VSM and EPR).
2. Experimental Procedure
- Nanocrystalline Zn1-xNixO (x = 0.02, 0.04, 0.06, 0.08) powder samples were synthesized by a simple and low-temp- erature auto-combustion method. The stoichiometric amount of the aqueous solution containing the analytical grade metal nitrates (oxidizer) Zn(NO3)26H2O, Ni(NO3)26H2O, and glycine (fuel) C2H5NO2 was calculated based on the total oxidizing and reducing valency of oxidizer and the fuel, which serve as a numerical coefficient for the stoichiometric balance such that the equivalence ratio is unity, i.e. O:F = 1.0[12] and the energy released is at a maximum. Fig.1. Shows the schematic diagram of autocombustion method to prepare nickel doped ZnO nanoparticles.
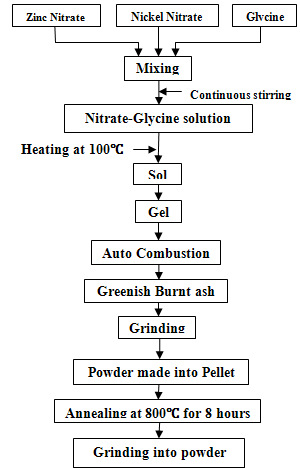 | Figure 1. Shows the schematic diagram of autocombustion method to prepare nickel doped ZnO Nanoparticles |
3. Characterization
- Thermogravimetric (TG) and differential thermal analysis (DTA) of the powder sample were carried out at a heating rate of 10oC/min using TA SDT Q600 2960 analyzer (). The crystalline nature and the phase purity of the powder samples were examined by X-ray powder diffraction (XRD) with (PAnalytical Model: X’Pert PRO). The microstructure of the powder sample (Zn0.98Ni0.02O) was investigated using Scanning Electron Microscope (SEM) (HITACHI Model: S-3400 N). Infrared spectra of the powder samples were recorded using Fourier Transform Infra-Red Spectrophotometer (FTIR) (Nicolet-6700) from 400 to 4000 cm-1 by the KBr pellet method. Magnetic properties of the Zn0.96Ni0.04O sample were experimentally studied by measuring magnetization as a function of external magnetic field at room temperature using Vibrating sample magnetometer (VSM) (Lakeshore 7404). Electron spin paramagnetic resonance (EPR) characteristics of the powder samples were studied using (JES-TE100 ESR spectrometer). The structural and magnetic measurements of the samples were carried out at room temperature except EPR study performed at 77K.
4. Results and Discussion
4.1. Thermal Analysis
- TG-DTA analyses of the as-synthesized Zn0.98Ni0.02O powder sample was carried out to determine the appropriate calcination temperature. Fig.2. shows the TG-DTA curves of Zn0.98Ni0.02O. The as-synthesized powder Zn0.98Ni0.02O sample was heated in the presence of nitrogen atmosphere at the rate of 10℃/min in the temperature range 115.0℃ to 180.0℃ with 8% weight loss. The weight loss may be due to the evaporation of water content present in the Zn-Ni precursors and can be verified from DTA curve that shows an endothermic peak at 172℃. The second stage of decomposition has been observed in the temperature range of 330℃–405℃ with an endothermic peak at 380℃ that indicates a weight loss of 27% due to the decomposition of Ni–Zn precursor to the formation of Zn0.98Ni0.02O. Since there is no appreciable change in weight above 400℃, the calcination temperature of the powder was optimized at 405℃.
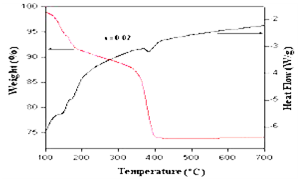 | Figure 2. TG/DTA curve of as-prepared Zn1−xNixO (x = 0.02) sample |
4.2. Structural Analysis
- Fig. 3 shows the X-ray diffraction patterns of nickel doped ZnO nanoparticles synthesized using auto-combustion method. The XRD patterns of Zn1−xNixO (x = 0.02, 0.04, 0.06, 0.08) samples annealed at 800℃ shows the reflection planes indexed to wurtzite hcp structure of ZnO (space group P63mc, JCPDF # 36-1451)[13].
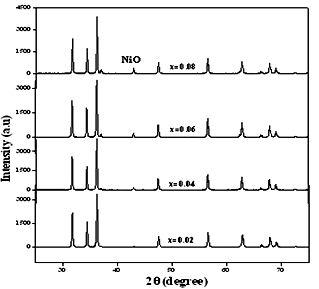 | Figure 3. XRD patterns of Zn1−xNixO (x = 0.02, 0.04, 0.06, 0.08) powders annealed at 800℃ |
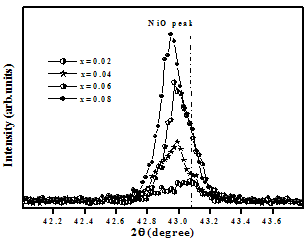 | Figure 4. Variation of 2 theta of NiO peak with the doping concentration of Zn1-xNixO samples annealed at 800℃ |
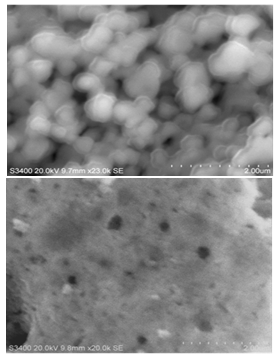 | Figure 5. SEM micrographs of Zn0.98Ni0.02O sample annealed at 800℃ |
4.2. FTIR Analysis
- Fig.6. shows the FT-IR spectra of Zn1-xNixO (x=0.02, 0.04, 0.06, 0.08) nanocrystals annealed at 800℃. From the FTIR spectra, the strong vibrational mode observed at 525 cm−1 is assigned to stretching vibrations of ZnO[15].
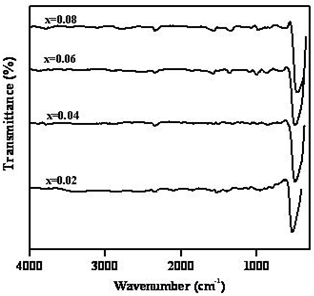 | Figure 6. FTIR spectra of Zn1-xNixO (x = 0.00, 0.02, 0.04, 0.06, 0.08) samples annealed at 800℃ |
4.3. VSM Study
- Magnetization measurements on Zn0.96Ni0.04O nanoparticles annealed at 800℃ were performed using vibrating sample magnetometer at room temperature. Fig. 7 shows the hysterisis loop obtained from the magnetization M versus field H data for Zn0.96Ni0.04O. From the magnetic hysteresis loop (M–H curve) of Zn0.96Ni0.04O (Fig.7), it is clear that the nanoparticles are ferromagnetic at room temperature. The values of their saturation magnetization (Ms) and coercive field (Hc) are 0.004 emu/g and 90G.
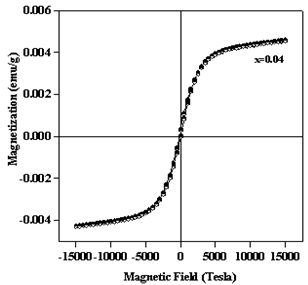 | Figure 7. The magnetic hysteresis loops (M–H curve) of Zn0.96Ni0.04O sample |
4.4. Electron Paramagnetic Resonance
- EPR spectra of Ni(II) in ZnO have been recorded on a JEOL JES-TE100 ESR spectrometer operating at X-band frequency 9.38653 GHz with microwave power of 1.00mW in the field range 0–500 mT, having a 100 kHz field modulation at 77K to obtain the first derivative EPR spectrum. Fig. 8. shows the EPR spectra of nickel doped ZnO samples annealed at 800℃. All spectra exhibit a symmetric and narrow resonance signal. From the EPR spectra of the samples, a minor shift of g-value from the free electron position being 2.002 is observed.
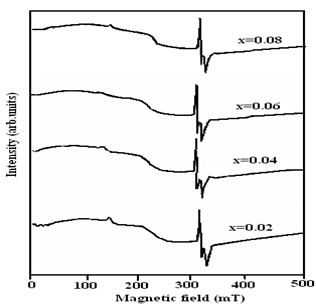 | Figure 8. EPR spectrum of Zn1-xNixO (x = 0.02, 0.04, 0.06, 0.08) Ni-doped ZnO nanoparticles annealed at 800℃ |
5. Conclusions
- In summary, nanocrystalline Ni-doped ZnO were successfully synthesized by sol-gel auto-combustion method. XRD analysis reveals the formation of hexagonal wurtzite structure for all the nickel doped ZnO samples annealed at 800℃. With increasing Ni content, phase segregation has occurred in the samples. Room temperature magnetic hysteresis loop of Zn1–xNixO (x=0.04) sample confirms the ferromagnetic property of the sample. EPR analysis of the samples indicates that the resonant field decreases with increasing Ni content due to the super-exchange interactions between Ni2+ ions in the lattice.
ACKNOWLEDGEMENTS
- The authors wish to thank the central instrumentation facility, for providing TG/DTA, SEM, VSM and FTIR studies. We wish to thank UGC for funding XRD measurement at Department of physics, , Puducherry and Department of Chemistry for providing EPR analysis.
 Abstract
 Reference
 Full-Text PDF
 Full-Text HTML