-
Paper Information
- Next Paper
- Previous Paper
- Paper Submission
-
Journal Information
- About This Journal
- Editorial Board
- Current Issue
- Archive
- Author Guidelines
- Contact Us
American Journal of Materials Science
p-ISSN: 2162-9382 e-ISSN: 2162-8424
2012; 2(1): 37-40
doi: 10.5923/j.materials.20120201.07
Structural Transitions of Silicate Nanocrystals in the Glass
 Abstract
 Reference
 Full-Text PDF
 Full-Text HTML
G. Abdurakhmanov , G. S. Vakhidova
Institute of Power Engineering and Automation, the Uzbek Academy of Sciences, 29 Do’rmon yo’li, Tashkent, 100125 Uzbekistan
Correspondence to: G. Abdurakhmanov , Institute of Power Engineering and Automation, the Uzbek Academy of Sciences, 29 Do’rmon yo’li, Tashkent, 100125 Uzbekistan.
| Email: |  |
Copyright © 2012 Scientific & Academic Publishing. All Rights Reserved.
The temperature dependences of resistivity and thermopower measurements reveal that nanocrystals of silicates in lead-silicate glass of various compositions undergo structural transitions in the temperature range of 800 – 1000 K. The diameter of these nanocrystals estimated from Scherrer’s formula is about 0.8 – 1.6 nm and each nanocrystal consists of 8 - 64 unit cells. Structure transitions are detected as sharply maxima of resistivity ρ and thermopower S at temperature T = 800 – 100 K. Lead-silicate glass was doped by RuO2 up to 16 weight% to facilitate the measurements of the ρ and the S. The doped lead-silicate glass has a metal-like behavior at the room temperature: the temperature dependences ρ(T) and S(T) are very slow, the value of the S is typical for metals (few and tens of μV/K). Beyond the maximum of the resistance (temperature T > 1000 K) doped lead-silicate glass turns into typical semiconductor having energy gap about 0.05 – 1.5 eV depending on the composition of the glass. Anomalous thermal expansion of the RuO2 relict crystals is detected at the temperatures of 800 – 1000 K as well.
Keywords: structure transitions in nanocrystals, silicate glass, thermopower, resistivity, doping, thermal expansion
Cite this paper: G. Abdurakhmanov , G. S. Vakhidova , "Structural Transitions of Silicate Nanocrystals in the Glass", American Journal of Materials Science, Vol. 2 No. 1, 2012, pp. 37-40. doi: 10.5923/j.materials.20120201.07.
1. Introduction
- Structural transitions as a fundamental property of interacting atoms in the crystalline state are very important for basic knowledge and applications. These transitions are collective phenomenon and therefore should depend on the number of atoms in the sample, i.e. on the size of the latter one. For example, the Curie temperature TC for nanostructured ferroelectrics decreases with the size d of nanocrystals as d-1, with it’s lowest value reaching Tc ≈ 300 K at d ≈ 3 nm (fig. [1]). The size of nanocrystals in these investigations was defined as the diameter of nanowire, i.e. in two directions only, while in the third direction (along the wire) the value of this parameter might be significantly higher.Structural transitions in nanocrystals of LaMnO3, having average dimensions about 15 - 20 nm, were investigated in [2]. It was found that transition temperature TC in these nanocrystals undergoes a reduction up to TC=493±10 K in compared to TC=750 K in the bulk samples.To our knowledge, there is no information about structural transitions in smaller nanocrystals and in the nanocrystals formed in the glass.All the silicate glasses have been devitrificated in time (tens or hundreds of years) so one can assume that nanocrystals of silica and various silicates are formed naturally in silicate glasses and structural transformations should take place in them. Dimensions of these nanocrystals are 1 – 2 nm as follows from X-ray diffraction patterns (Scherrer’s formula). For example, the structural transition of β-quartz into α-quartz and vice versa takes place at 846 K and is accompanied by the increase of the unit cell volume by about 6 %[3]. Increase of interatomic distances due to the structural transitions leads to decrease in the electrical conductivity of the sample, so this effect can be exploited for collecting the information about the structural transitions. The unit cell of the β-quartz is trigonal with a = 0.4893 nm, c = 0.5384 nm at the room temperature, while the α-quartz is hexagonal with a = 0.4983 nm, c = 0.5419 nm at 848 K.Direct and doubtless evidences of existence of nanocrystals in the glass have not been thoroughly investigated before. That is why the problem of the glass structure (continuous random network, Zachariasen, 1932; microcrystallits, separated by interlayer of disordered atoms, Lebedev, 1921) is still the subject of discussions. But the temperature dependence of some glass properties such as viscosity, thermal expansion coefficient, dielectric constant and dielectric loss, have anomalies which have a better agreement with microcrystalline theory. This is especially the case of many- component glasses.Here we show that structural transitions take place in nanocrystals of the average size of 1 – 2 nm in doped lead-silicate glass and are accompanied by sharp increase of the resistivity ρ and the Seebeck coefficient S at the temperatures below 1123 K. We found that at these temperatures the value of ρ is 2 – 6 times higher than that value at room temperature and S may be as high as 103 µV/K. Both ρ and S are affected by chemical composition of the glass.Direct investigations of the structure of nanocrystals smaller than 3 – 4 nm by diffraction methods (X-ray or neutron) are problematic, so one is forced to probe them by the indirect methods such as the measurements of the electrical properties (conductivity and thermopower). For example, structure transformations in ferroelectrics leads to sharp increase of resistivity ρ and decrease of permittivity ε as the interatomic distances increase[4].
2. Experiment
- The samples of glass were doped by RuO2 to reduce the resistivity and to enhance the thermopower in our experiments, so it is possible to measure the reduced value of resistivity of about 10-2 – 105 Ohm·cm more accurately than that of the glass (about 1015 – 1016 Ohm·cm). The doping process used here is standard for technology of thick film resistors and was described elsewhere[5] (the mixture of the glass and the dopant powders have been fired at Tf = 1125 K in τ = 10 min). Content of RuO2 in our samples of doped glass was 16, 20 and 30 weight %. The lead-silicate glasses investigated have the following composition (weight %): Glass1 SiO2 – 33; PbO – 67; Glass2 SiO2 – 27; PbO – 67; BaO – 4; MgO – 2.The mixture of oxides have been melted at temperatures 1723±20 K (glass1) and 1623±20 K (glass2) for 1 h. Density of the glasses by hydrostatic weighing is 4.81±0.02 g·cm-3 for the glass1 and 5.13±0.02 g·cm-3 for the glass2. The glass transition temperature Tg have been evaluated by thermomechanical analysis (TMA, temperature dependence of the thermal expansion coefficient) and was found to be 760±20 K for the glass1 and 785±20 K for the glass2.Samples of the doped glass for electrical measurements were the bulk material: in diameter and in height with the Pt or Ag electrodes. Samples for X-ray investigations were powders. The Pt heater of the D500 Siemens X-ray diffractometer was coated by these powders in the nitrocellulose lacquer. In the final X-ray patterns the diffraction lines of Pt have been deleted.The values of resistance and thermopower were measured by digital multimeter Sch-300 having error less than 0.2%. The temperature was measured by the same multimeter and standard Pt-PtRh thermocouple. The thermocouple was calibrated in standard temperature points of water boiling (373 K), tin and silver solidification (505 and 1234 K accordingly).We do not use the transmission electron microscopy (TEM) to investigate the nanocrystals in the silicate glass for the following reasons: i) very thin films of the material are required to investigate by TEM, and preparation process of them can significantly affect the structure of nanocrystals in a glass; ii) these thin films of the silicate glass loose the shape due to firing up to 700 – 800 K and form drops, so TEM investigations become impossible.
3. Results and Discussion
- The X-ray diffraction patterns for glass1 before and after doping are shown in fig. 1. From Scherrer’s formula for CuKα radiation (λ = 0.15418 nm) we evaluate the size of nanocrystals L ≈ 0.87 nm in the undoped glass1 and L ≈ 1.53 nm in the doped glass1. The same values were found for the glass2 as well. The main reflexes of polymorphs of silica and the lead silicates are in area d = 3 – 5 Å. This conforms to wide halo at 2θ ≈ 31.86° for nondoped glass1 (having molecular composition 2SiO2∙PbO) (fig.1).
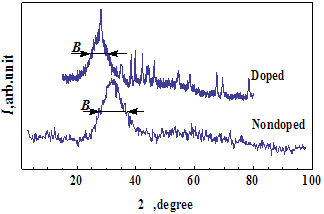 | Figure 1. X-ray diffraction pattern for glass1 befor and after doping. Sharp peaks are due to relicts of RuO2. B is the line broadening at half maximum of intensity (in radians) |
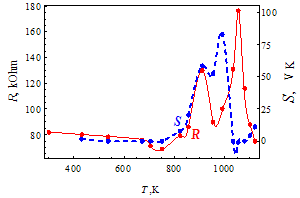 | Figure 2. Temperature dependence of the resistance R(T) and the thermopower S(T) for the doped glass 1. |
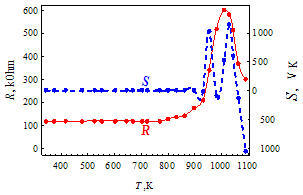 | Figure 3. Temperature dependence of the resistance R(T) and the thermopower S(T) for the doped glass 2 |
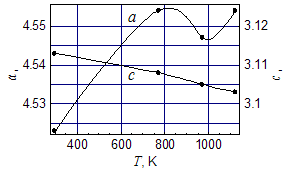 | Figure 4. Temperature dependence of the lattice constants of RuO2 crystals in the free powder in a and c directions |
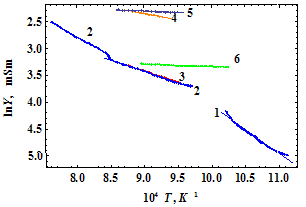 | Figure 5. Temperature dependence of the conductivity Y(T) after maximum for the samples of the doped glass1 (1) and glass2 (2 – 6) with RuO2 content about 16 wt % (1, 2), 20 wt% (3, 4) and 30 wt% (5, 6). Activation energy of conductivity Eσ is about (eV): 1.77 (1); 1.54 (2, lower T) and 0.93 (2, high T); 0.9 (3); 0.52 (4); 0.05 (5) and 0.047 (6). The solid lines are the fit of the experimental data with the expression lnY=a+Eσ/(2kT) |
4. Conclusions
- Nanocrystals of silica and silicates with the size of 0.8 – 1.6 nm undergo structural transitions at the temperatures 800 – 1000 K, detected as sharp maxima of the resistance and thermopower of the lead-silicate glass, doped by RuO2. Before these maxima the temperature dependence of the parameters and the value of the thermopower are typical for metals, while after maxima resistance assumes an activation character with activation energy of 0.05 – 1.5 eV depending on the glass composition. It is shown that the RuO2 relict crystals are not responsible for these anomalies because of the lattice constriction in the temperature region of these maxima (800 – 1000 K) and reduction of their resistivity. At maxima the value of the resistance may be 6 – 10 times higher than that at room temperature, and value of the thermopower is 10 – 100 times higher than at room temperature.
ACKNOWLEDGEMENTS
- We acknowledge the Uzbek Academy of Sciences for the financial support (Grant in the Support of Fundamental Research, grant NN 55-08 and 27-10).