American Journal of Materials Science

p-ISSN: 2162-9382    e-ISSN: 2162-8424

2012;  2(1): 26-31

doi: 10.5923/j.materials.20120201.05

Effect of Load and Sliding Velocity on Friction Coefficient of Aluminum Sliding Against Different Pin Materials

Dewan Muhammad Nuruzzaman , Mohammad Asaduzzaman Chowdhury

Department of Mechanical Engineering, Dhaka University of Engineering and Technology, Gazipur-1700, Bangladesh

Correspondence to: Dewan Muhammad Nuruzzaman , Department of Mechanical Engineering, Dhaka University of Engineering and Technology, Gazipur-1700, Bangladesh.

Email:

Copyright © 2012 Scientific & Academic Publishing. All Rights Reserved.

Abstract

In the present research, friction coefficients of aluminum sliding against different pin materials are investigated and compared. In order to do so, a pin on disc apparatus is designed and fabricated. Experiments are carried out when different types of pin such as aluminum, copper and brass slide on aluminum disc. Experiments are conducted at normal load 5, 7.5 and 10 N, sliding velocity 0.5, 0.75 and 1 m/s and relative humidity 70%. Variations of friction coefficient with the duration of rubbing at different normal load and sliding velocity are investigated. Results show that friction coefficient varies with duration of rubbing, normal load and sliding velocity. In general, friction coefficient increases for a certain duration of rubbing and after that it remains constant for the rest of the experimental time. Moreover, the obtained results reveal that friction coefficient increases with the increase in normal load and sliding velocity for all the tested pairs. The magnitudes of friction coefficient are different for different material pairs depending on normal load and sliding velocity.

Keywords: friction coefficient, normal load, sliding velocity, duration of rubbing, aluminum, copper, brass

Cite this paper: Dewan Muhammad Nuruzzaman , Mohammad Asaduzzaman Chowdhury , "Effect of Load and Sliding Velocity on Friction Coefficient of Aluminum Sliding Against Different Pin Materials", American Journal of Materials Science, Vol. 2 No. 1, 2012, pp. 26-31. doi: 10.5923/j.materials.20120201.05.

1. Introduction

Study of mechanics of friction and the relationship between friction and wear dates back to the sixteenth century, almost immediately after the invention of ’s law of motion. It was observed by several authors[1-14] that the variation of friction depends on interfacial conditions such as normal load, geometry, relative surface motion, sliding velocity, surface roughness of the rubbing surfaces, surface cleanliness, type of material, system rigidity, temperature, stick-slip, relative humidity, lubrication and vibration. Among these factors normal load and sliding velocity are the two major factors that play significant role for the variation of friction. In the case of materials with surface films which are either deliberately applied or produced by reaction with environment, the coefficient of friction may not remain constant as a function of load. In many metal pairs, the friction coefficient is low at low loads and a transition occurs to a higher value as the normal load is increased. At low loads, the oxide film effectively separates two metal surfaces and there is little or no true metallic contact, hence the friction coefficient is low. At higher load conditions, the film breaks down, resulting in intimate metallic contact, which is responsible for higher friction[15]. It was observed that the coefficient of friction may be very low for very smooth surfaces and/or at loads down to micro-to-nanonewton range[16, 17]. The third law of friction, which states that friction is independent of velocity, is not generally valid. Friction may increase or decrease as a result of increased sliding velocity for different materials combinations. An increase in the temperature generally results in metal softening in the case of low melting point metals. An increase in temperature may result in solid-state phase transformation which may either improve or degrade mechanical properties[13]. The most drastic effect occurs if a metal approaches its melting point and its strength drops rapidly, and thermal diffusion and creep phenomena become more important. The resulting increased adhesion at contacts and ductility lead to an increase in friction[13]. The increase in friction coefficient with sliding velocity due to more adhesion of counterface material (pin) on disc.
It was reported[18-21] that friction coefficient of metals and alloys showed different behavior under different operating conditions. In spite of these investigations, the effects of normal load and sliding velocity on friction coefficient of different material pairs are yet to be clearly understood. Therefore, in this study an attempt is made to investigate the effect of normal load and sliding velocity on frictional behavior of different material combinations. Moreover, the effects of duration of rubbing on friction coefficient of these materials are examined in this study. It is expected that the applications of these results will contribute to the different concerned mechanical processes. Nowadays, different nonferrous material combinations are widely used for sliding/rolling applications where low friction is required. Due to these tribological applications, different material combinations have been selected in this research study.
Within this research, it is sought to better understand the relation between friction and different material combinations under different normal loads and sliding velocities and to explore the possibility of adding controlled normal load and sliding velocity to a mechanical process as a means to improve performance and quality in industry.

2. Experimental

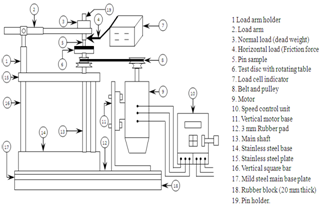
Figure 1. Block diagram of the experimental set-up
Table 1. Experimental Conditions
     
A schematic diagram of the experimental set-up is shown in Fig. 1 i.e. a pin which can slide on a rotating horizontal surface (disc). In this set-up a circular test sample (disc) is to be fixed on a rotating plate (table) having a long vertical shaft clamped with screw from the bottom surface of the rotating plate. The shaft passes through two close-fit bush-bearings which are rigidly fixed with stainless steel plate and stainless steel base such that the shaft can move only axially and any radial movement of the rotating shaft is restrained by the bush. These stainless steel plate and stainless steel base are rigidly fixed with four vertical round bars to provide the rigidity to the main structure of this set-up. The main base of the set-up is constructed by 10 mm thick mild steel plate consisting of 3 mm thick rubber sheet at the upper side and 20 mm thick rubber block at the lower side. A compound V-pulley above the top stainless steel plate was fixed with the shaft to transmit rotation to the shaft from a motor. An electronic speed control unit is used to vary the speed of the motor as required. A 6 mm diameter cylindrical pin made of aluminium, copper and brass (64%Cu-34%Zn-2%Pb) whose contacting foot is flat, fitted on a holder is subsequently fitted with an arm. The arm is pivoted with a separate base in such a way that the arm with the pin holder can rotate vertically and horizontally about the pivot point with very low friction. To measure the frictional force acting on the pin during sliding on the rotating plate, a load cell (TML, Tokyo Sokki Kenkyujo Co. Ltd, CLS-10NA) along with its digital indicator (TML, Tokyo Sokki Kenkyujo Co. Ltd, Model no. TD-93A) was used. The coefficient of friction was obtained by dividing the frictional force by the applied normal force (load). Before friction tests, the average surface roughness of aluminum test sample was found to be Ra= 0.4-0.5 μm. Each test was conducted for 300 seconds of rubbing time with new pin and test sample. Furthermore, to ensure the reliability of the test results, each test was repeated five times and the scatter in results was small, therefore the average values of these tests were taken into consideration. The accuracy level of the obtained friction coefficient is within ±1%. The detail experimental conditions are shown in Table 1.

3. Results and Discussion

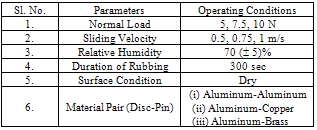
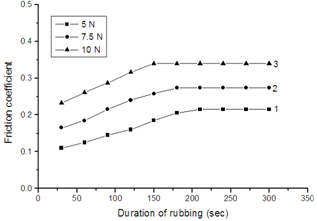
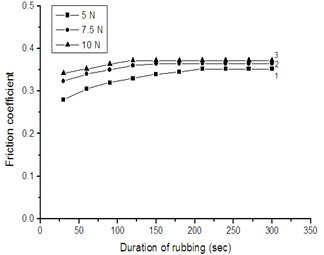
Figure 2 shows the variation of friction coefficient with the duration of rubbing at different normal load for aluminum-aluminum pair. During experiment, the sliding velocity and relative humidity were 1 m/s and 70% respectively. Curve 1 of this figure is drawn for normal load 5 N. From this curve, it is observed that during the starting, the value of friction coefficient is 0.11 and then increases very steadily up to 0.215 over duration of 210 seconds of rubbing and after that it remains constant for the rest of the experimental time. At the initial stage of rubbing, friction is low and the factors responsible for this low friction are due to the presence of a layer of foreign material on the disc surface. This layer on the disc surface in general comprises of (i) moisture, (ii) oxide of metals, (iii) deposited lubricating material, etc. Aluminum readily oxidizes in air, so that, at initial duration of rubbing, the oxide film easily separates the two material surfaces and there is little or no true metallic contact and also the oxide film has a low shear strength. After initial rubbing, the film (deposited layer) breaks up and clean surfaces come in contact which increase the bonding force between the contacting surfaces. At the same time due to the ploughing effect, inclusion of trapped wear particles and roughening of the disc surface, the friction force increases with duration of rubbing. After a certain duration of rubbing, the increase of roughness and other parameters may reach to a certain steady state value and hence the values of friction coefficient remain constant for the rest of the time. Curves 2 and 3 of this figure are drawn for normal load 7.5 and 10 N respectively and show similar trends as that of curve 1. From these curves, it is also observed that time to reach steady state values is different for different normal load. Results show that at normal load 5, 7.5 and 10 N, aluminum-aluminum pair takes 210, 180 and 150 seconds respectively to reach steady friction. It indicates that the higher the normal load, the time to reach steady friction is less. This is because the surface roughness and other parameter attain a steady level at a shorter period of time with the increase in normal load. The trends of these results are similar to the results of Chowdhury and Helali[22, 23].
Figure 3 shows the effect of the duration of rubbing on the value of friction coefficient at different normal load for aluminum-copper pair at speed of 1 m/s and 70% of relative humidity. Curve 1 of this figure drawn for normal load 5 N, shows that during starting of the experiment, the value of friction coefficient is 0.175 which rises for few seconds to a value of 0.27 and then it becomes steady for the rest of the experimental time. Almost similar trends of variation are observed in curves 2 and 3 which are drawn for load 7.5 and 10 N respectively. From these curves, it is found that time to reach steady friction is different for different normal load. At normal load 5, 7.5 and 10 N, aluminum-copper pair takes 210, 150 and 120 seconds respectively to reach steady friction. That is, higher the normal load, aluminum-copper pair takes less time to stabilize.
Figure 2. Variation of friction coefficient with the variation of duration of rubbing and normal load (sliding velocity: 1 m/s, relative humidity: 70% pair: aluminum-aluminum)
Figure 3. Variation of friction coefficient with the variation of duration of rubbing and normal load (sliding velocity: 1 m/s, relative humidity: 70%, pair: aluminum-copper)
Figure 4 is drawn to show the variation of friction coefficient with the duration of rubbing at different normal load for aluminum-brass pair. This figure is drawn for sliding velocity of 1 m/s and 70% relative humidity. Curve 1 of Fig. 4 is drawn for 5 N shows that during starting of the running-in, the value of friction coefficient is 0.28 which increases for few seconds to a value of 0.352 and after that it remains constant for the rest of the experimental time. Similar trends of variation are observed for normal load 7.5 and 10 N which are shown in curves 2 and 3 respectively. From these curves, it is also observed that time to reach steady state values is different for different normal load. Results show that at normal load 5, 7.5 and 10 N, aluminum-brass pair takes 210, 150 and 120 seconds respectively to reach constant friction. It indicates that the higher the normal load, the time to reach constant friction is less. This is because the surface roughness and other parameter attain a steady level at a shorter period of time with the increase in normal load.
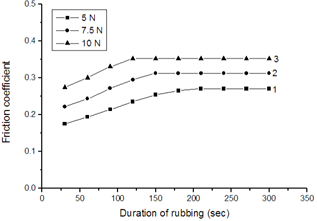
Figure 4. Variation of friction coefficient with the variation of duration of rubbing and normal load (sliding velocity: 1 m/s, relative humidity: 70%, pair: aluminum-brass)
Figure 5 shows the comparison of the variation of friction coefficient with normal load for the above said material pairs. Curves of this figure are drawn for aluminum-aluminum, aluminum-copper and aluminum-brass pairs. It is shown that friction coefficient varies from 0.215 to 0.343, 0.27 to 0.352 and 0.352 to 0.372 with the variation of normal load from 5 to 10 N for aluminum-aluminum, aluminum-copper and aluminum-brass pairs respectively. These results show that friction coefficient increases with the increase in normal load.
The increase of friction coefficient with the increase of normal load may be due to increase in the adhesion strength. In many metal pairs, the friction coefficient is low at low loads and a transition occurs to a higher value as the normal load is increased. At low loads, the oxide film effectively separates two metal surfaces and there is little or no true metallic contact, hence the friction coefficient is low. At higher load conditions, the film breaks down, resulting in intimate metallic contact, which is responsible for higher friction[15].
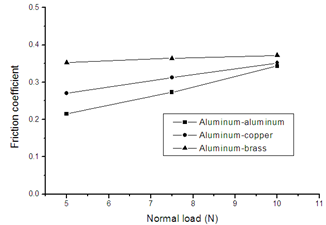
Figure 5. Variation of friction coefficient with the variation of normal load for different material-pair (sliding velocity: 1 m/s, relative humidity: 70%)
From the obtained results, it can also be seen that the highest values of the friction coefficient are obtained for aluminum-brass pair and the lowest values of friction coefficient are obtained for aluminum-aluminum pair. The values of friction coefficient of aluminum-copper pair are found in between the highest and lowest values. It was found that after friction tests, the average roughness of aluminum disc of aluminum-aluminum, aluminum-copper and aluminum-brass pairs varied from 0.8-1.2, 1.1-1.5 and 1.4-1.6 μm respectively.
Figures 6, 7 and 8 show the variation of friction coefficient with the duration of rubbing at different sliding velocity for aluminum-aluminum, aluminum-copper and aluminum- brass pairs respectively at 7.5 N normal load. Curves 1, 2 and 3 of Fig. 6 are drawn for sliding velocity 0.5, 0.75 and 1 m/s respectively. Curve 1 of this figure shows that during the starting, the value of friction coefficient is 0.1 which increases almost linearly up to 0.223 over a duration of 240 seconds of rubbing and after that it remains constant for the rest of the experimental time. The increase of friction may be associated with ploughing effect and because of roughening of the disc surface. After a certain duration of rubbing the increase of roughness and other parameters may reach to a certain steady value hence the values of friction coefficient remain constant for the rest of the time. Curves 2 and 3 show that for the higher sliding speed, the friction coefficient is more and the trend in variation of friction coefficient is almost the same as for curve 1.
From these curves, it is also observed that time to reach steady state values are different for different sliding velocity. From the results it is found that aluminum-aluminum pair at sliding velocity 0.5, 0.75 and 1 m/s takes to reach constant friction 240, 210 and 180 seconds respectively. It indicates that the higher the sliding velocity, the time to reach constant friction is less. This may be due to the higher the sliding speed the surface roughness and other parameters take less time to stabilize. From Figs. 7 and 8, it can be observed that the trends in variation of friction coefficient with the duration of rubbing are very similar to that of figure 6 but the values of friction coefficient are different for different sliding pair.
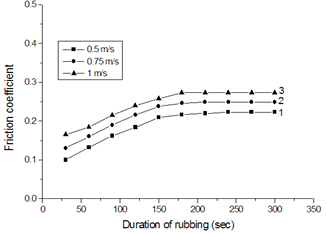
Figure 6. Variation of friction coefficient with the variation of duration of rubbing and sliding velocity (normal load: 7.5 N, relative humidity humidity: 70%, pair: aluminum-aluminum)
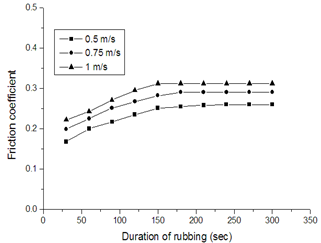
Figure 7. Variation of friction coefficient with the variation of duration of rubbing and sliding velocity (normal load: 7.5 N, relative humidity: 70%, pair: aluminum-copper)
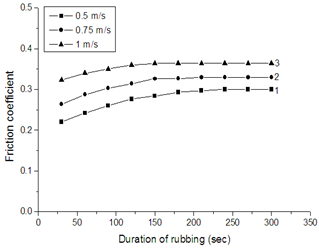
Figure 8. Variation of friction coefficient with the variation of duration of rubbing and sliding velocity (normal load: 7.5 N, relative humidity: 70%, pair: aluminum-brass)
Figure 9 shows the comparison of the variation of friction coefficient with sliding velocity for the above mentioned material pairs. Curves of this figure are drawn for aluminum-aluminum, aluminum-copper and aluminum-brass pairs. It is shown that the friction coefficient varies from 0.223 to 0.273, 0.26 to 0.312 and 0.3 to 0.364 with the variation of sliding velocity from 0.5 to 1 m/s for aluminum-aluminum, aluminum-copper and aluminum-brass pairs respectively. These results indicate that friction coefficient increases with the increase in sliding velocity. Sliding contact of two materials results in heat generation at the asperities and hence increases in temperature at the frictional surfaces of the two materials. An increase in the temperature generally results in metal softening in the case of low melting point metals. An increase in temperature may result in solid-state phase transformation which may either improve or degrade mechanical properties[13]. The most drastic effect occurs if a metal approaches its melting point and its strength drops rapidly, and thermal diffusion and creep phenomena become more important. The resulting increased adhesion at contacts and ductility lead to an increase in friction[13]. The increase in friction coefficient with sliding velocity is due to more adhesion of counterface material (pin) on disc. The variations of steady temperature were observed at different steady level conditions of friction coefficient. Under different operating conditions, the average steady temperature measured during experiment was varied from 65 to 850C.
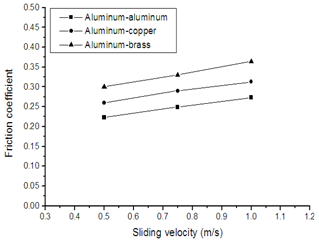
Figure 9. Variation of friction coefficient with the variation of sliding velocity for different material-pair (normal load: 7.5 N, relative humidity: 70%)
From the obtained results, it can also be seen that the highest values of the friction coefficient are obtained for aluminum-brass pair and the lowest values of friction coefficient are obtained for aluminum-aluminum pair. The values of friction coefficient of aluminum-copper pair are found in between the highest and lowest values. It was found that after friction tests, the average roughness of aluminum disc of aluminum-aluminum, aluminum-copper and aluminum-brass pairs varied from 0.7-1.1, 1.1-1.4 and 1.2-1.5 μm respectively.

4. Conclusions

The presence of normal load and sliding velocity indeed affects the friction force considerably. The values of friction coefficient increase with the increase in normal load and sliding velocity for aluminum-aluminum, aluminum-copper and aluminum-brass pairs. Friction coefficient varies with the duration of rubbing and after certain duration of rubbing, friction coefficient becomes steady for the observed range of normal load and sliding velocity. The highest values of the friction coefficient are obtained for aluminum-brass pair and the lowest values of friction coefficient are obtained for aluminum-aluminum pair. The values of friction coefficient of aluminum-copper pair are found in between the highest and lowest values.
As (i) the friction coefficient increases with the increase in normal load and sliding velocity and (ii) magnitudes of friction coefficient are different for different sliding pairs, therefore, maintaining an appropriate level of normal load, sliding velocity as well as appropriate choice of sliding pair, friction may be kept to some lower value to improve mechanical processes.

References

[1]  J. F. Archard, Wear Theory and Mechanisms, Wear Control Handbook, M. B. Peterson and W.O. Winer, eds., ASME, New York, pp. 35-80 (1980).
[2]  D. Tabor, Friction and Wear – Developments Over the Last 50 Years, Keynote Address, Proc. International Conf. Tribology – Friction, Lubrication and Wear, 50 Years on, London, Inst. Mech. Eng., pp. 157-172 (1987).
[3]  S. T. Oktay, N. P. Suh, Wear Debris Formation and Agglomeration, ASME Journal of Tribology, Vol. 114, pp. 379-393 (1992).
[4]  N. Saka, M. J. Liou, N. P. Suh, The role of Tribology in Electrical Contact Phenomena, Wear, Vol. 100, pp. 77-105 (1984).
[5]  N. P. Suh, H. C. Sin, On the Genesis of Friction and Its Effect on Wear, Solid Contact and Lubrication, H. S. Cheng and L. M. Keer, eds., ASME, New York, AMD-Vol. 39 pp. 167-183 (1980).
[6]  V. Aronov, A. F. D'souza, S. Kalpakjian, I. Shareef, Experimental Investigation of the Effect of System Rigidity on Wear and Friction-Induced Vibrations, ASME Journal of Lubrication Technology, Vol. 105, pp. 206-211 (1983).
[7]  V. Aronov, A. F. D'souza, S. Kalpakjian, I. Shareef, Interactions Among Friction, Wear, and System Stiffness-Part 1: Effect of Normal Load and System Stiffness, ASME Journal of Tribology, Vol. 106, pp. 54-58 (1984).
[8]  V. Aronov, A. F. D'souza, S. Kalpakjian, I. Shareef, Interactions among Friction, Wear, and System Stiffness-Part 2: Vibrations Induced by Dry Friction, ASME Journal of Tribology, Vol. 106, pp. 59- 64 (1984).
[9]  V. Aronov, A. F. D'souza, S. Kalpakjian, I. Shareef, Interactions Among Friction, Wear, and System Stiffness-Part 3: Wear Model, ASME Journal of Tribology, Vol. 106, pp. 65-69 (1984).
[10]  J. W. Lin, M. D. Bryant, Reduction in Wear Rate of Carbon Samples Sliding against Wavy Copper Surfaces, ASME Journal of Tribology, Vol. 118, pp. 116-124 (1996).
[11]  K. C. Ludema, Friction, Wear, Lubrication, A Textbook in Tribology, CRC Press, (1996).
[12]  E. J. Berger, C. M. Krousgrill, F. Sadeghi, Stability of Sliding in a System Excited by a Rough Moving Surface, ASME, Vol. 119, pp. 672- 680 (1997).
[13]  B. Bhushan, Principle and Applications of Tribology, John Wiley & Sons, Inc., (1999).
[14]  D. H. Buckley, Surface Effects in Adhesion, Friction, Wear and Lubrication, Elsevier, (1981).
[15]  E. Rabinowicz, Friction and Wear of Materials, 2nd Edition, Wiley, (1995).
[16]  B. Bhushan, Handbook of Micro/Nanotribology, 2nd edition, CRC Press, (1999).
[17]  B. Bhushan, A. V. Kulkarni, Effect of Normal Load on Microscale Friction Measurements, Thin Solid Films, Vol. 278, 49-56, 293, 333 (1996).
[18]  M. A. Chowdhury, M. M. Helali, The Effect of Relative Humidity and Roughness on the Friction Coefficient under Horizontal Vibration, The Open Mechanical Engineering Journal, Vol. 2, pp. 128- 135 (2008).
[19]  M. A. Chowdhury, M. M. Helali, A. B. M. Toufique Hasan, The Frictional Behavior of Mild Steel under Horizontal Vibration, Tribology International, Vol. 42, pp. 946-950 (2009).
[20]  M. A. Chowdhury, S. M. I. Karim, M. L. Ali, The Influence of Natural Frequency of the Experimental Set-up on the Friction Coefficient of Copper, Proc. IMechE, Journal of Engineering Tribology, Vol. 224, pp. 293- 298 (2009).
[21]  M. A. Chowdhury, D. M. Nuruzzaman, M. L. Rahaman, Influence of External Horizontal Vibration on the Coefficient of Friction of Aluminium Sliding against Stainless Steel, Industrial Lubrication and Tribology, Vol. 63, pp. 152-157 (2011).
[22]  M. A. Chowdhury, M. M. Helali, The Effect of Frequency of Vibration and Humidity on the Coefficient of Friction, Tribology International, Vol. 39, pp. 958-962 (2006).
[23]  M. A. Chowdhury, M. M. Helali, The Effect of Amplitude of Vibration on the Coefficient of Friction, Tribology International, Vol. 41 , pp. 307- 314 (2008).