Ajide , Makinde , A. F.
Department of Mechanical Engineering University of Ibadan, Nigeria
Correspondence to: Ajide , Department of Mechanical Engineering University of Ibadan, Nigeria.
| Email: |  |
Copyright © 2012 Scientific & Academic Publishing. All Rights Reserved.
Abstract
The enormous financial loss and the problems of plants shut down, lost production, product loss, product contaminations and loss of customer confidence as a result of corrosion is a serious challenge to the oil and gas industry. The objective of this paper is to investigate the microstructural characteristics of selected corroded materials from Nigeria oil and gas environments. A chemical analysis of the selected corroded materials was carried out with the aid of spectro-metal analyzer. Also, the microstructures of these corroded materials were examined under optical microscope. The results obtained were compared with the chemical compositions and microstructures of the standard alloy of the as received materials .Significant variations were noticed both in the chemical compositions and the ferrite/pearlite ratio within the microstructure. It is concluded that corrosion has added some undesirable features to the material samples and altered the microstructure characteristics which will remarkably alters their mechanical properties.
Keywords:
Corrosion, Microstructure, Ferrite, Pearlite
Cite this paper:
Ajide , Makinde , A. F. , "Microstructural Analysis of Selected Corroded Materials from Nigeria Oil and Gas Industry", American Journal of Materials Science, Vol. 1 No. 2, 2011, pp. 108-112. doi: 10.5923/j.materials.20110102.18.
1. Introduction
Corrosion can simply be described as the degradation in the essential properties of materials as a result of exposure to certain environment. Corrosion is a dynamic process and responsible for problems of equipment malfunction from metal loss and the effects of accumulated chemical product in the process of corrosion. It has been established that Naphthenic corrosion is a major concern for the oil refinery business (Slavcheva et al, 1999). The cost of corrosion in the oil and gas industry is enormous. Corrosion is one of the major occurrences that will affect the safe and efficient running of the plant with the costs for plants shut down, lost production, product loss, environmental contamination and loss of customer confidence running into millions of dollars (OGN, 2009).The microstructure of materials is generally known to change subsequently after the production as a result of different reasons ranging from fatigue, failure and corrosion. Presently, Corrosion engineers have developed a strong zeal to study the concept fundamentally in order to eliminate corrosion by design hence the relevance of microstructural analysis of corroded samples. Most recent literature attests to the fact that there is a strong relationship between corrosion behaviour and microstructure characteristics. Quite a number of interesting research efforts have beenmade on how corrosion influences the microstructure of materials (and also how material microstructures affects corrosion characteristics). David asserted in his 2007 issue that TEM or EBSD provides probably the best complex microstructure characterization. Perry et al (1998) investigated the effect of microstructure and Chromium alloying content to the corrosion resistance of low-alloy steel well tubing in seawater injection service. The failure analysis of corroded well tubing steel grade L-80, removed from three separate seawater injection wells on two operated fields significantly revealed the importance of steel microstructure and alloying chemistry. The effect of temperature on the corrosion behavioiur of 13Cr martensitic steel during exposure to CO2 and Cl- environment was carried out by Zhang et al (2005). The authors employed potentiodynamic polarization and impedance measurement to examine the effects of temperature on the passivation behaviour of 13Cr martensitic stainless steel in CO2 and Cl- environment. Different specimens were tested during exposure to 90℃, 120℃and 150℃. Reaction mechanicisms are decided from the polarization curves. The characteristics of the surface film are determined from impedance transfer function model, which involve the reactions occurring at the metal and passive film as well as the diffusion processes. Information concerning the system electrochemical parameters is used to interpret the effects of temperature on the passive film and corrosion resistance. The results obtained from this study are consistent with SEM and XPS analysis. Marcelo and Luiz (2008) examined the microstructural characteristics and corrosion behaviour of super duplex stainless steel casting. The main objective of the work was to demonstrate that, after solution annealing at 1130℃ and water quenching, stress relief at 520℃ for 2hours did not alter the duplex microstructure or impair the pitting corrosion resistance of ASTM A890/A890M Grade 6A steel. The findings of the authors were confirmed by microstructural characterization techniques, including light optical and scanning electron microscopy and X-ray diffraction. Imran et al in 2009 carried a microstructural investigation of direct metal deposition of H13 steel on high strength copper substrate. The paper presents an investigation on the microstructure analysis of a bimetallic component consisting of the steel powder deposited on the solid copper substrate using laser cladding technology, direct metal deposition (DMD).The results obtained from the scanning electron microscope (SEM) and energy dispersive spectroscopy (EDS) display a metallurgically sound and fully dense steel layer, where copper in rounded form was seen in the layer, which decreased with increase of layer thickness. The findings of this research showed that porous holes also reduce with the increase of the thickness. Elhoud et al (2010) investigated the influence of microstructure changes on corrosion resistance of super duplex stainless steel. The effect of microstructure on pitting corrosion of super duplex stainless steel was investigated in 3.5% Nacl solution at 90oC. The microstructures were controlled by applying two different cooling rates of water quench and air from the heat treatment temperatures at 1000℃and 1300℃.The amount of ferrite and austenite and other precipitates were measured using optical and image analyzer. The results revealed that the ferrite percentage increased as the heating temperature increased to 1300℃. The metallographic results showed the presence of intermetallic phase. Vargas-Arista et al (2011) investigated the deterioration of the corrosion resistance of welded joints in API5L-X52 steel isothermally aged. The corrosion behaviour of welded joints in API5L-X52 pipe steel aged at 250℃ at different times was investigated under electrochemical technique like tafel polarization, scanning electron microscopy (SEM) and transmission electron microscopy (TEM) studies. The SEM study of the corrosion products at the three different zones showed the presence of oxide and sulphur of iron very brittle and porous on metallic surface. The highest corrosion rate was reached by the weld bead owing to the largest increase in the amount of nanocarbides lesser coarsening and the presence of corroding products with larger brittleness and porosity. Morris et al (2011) study is concerned with the effect of laser beam welding parameters on microstructure and properties of Duplex stainless steel. This work is concerned with laser beam welding and its effect and microstructure of fusion zone, then on mechanical and corrosion properties of duplex stainless steel welded joints. The findings of this research showed that laser power, welding speed, defocusing distance and type of shielding gas combination have to be optimized for obtaining welded joints with acceptable profiles as well as mechanical and corrosion characteristics.Available literature showed that extensive work has not been done in the study of microstructures of corroded materials from oil and gas environments. Particularly in Nigeria petroleum industry with unique environments, there is no iota of doubt that the corroded products formed will be somehow different for the same material in oil companies in other parts of the globe. The difference in climate, air conditions, seas and soil characteristics will surely results in formation of different microstructures of corroded products. The objective of this paper is to study the microstructural characteristics of selected corroded alloy materials from Nigeria’s oil and gas environments.
2. Experimental Procedure
2.1. Material Specification
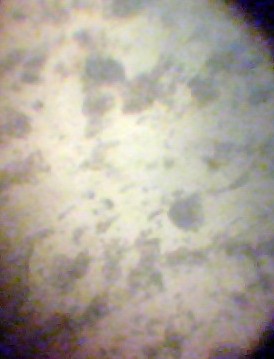
Four selected corroded alloy grades were used in this study. Samples A, B, C and D (as shown in figures 1-4) were originally of alloy grades AISI 1018, AISI 1017, AISI 1015, and AISI 1020 respectively. These were selected from two different oil and gas companies; Nigerian National Petroleum Corporation (NNPC) and, Pipeline and Product Management Company (PPMC) both in Warri, Delta State, Nigeria. The samples are extracted from pipes that have been subjected to crude oil; different crude oil products and processes.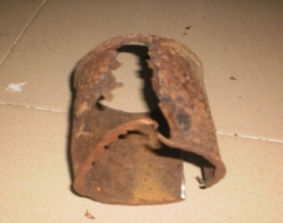 | Figure 1. SAMPLE A |
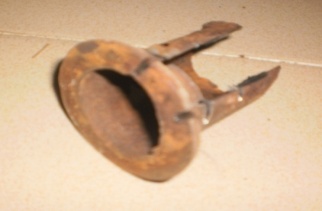 | Figure 2. SAMPLE B |
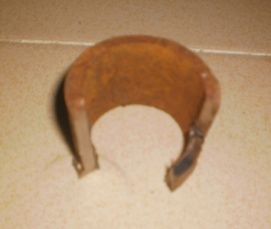 | Figure 3. SAMPLE C |
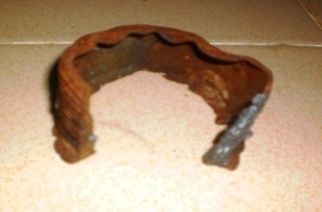 | Figure 4. SAMPLE D |
2.2. Materials Chemical Analysis
The chemical analysis of all the four selected corroded materials was carried out with the aid of spectro-metal analyzer at the Universal Steel Limited, Lagos, Nigeria.
2.3. Microstructural Evaluation
For microstructural evaluation, each of the four samples were sectioned, grinded with Emery paper (240, 320, 400, 600 grit paper), polished with SiC solution with 1µm Emery paper and SiC solution with 0.5µm Emery paper. It was finally etched with 2% Nitric acid and 98% Ethyl alcohol. The solution was left to dry-up before viewing under the microscope. The samples were later viewed under the metallurgical microscope for microstructural details.
3. Results
3.1. Chemical Analyses
The results of chemical analysis of the corroded samples are shown in tables 1 to 4. These results are then compared with the standard chemical compositions of the as received alloy material as shown in tables 5 to 8. | Table 1. Chemical composition of Sample A |
| | Run | C | Si | S | P | Mn | Ni | Cr | Mo | V | Cu | W | As | Sn | Co | Al | Pb | Zn | Fe | | 1> | 0.1690 | 0.2097 | 0.0140 | 0.0028 | 0.8750 | 0.0356 | 0.0279 | 0.0072 | 0.0017 | 0.0934 | 0.0024 | 0.0037 | 0.0056 | 0.0053 | 0.0794 | 0.0034 | 0.0060 | 98.4580 | | 2> | 0.1661 | 0.1960 | 0.0210 | 0.0082 | 0.8498 | 0.0366 | 0.0267 | 0.0068 | 0.0007 | 0.0829 | 0.0024 | 0.0031 | 0.0056 | 0.0051 | 0.0694 | 0.0003 | 0..0034 | 98.5162 | | Avg | 0.1675 | 0.2028 | 0.0175 | 0.0055 | 0.8624 | 0.0361 | 0.0273 | 0.0070 | 0.0012 | 0.0882 | 0.0024 | 0.0034 | 0.0056 | 0.0052 | 0.0744 | 0.0019 | 0.0047 | 98.4871 | | Sd | 0.0021 | 0.0097 | 0.0050 | 0.0038 | 0.0178 | 0.0007 | 0.0009 | 0.0003 | 0.0007 | 0.0074 | 0.0000 | 0.0004 | 0.0000 | 0.0002 | 0.0071 | 0.0022 | 0.0019 | 0.0411 | | Sd% | 1.2302 | 4.7693 | 28.269 | 69.6196 | 2.0656 | 1.8607 | 3.2167 | 4.4598 | 55.014 | 8.4293 | 1.8057 | 12.560 | 0.5893 | 2.991 | 9.460 | 121.1584 | 39.6018 | 0.0418 |
|
|
| Table 2. Chemical composition of Sample B |
| | Run | C | Si | S | P | Mn | Ni | Cr | Mo | V | Cu | W | As | Sn | Co | Al | Ca | Zn | Fe | | 1> | 0.1619 | 0.2363 | 0.0150 | 0.0093 | 0.6249 | 0.0665 | 0.0405 | 0.0111 | 0.0033 | 0.2138 | 0.0028 | 0.0044 | 0.0126 | 0.0066 | 0.0254 | 0.0007 | 0.0038 | 98.5607 | | 2> | 0.1540 | 0.2310 | 0.0128 | 0.0087 | 0.6091 | 0.0652 | 0.0394 | 0.0108 | 0.0030 | 0.2082 | 0.0006 | 0.0041 | 0.0121 | 0.0062 | 0.0249 | 0.0008 | 0.0031 | 98.6064 | | Avg | 0.1579 | 0.2336 | 0.0139 | 0.0090 | 0.6170 | 0.0658 | 0.0400 | 0.0109 | 0.0031 | 0.2110 | 0.0017 | 0.0043 | 0.0124 | 0.0064 | 0.0251 | 0.0007 | 0.0035 | 98.5835 | | Sd | 0.0056 | 0.0038 | 0.0016 | 0.0004 | 0.0112 | 0.009 | 0.0008 | 0.0003 | 0.0003 | 0.0040 | 0.0016 | 0.002 | 0.0003 | 0.0003 | 0.0004 | 0.0001 | 0.0005 | 0.0324 | | Sd% | 3.5424 | 1.6138 | 11.2411 | 4.3416 | 1.8105 | 1.4268 | 1.9981 | 2.3977 | 8.7532 | 1.8832 | 92.9363 | 5.2054 | 2.7277 | 3.9702 | 1.4002 | 11.8237 | 15.3328 | 0.0328 |
|
|
| Table 3. Chemical composition of Sample C |
| | Run | C | Si | S | P | Mn | Ni | Cr | Mo | V | Cu | W | As | Sn | Co | Al | Pb | Zn | Fe | | 1> | 0.1399 | 0.2504 | 0.0385 | 0.0144 | 0.4742 | 0.2021 | 0.8968 | 0.4754 | 0.0035 | 0.1916 | 0.0080 | 0.0158 | 0.0179 | 0.0196 | 0.0037 | 0.0014 | 0.0048 | 97.2421 | | 2> | 0.1366 | 0.2475 | 0.0339 | 0.0131 | 0.4740 | 0.1988 | 0.8865 | 0.4624 | 0.0036 | 0.1948 | 0.0071 | 0.0155 | 0.0183 | 0.0193 | 0.0030 | 0.0017 | 0.0050 | 97.2791 | | Avg | 0.1382 | 0.2490 | 0.0362 | 0.0137 | 0.4741 | 0.2004 | 0.8917 | 0.4689 | 0.0035 | 0.1932 | 0.0075 | 0.0156 | 0.0181 | 0.0194 | 0.0034 | 0.0015 | 0.0049 | 97.2606 | | Sd | 0.0023 | 0.0021 | 0.0032 | 0.0010 | 0.0001 | 0.0024 | 0.0073 | 0.0092 | 0.0001 | 0.0023 | 0.0007 | 0.0002 | 0.0003 | 0.0002 | 0.0005 | 0.0002 | 0.0001 | 0.0261 | | Sd% | 1.6590 | 0.8269 | 8.8473 | 7.0483 | 0.0274 | 1.1911 | 0.8178 | 1.9646 | 1.9101 | 1.1657 | 8.7003 | 1.4261 | 1.5588 | 1.0894 | 13.7617 | 13.6285 | 3.0809 | 0.0269 |
|
|
| Table 4. Chemical Composition of Sample D |
| | Run | C | Si | S | P | Mn | Ni | Cr | Mo | Cu | As | Sn | Co | Al | Zn | Fe | | 1> | 0.1982 | 0.0072 | 0.0254 | 0.0208 | 0.3826 | 0.0123 | 0.0041 | 0.0020 | 0.0258 | 0.0009 | 0.0021 | 0.0080 | 0.0027 | 0.0015 | 99.3103 | | 2> | 0.1915 | 0.0075 | 0.0197 | 0.0190 | 0.3812 | 0.0120 | 0.0041 | 0.0022 | 0.0264 | 0.0008 | 0.0021 | 0.0081 | 0.0021 | 0.0015 | 99.3263 | | Avg | 0.1948 | 0.0074 | 0.0225 | 0.0199 | 0.3819 | 0.0121 | 0.0041 | 0.0021 | 0.0261 | 0.0009 | 0.0021 | 0.0080 | 0.0024 | 0.0015 | 99.3183 | | Sd | 0.0047 | 0.0002 | 0.0040 | 0.0013 | 0.0010 | 0.0002 | 0.0001 | 0.0001 | 0.0004 | 0.0001 | 0.0000 | 0.0000 | 0.0004 | 0.0001 | 0.0113 | | Sd% | 2.4066 | 3.0985 | 17.7104 | 6.4177 | 0.2587 | 1.5975 | 1.2673 | 7.0465 | 1.5160 | 9,1088 | 0.5968 | 0.5344 | 17.6307 | 3.6520 | 0.0113 |
|
|
| Table 5. Standard Chemical composition of AISI 1018 (Source: AISI-SAE Classifications of Steels) |
| | Elements | C | Mn | P | S | Si | Fe | | Avg. comp. | 0.15-0.18 | 0.60-0.90 | 0.04max | 0.05max | 0.15-0.30 | Balance |
|
|
| Table 6. Standard Chemical composition of AISI 1017 (Source: AISI-SAE Classifications of Steels) |
| | Elements | C | Mn | S | P | Fe | | Avg. comp. | 0.15-0.20 | 0.30-0.60 | 0.05max | 0.04max | Balance |
|
|
| Table 7. Standard Chemical Composition of AISI 1015 (Source: AISI-SAE Classifications of Steels) |
| | Element | C | Mn | S | P | Fe | | Avg. comp. | 0.13-0.18 | 0.30-0.80 | 0.05max | 0.04max | Balance |
|
|
| Table 8. Standard Chemical composition of AISI 1020 (Source: AISI-SAE Classifications of Steels) |
| | Element | C | Mn | S | P | Fe | | Avg. comp. | 0.18-0.23 | 0.30-0.60 | 0.05max | 0.04max | Balance |
|
|
From the compositions in tables 1-4 above and reliable information gathered from NNPC and PPMC companies engineers while collecting the corroded materials samples, the type of steel grades that the corroded materials are made from can be deduced as follows:SAMPLE A – AISI 1018 Grade steelSAMPLE B – AISI 1017 Grade steelSAMPLE C – AISI 1015 Grade steelSAMPLE D – AISI 1020 Grade steelIt can be inferred that sample C is a low carbon steel as it contains 0.15% weight of carbon. Samples A, B and D are mild steels (as it contains between 0.16% to 0.20% carbon content).According to standards, the main elements contained in these types of steel are; Carbon, Manganese, Silicon, Phosphorus and Sulphur apart from the basic metal Iron. The other elements present above are either added to give some specific ability or impurities from production or contamination from corrosion.
3.2. Microstructural Evaluation
The micrographs of each samples appears below at a magnification of ×400. | Figure 5. Micrograph of AISI 1018 |
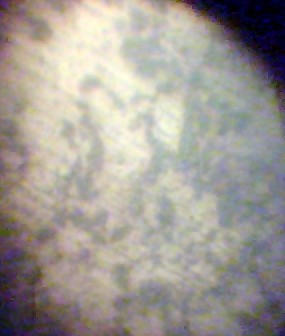
 | Figure 6. Micrograph of AISI 1017 |
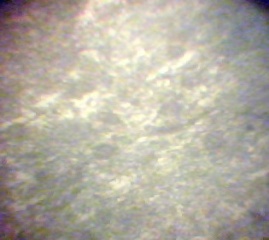
 | Figure 7. Micrograph of AISI 1015 |
 | Figure 8. Micrograph of AISI 1020 |
In the figures 5-8, the black patches represent the pearlite structures while the seemingly white patches represent the ferrite structures.
4. Discussions
The micrograph of AISI 1018 shows a ferrite-pearlite microstructure. It will be noticed that the pearlite seems cover much more area than the ferrite. Ferrite is known to contain pure iron as it does not dissolve any carbon. However, pearlite contains about 88% ferrite and 12% cementite which forms a two-phased structure called lamellar. With much pearlite, the metal is hard and strong but not particularly tough. A cursory view of the micrograph of AISI 1017 shows a lot less pearlite than the ferrite. The percent volume of pearlite is directly proportional to the carbon content. From the chemical composition, it can be seen that its average composition of carbon 0.1579% barely making the standard. The difference in the microstructure is as a result of corrosion. Also given the standard composition of AISI 1017 steel, it will be noticed that there are other constituents which may have been added due to corrosion. From the chemical composition of AISI 1015, it can be seen that the carbon content is less than 0.15% as a result; it is a low carbon steel. If the chemical analysis can be related to the micrograph as shown above, it is no surprise that the volume of pearlite is much less than the ferrite. This has greatly reduced the strength of the metal causing its strength against corrosion to be low. The micrograph of AISI 1020 shows high concentration of pearlite. However, the chemical composition shows low concentration of austenite forming element like chromium, nickel which may be attributed to its corrosion.
5. Conclusions
This research work reveals that carbon steel is the major alloy used for pipelines in oil and gas industries. From the results of the microstructure analyses carried out in this study, the following conclusions can be made:Changes in chemical composition: The standard chemical compositions of the samples have been altered, new elements have been added, apart from the presence of impurities, this can be attributed to corrosion. With this, there is a possibility of contamination of original products passing through the pipes due to unfavourable reactions.Changes in microstructure: Observation shows that the basic microstructures of most of the samples have changed. With earlier explanation, it can be deduced that there has been pearlite depletion as a result of corrosion effects. Change in microstructure will result in changes in the mechanical properties of the metals (e.g. strength, hardness). It is therefore evident that corrosion causes microstructure changes of carbon steels in oil and gas environments.The effects of these changes in chemical compositions and microstructures if not properly checked will in no doubt lead to pipeline breakdown and structural degradation. This will eventually lead to plant shutdown, product loss, product contamination and huge financial loss.
References
| [1] | David R. (2007), Powder diffraction microstructure analysis on nanocrystalline materials, International union of crystallography newsletter, No.34,ISSN 1591-9552. Commission on powder diffraction |
| [2] | Elhoud A.M., Renton N.C., Lasebikan D.A. and Deans W.F. (2010), Influence of microstructure changes on corrosion resistance of super duplex stainless steel. International Journal of microstructure and materials properties, Vol.5, No.1, Pg. 39-51 |
| [3] | Imran M.K., Masood S.H. and Brandt M. (2009), Microstructural investigation of direct metal deposition of H13 steel on high strength copper substrate. Proceedings of the world congress on engineering. Vol.I, July 1-3,London,U.K |
| [4] | Marcelo M. and Luiz C. (2009), Microstructural characteristics and corrosion behaviour of a super duplex stainless steel casting. Material characterization,Elsevier journal, Vol.60, Pg. 150-153 |
| [5] | Morris A.E., Abdel-Fattah K. and Thoria S.(2011),Effect of laser beam parameters on microstructure and properties of duplex stainless. Journal of materials sciences and applications. Vol.2, No.10, Pg. 2153-1188 |
| [6] | OGNonline.com (2009), OGN is an online oil and Gas News Magazine |
| [7] | Perry I.N. and Masakatsu U. (1998), The effect of microstructure and chromium alloying content to the corrosion resistance of low-alloy steel well tubing in sea water injection service. NACE International Corrosion conference. Document ID-98003 |
| [8] | Slavcheva E. and Shone B. (1999), Naphthenic Acid Corrosion. British Corrosion Journal, Vol. 34, No. 2, Pg. 13-125. Maney Publishing |
| [9] | Varga-Arista B.,Romero J.S.,Angeles-Chavez C.,Albiter A. and Hallen J.M.(2011), Determination of the corrosion resistance of welded joints in API5L-X52 steel isothermally aged. International journal of electrochemical science, Vol.6, Pg. 367-378 |
| [10] | Zhang H.,Zhao Y.L. and Jiang Z.D.(2005), Effect of temperature on the corrosion behaviour of 13Cr martensitic stainless steel during exposure to CO2 and Cl- environment. Elsevier Material letters, Vol. 59, Issue 27, and Pg. 3370-3374 |
 Abstract
 Reference
 Full-Text PDF
 Full-Text HTML