-
Paper Information
- Next Paper
- Previous Paper
- Paper Submission
-
Journal Information
- About This Journal
- Editorial Board
- Current Issue
- Archive
- Author Guidelines
- Contact Us
American Journal of Materials Science
p-ISSN: 2162-9382 e-ISSN: 2162-8424
2011; 1(1): 18-25
doi: 10.5923/j.materials.20110101.04
Optimization, Structural, Spectroscopic and Magnetic Studies on Stable Akaganeite Nanoparticles via Co-Precipitation Method
 Abstract
 Reference
 Full-Text PDF
 Full-Text HTML
R. Parameshwari , P. Priyadarshini , G. Chandrasekaran
Magnetism and Magnetic Materials Laboratory, Department of Physics, School of Physical, Chemical and Applied Sciences, Pondicherry University, Puducherry, 605 014, India
Correspondence to: G. Chandrasekaran , Magnetism and Magnetic Materials Laboratory, Department of Physics, School of Physical, Chemical and Applied Sciences, Pondicherry University, Puducherry, 605 014, India.
| Email: |  |
Copyright © 2012 Scientific & Academic Publishing. All Rights Reserved.
With a view to achieve stable the ultrafine akaganeite (β-FeO(OH)) particles, they are synthesized by varying the molar concentration of dextrose, x = 0.2, 0.4, 0.6, 0.8, 1.0M, as chelating agent in co–precipitation method. The structural properties studied using the powder X–ray diffraction patterns show that an optimum concentration of dextrose for the formation of akaganeite is 0.6M. The particles possess tetragonal crystal structures and the size of grains is in the order of nanometer (~18 to 29nm). DSC curves explain the chemical reactions and phase transitions undergone by the sample. FT-IR spectra of the nanoparticles of akaganeite show the absorption bands at 491 and 445cm-1 in all the samples corresponding to the symmetric stretching vibrations of Fe-O bond and its ligands respectively in the octahedral co-ordinations. UV–Visible spectra of the present set of samples clearly exhibit a change in the optical bandgap from 1.97 to 2.14eV. The magnetic studies could bring out a weak ferrimagnetic behaviour accompanied by superparamagnetism in the akaganeite nanoparticles.
Keywords: X-Ray diffraction, FTIR, Co-precipitation, Akaganeite Nanoparticles, Magnetic study, EPR
Cite this paper: R. Parameshwari , P. Priyadarshini , G. Chandrasekaran , "Optimization, Structural, Spectroscopic and Magnetic Studies on Stable Akaganeite Nanoparticles via Co-Precipitation Method", American Journal of Materials Science, Vol. 1 No. 1, 2011, pp. 18-25. doi: 10.5923/j.materials.20110101.04.
Article Outline
1. Introduction
- The nanoparticles of oxides/oxyhydroxides of iron continue to attract the attention of the Scientists as they possess a wide range of applications[1-3] such as catalytic materials, sorbents, pigments, flocculants, coatings, gas sensors and ion exchangers. They serve as precursors to phases for information storage media. They are used as model systems for the study of fundamental colloid and surface properties of metal oxides. As on date there are 16 iron oxides/oxyhydroxides[3] found in nature and they are famous magnetic materials. The material under interest, akaganeite, is one of the polymorphs of iron oxyhydroxides[4,5]. The mineral akaganeite occurring naturally acquires a form β-FeOOH. It was collected from Akagane mine, Iwate Prefecture, by Dr. M. Nambu[6] of Sendai University, Japan, who named it first as “Akaganeite”. Akaganeite has a tetragonal structure consisting of double chains of edge-shared octahedra that share corners with adjacent chains to form channels running parallel to the c-axis, which can be occupied by chloride ions and water molecules (refer Figure.1)[7]. Thus formed tunnel structure makes β-FeOOH an especially interesting material in the areas of catalysis, electrode materials, ion exchange and so on[8-10]. Therefore the synthesis of akaganeite has been extensively investigated owing to its wide application. Earlier Schwetmann and Cornell[11] have prepared akaganeite using the hydrolysis of FeCl3 aqueous solutions at moderate temperature with a preferred acidic pH (pH < 5) which avoided the formation of more stable neighborly phases such as hematite and goethite. Later Xiao-Min Lin et.al,[12] used lithographic techniques and obtained particles of size smaller than top-down approach. Meng Meng Lin et.al,[13] have successfully used the co-precipitation of inorganic salts with a basic pH (pH = 9) to synthesize some magnetic nanoparticles. Sophie Laurent et.al,[14] have studied the co-precipitation method for the synthesis of nanoparticles of some iron oxides and listed out many advantages of using that method. They claimed that it is one of the simplest and most efficient chemical pathways to prepare the iron oxide nanoparticles due to its versatility, relatively low budget, feasibility to scale up, and the hydrophilic surface character of the intermediary products. Despite a broad distribution of particle sizes, this method supports atomic level mixing of individual components thereby reducing the diffusion distances, which results in the nanocrystalline materials at lower temperatures compared to other methods. The broad size distribution has been overcome by the use of the different organic additives as stabilization and / or reducing agents such as Poly Vinyl Alcohol[15,16], dextran[17,18], oleic acid[19-21], Ethylene Diamine Tetra Acetic acid[22] and so on. These organic compounds play a key role in inducing the crystallization processes in the solution; firstly in the form of high-molecular-weight compounds (aggregates) and subsequently their associates of the amphiphilic organic molecules of low molecular weight [23]. The role of the organic ions on the metal oxides / oxyhydroxides to form their ultrafine particles can be rationalized by two competing mechanisms[24] namely, (i) chelation of the metal ions prevents monotonic nucleation and hence limits the size of nuclei which thereby supports the faster formation of particles and (ii) the absorption of additives by the nuclei and growing crystals may inhibit the growth of the particles, which favours the formation of small units. Recently Mallikarjuna et.al,[25] have done a pilot study of the synthesis of nanoparticles of akaganeite using dextrose in co-precipitation. We have undertaken a systematic investigation to prepare highly stable akaganeite nanoparticles by optimizing the quantity of dextrose during co-precipitation, avoid the formation of other coexisting compounds and characterize it for the structural, spectroscopic and magnetic properties.
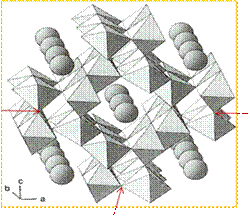 | Figure 1. Structure of Akaganeite - Arrangement of octahedral double chains in tunnels with chloride ions in the centre of the tunnels. [Courtesy Ref.7.] |
2. Experimental Details
2.1. Starting Materials
- In this work, the analytical chemical reagents used are ferric chloride hexahydrate (FeCl3. 6H2O) (HIMEDIA RM6353, 99% purity), anhydrous dextrose (C6H12O6) (HIMEDIA RM077, 99.5% purity) and ammonia solution (NH3) (sd fine-CHEM Ltd 37140, 25% extra pure). Their respective aqueous solutions are prepared with doubly deionized water.
2.2. Synthesis
- Nanoparticles of akaganeite are prepared using the co-precipitation method by mixing the aqueous solutions of iron (III) chloride and dextrose in different molar ratios of 1:x (where, x = 0.2, 0.4, 0.6, 0.8, 1.0 ). The 10M ammonia solution is used as precipitating agent. 1M of ferric chloride hexahydrate and xM of dextrose solutions are mixed in glass beaker and stirred in a magnetic stirrer for 30 minutes to achieve good mixing of the reactants. The solution becomes brownish green in colour with a pH value of 2. The resultant solution in the beaker is then heated to 90oC on a ceramic hot plate, followed by drop wise addition of 10M ammonia by means of a 50mL burette until a pH of 9 was obtained. The addition of ammonia solution and the heating encourage the condensation reaction between adjacent molecules along with the elimination of H2O and ammonium chloride, organic compounds so as to yield akaganeite. To begin with we observe brownish-yellow colour precipitate in the solution and at the end of the reaction the whole solution becomes orange in colour. The pH value of the solution is found to be = 4 at this stage. When ammonia solution is poured further, a shiny paste is formed and later it settles at the bottom of the beaker as brownish green colour paste. Then the continuation of ammonia addition at pH = 9 and stirring the precipitate for half an hour to prevent agglomeration, the reaction attains a conducive completion. Thus obtained final solution is air cooled to room temperature. The resulting precipitate is filtered and washed with distilled water several times to remove chloride ions. The final colloid or paste like product is poured in a clean silica crucible and heated at 90oC for two hours inside a furnace in order to remove the residual inorganic and organic compounds present in the water soluble colloid. The material taken from the furnace appears like dried clay. It is ground using the agate mortar and pestle to form yellowish-brown colour powder of particles of akaganeite.
2.3. Characterization
- The structure, phase and size of particles of the samples are determined using powder X-Ray Diffractometer, (XRD), PANalytical (Model: X’Pert PRO) equipped with Cu- Kα radiation of wavelength 1.5406 Å, energy 1000W and Graphite monochromator. Differential Scanning Calorimetric (DSC) study on akaganeite samples is done using TA INSTRUMENTS Q20 SERIES. The Fourier Transform InfraRed (FTIR) spectra are taken using Schimadzu (Model: 8700) spectrometer. The sample is studied in KBr matrix in the range from 400 to 4000cm-1. The UV-Visible spectra of the samples are obtained from Ocean optics (Model: DH-2000) instrument. The samples are dissolved in methanol and taken in a quartz cuvette for the UV-Vis study. The magnetization as a function of external magnetic field is studied using Vibrating Sample Magnetometer (VSM) (EG & G Model: 155). Electron Paramagnetic Resonance (EPR) of the powder samples is performed using (Model: JEOL JES-TE 100) at X-band frequency 9.38653GHz with microwave power of 1.00mW in the field range 0–500mT and 100kHz field modulation to obtain the first derivative EPR spectrum.
2.4. The Proposed Reaction Mechanism of the Formation of Akaganeite
- The hydrolysis of Fe3+ from ferric chloride solution proceeds as follows:
 | (1) |
 | (2) |
 | (3) |
3. Results and Discussions
3.1. Structural Analysis (Powder-XRD)
- The XRD patterns of samples synthesized with different molar ratios of dextrose in the ferric chloride solution are shown in Figure. 2. The XRD patterns show broadened peaks which are typical of nanoparticles as they have a high degree of internal stress and strain[28]. It is noted that for lower quantity of dextrose viz., x = 0.2 and 0.4M a secondary phase fitting to Maghemite (γ-Fe2O3) for a 2θ = 30o (JCPDS file No: 89-3850) appears in their respective XRD patterns[29]. The rest of the samples viz., x = 0.6, 0.8 and 1M possess well resolved diffraction peaks that match well with the standard akaganeite pattern (JCPDS file No: 34-1266) for tetragonal body-centered crystal structure with the space group I4/m[22]. It is interesting to note that the concentration of dextrose has played an important role in acquiring the single phase nanoparticles of akaganeite.
 | Figure 2. XRD patterns of akaganeite synthesized with different molar ratios of dextrose. |
3.2. Thermal Analysis (DSC)
- The DSC plots of akaganeite particles prepared using different concentrations of dextrose are shown in Figure. 3. There are three major thermal events which can be observed in the DSC plots of akaganeite particles. A broad endothermic peak in the temperature range from 80 to 120oC is attributed to the evaporation of water molecules present near the surface of the precipitate[31].
 | Figure 3. DSC curves of akaganeite samples |
3.3. FT-IR Study
- The FT-IR spectra of akaganeite nanoparticles taken in the frequency range of 400- 4000cm-1 are shown in Figure. 4. The IR spectra of the samples show a prominent absorption in the range from 3430 to 3458cm-1 characterizing the O-H stretching vibrational band of water molecule present in akaganeite nanoparticles[35]. This region is very broad and obscured by a large amount of adsorbed water that remains in its structure[36]. Another band located between 1630 and 1648cm-1 is assigned to solitary O-H bending vibration[37]. All the spectra show two very weak absorption peaks near 2925 and 2850cm-1 corresponding to the stretching vibrations of CH2 and CH3 respectively. The absorption bands observed at 1350 and 1160cm-1 are due to the vibrations of C=O and C-C bonds respectively. Deliyani et.al[38], have reported that the bands present between 820 and 630 cm-1 are due to the liberation modes of O-H….Cl hydrogen bonds present, which are characteristic of chloride containing akaganeite.
 | Figure 4. FT-IR spectra of akaganeite samples |
|
 | Figure 5. UV- Visible spectra of akaganeite samples |
 | Figure 6. Estimation of optical band gap of akaganeite nanoaprticles |
 | Figure 7. Variation of band gap energy versus concentration of dextrose |
3.4. VSM Study
- The hysteresis curves of akaganeite nanoparticles prepared with different molar ratios of dextrose are shown in Figure.8. It is seen from Figure.8 that the loops obtained for 0.2 and 0.4M, show saturation after remanence magnetization at a maximum applied field of 2T.
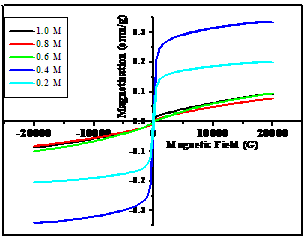 | Figure 8. Hysteresis loops of akaganeite nanoparticles |
|
3.5. EPR Study
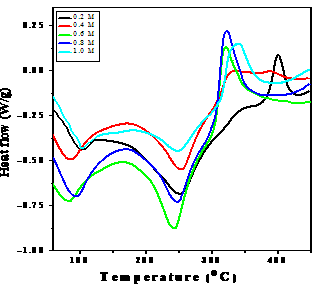
- EPR spectra of akaganeite nanoparticles are shown in Figure 9. It is seen from Figure.9 that the spectra of 0.2 and 0.4M show single and symmetric signal whereas those of 0.6, 0.8 and 1.0M are found to possess two resonance bands. A band with higher intensity appears at higher field and other one of lower intensity is found at lower fields. The g values estimated from the resonance bands and given in Table 4 show two distinctly different sets. The g-values of high field bands are observed to be more than 2 whereas the low field bands have g values close to 2. The origin of the peaks observed at lower field for the 0.6, 0.8 and 1.0M samples is clearly due to spins of Fe3+ ions in akaganeite[52]. Another EPR signal at higher field is explained to possess distortions caused by the environment on Fe3+ ions since no other EPR ion is present in akaganeite structure. It is observed that the peak to peak line width (∆Hpp) increases with the increase in dextrose concentration. It may be recalled that the increase in dextrose concentration decreases the particle size. Therefore the coupling force inside particles is expected to play major role in affecting the line width of the samples. It is also observed that the resonance bands are shifted to lower fields with decrease in particle size. In the case of nanoparticles, the peak to peak line width and the resonance field are often correlated. With the decrease in particle size the time of spin fluctuations increases which results in a continuous and simultaneous line broadening and resonance shift towards lower resonance fields.
 | Figure 9. EPR spectra of akaganeite nanoparticles |
| |||||||||||||||||||||||||||||||||||||||||||||||||||
4. Conclusions
- The synthesis of akaganeite (β-FeOOH) nanoparticles using dextrose as chelating agent has been successfully investigated with a focus on optimization of a lone phase, free from secondary phases, and stabilize it. The XRD patterns confirm the setting in of single phase akaganeite for the concentration of dextrose above X = 0.6M although secondary phase co-existed in the low concentrations for X = 0.2 and 0.4M. It helps to conclude that the sufficient amount of dextrose during the precipitation process has ensured the formation of pure akaganeite nanoparticles. DSC study reports that more quantity of dextrose in the solution resolves the akaganeite phase from other immediate phases. FTIR spectra of akaganeite nanoparticles bring out a decrease in bond length with increase in the concentration of dextrose during the preparation which enlightens the role of dextrose in speeding up the growth mechanism of nanoparticles. UV-Visible spectroscopic study reports that the bandgap energy of akaganeite lies between 1.97 and 2.14eV and hence adds a new member in the list of wide bandgap semiconductors. The superparamagnetic domains present in the akaganeite nanoparticles would have a real value for pharmaceutical and biomedical applications like targeted drug delivery. The large values of relaxation time and peak to peak line width observed in EPR study assure a future scope for these akaganeite nanoparticles – a wide band gap semiconductor- in microwave region.
ACKNOWLEDGEMENTS
- The authors thank DST-FIST, Government of India for funding the facilities available in the Central Instrumentation Facility, Pondicherry University which is utilized in the present work and also for funding XRD in the Department of Physics, Pondicherry University, India. The authors are thankful to Prof. P. Sambasiva Rao, Head, Department of Chemistry, Pondicherry University for granting permission to use EPR facility. Also, Dr. R. Venkatesan, Reader, Department of Chemistry, Pondicherry University for granting permission to take UV-Visible spectroscopic measurements. The authors also thank the Sophisticated Analytical Instrumental Facility, Indian Institute of Technology, Chennai, permitting to use the VSM facility.
References
| [1] | H. Gleiter, Progr. Mater. Sci., 33 (1989) 223 |
| [2] | Dong-Hweng Chen, Xin-Rong He, Mater. Res. Bull., 36, (2001)1369 |
| [3] | E. A. Deliyanni, D. N. Bakoyannakis, A. I. Zouboulis, K. A. Matis, L. Nalbandian, Micropor. Mesopor. Mater., 42 (2001) 49 |
| [4] | R. M. Cornell, U. Schwertmann, The Iron Oxides - Structure, Properties, Reactions, Occurences and Uses, Second Completely Revised and Extended Edition, Wiley-VCH GmbH & Co. KGaA, 2003 |
| [5] | T. Misawa, K. Hashimoto, S. Shimodaira, Corros. Sci., 14 (1974) 131 |
| [6] | A. L. Mackay, Mineral. Mag, 33 (1962) 270 |
| [7] | Jeffery E. Post, Vagn F. Buchwald, Am. Mineral. 76 (1991) 272 |
| [8] | Huixin Xiong, Yuehua Liao, Lixiang Zhou, Yiqun Xu, Shimeiwang, Environ. Sci. Technol. 42 (2008) 4165 |
| [9] | Alexander E. Gash, Joe H. Satcher. Jr, Randall L. Simpson, Chem. Mater., 15 (2003) 3268 |
| [10] | Ramesh Chitrakar, Satoko Tezuka, Akinari Sonoda, Kohji Sakane, Takahiro Hirotsu, Ind. Eng. Chem. Res., 48 (2009) 2107 |
| [11] | U. Schwetmann, R. M. Cornell, Iron oxides in the Laboratory , VCH publishers, New York, 1991 |
| [12] | Xiao-Min Lin, Anna C. S. Samia, J. Mag. Mag. Mater., 305 (2006) 100 |
| [13] | Meng Meng Lin, Hyung-Hwan Kim, Hyuck Kim, Mamoun Muhammed, Do Kyung Kim, Nano Rev., 1 (2010) 4883 |
| [14] | Sophie Laurent, Delphine Forge, Marc Port, Alain Roch, Caroline Robic, Luce Vander Elst, Robert N. Muller, Chem. Rev, 108 (2008) 2064 |
| [15] | C.Albornoz, S. E. Jacobo, J. Mag. Mag. Mater., 305 (1) (2006) 12 |
| [16] | Nhiem Tran, Aparna Mir, Dhriti Mallik, Arvind Sinha, Suprabha Nayar, Thomas J Webster, Int. J. Nanomedicine, 5 (2010) 277 |
| [17] | An-Hui Lu, E. L. Salabas, Ferdi Schuth, Angew, Chem. Int.Edu., 46 (2007) 1222 |
| [18] | M. C. Bautista, O. Bomati-Miguel, X. Zhao, M. P. Morales, T. Gonzalez-Carreno, R. Perezde Alejo, J. Ruiz-Cabello S. Veintemillas-Verdaguer, Nanotechnol. 15, (2004) 154 |
| [19] | A. L. Willis, N. J. Turro, S. O’ Brien, Chem. Mater, 17 (2005) 5970 |
| [20] | B. L. Cushing, V. L. Kolesnichenko, C. J. O’ Connor, Chem. Rev., 104 (2004) 3893 |
| [21] | Ke Tao, Hongjing Dou, Kang Sun, Chem. Mater., 18 (2006) 5273 |
| [22] | Mamata Mohapatra, Lagnamayee Mohapatra, Shashi Anand, Barada Kanta Mishra, J. Chem. Eng. Data, 55 (2010) 1486 |
| [23] | Maria Nesterova, John Moreau, Jillian F. Banfield, Geochim. Cosmochim. Acta, 67 (2003) 1177 |
| [24] | Z. Chang, D. G. Evans, X. Duan, C. Vial, J. Ghanbaja, V. Prevot, M. De Roy, C. Forano, J. Sol. Stat. Chem, 178 (2005) 2766 |
| [25] | Mallikarjuna N. Nadagouda, Rajender S. Varma, Smart Mater. Struct, 15 (2006) 1260 |
| [26] | Jun Cai, Jia Liu, Zi Gao, Alexandra Navrostsky, Steven L. Suib, Chem. Mater. 13 (2001) 4595 |
| [27] | Xiong Wang, Xiangying Chen J. Mater. Chem, 14 (2004) 905 |
| [28] | Felix Funk, Gary J. Long, Dimitri Hautot, Ruth Buchi, Iso Christl, Peter G. Weidler, Hyperfine Interactions, 136 (2001) 73 |
| [29] | Abbas A. Khaleel, Chem. Eur. J, 10 (2004) 925 |
| [30] | Ynu SHI,Thesis;Superparamagnetic nanoparticles for magnetic resonance imaging (MRI) diagnosis, University of Adelaid, 2006 |
| [31] | Lionel Vayssieres, Jinghua Guo, Joseph Nordgren, Mat. Res. Soc. Symp. Proc. 1(2001) 635 |
| [32] | S. Music, S. Krehula, S. Popovic, Mater. Lett., 58 (2004) 444 |
| [33] | Kenny Stahl, Kurt Nielsen, Jianzhong Jiang, Bente Lebech, Jonathan C.Hanson, Poul Norby, Jettie van Lanschot, Corros. Sci., 45 (2003) 2563 |
| [34] | T. D. Glotch, M. D. Kraft, Phys. Chem. Min, 35 (2008) 569 |
| [35] | Zhong-Yong Yuan, Bao-Lian Su, Chem. Phys. Lett., 381 (2003) 710 |
| [36] | Kenneith Kauffmann, Fred Hazei, J. Inor. Nucl. Chem, 3 (1975) 1139 |
| [37] | E. Murad and J.L. Bishop, Am. Mineral, 85 (2000) 716 |
| [38] | E. A. Deliyanni, E N. Peleka, K. A. Matis, Separation Sci. Technol., 42 (2007) 993 |
| [39] | R. D. Waldron, Phys. Rev. 99 (1955) 6 |
| [40] | J. M. Gonzalez-Calbet, M. A. Alarno-Franco, M. Gayoso- Andrade, J.Inorg. Nucl. Chem, 43 (1981) 257 |
| [41] | L. Harris, J. opt. soc. Am. 45 (1955) 27 |
| [42] | A.Pradeep, P.Priyadharsini, G.Chandrasekaran, J. Mag. Mag. Mater., 320 (2008) 2774 |
| [43] | C. P. Rao, K. Geertha, R. P. Bandwar, Bioorg. Med. Chem. Lett., 2 (1992) 997 |
| [44] | Tauc, Amorphous and Liquid Semiconductors, Plenum, London, 1974 |
| [45] | E. A. David, N. F. Mott, Philos. Mag., 22 (1970) 903 |
| [46] | T. Miyata, S. Suzuki, M. Ishii and T. Minami, Thin Solid Films, 411 (2002) 76 |
| [47] | A.P. Roth, J. B. Webb, D. F. Williams, Solid State Commun., 39 (1981) 1269 |
| [48] | K. A. Jeon, J. H. Kim, W. Y. Shim, W. Y. Lee, M. H. Jung, S. Y. Lee, J. Cryst.Growth, 287 (2006) 66-69 |
| [49] | R. Elilarassi, G. Chandrasekaran, Mater. Chem. Phy. 121(2010) 378 |
| [50] | Kaushik Mallick, Michael J. Witcomb, Michael S. Scurrell, Andre M. Strydom, Gold Bulletin, 41(2008) 3 |
| [51] | Frank J. Owens, Charles P. Poole, The physics and chemistry of Nanosolids, John Wiley & Sons, Inc., Hoboken, New Jersey, 2008 |
| [52] | K. E. Garcia, A. L. Moralesa, C. A. Barreroa,b, C. E. Arroyave, J. M. Greneche, Physica B 354 (2004) 187 |
| [53] | V. K. Sankaranarayanan, N. S. Gajbhiye, J. Mag. Mag. Mater. 92 (1990) 217 |