
-
Paper Information
- Paper Submission
-
Journal Information
- About This Journal
- Editorial Board
- Current Issue
- Archive
- Author Guidelines
- Contact Us
Microeconomics and Macroeconomics
p-ISSN: 2168-457X e-ISSN: 2168-4588
2026; 12(1): 1-21
doi:10.5923/j.m2economics.20261201.01
Received: Oct. 4; Accepted: Oct. 29, 2026; Published: Nov. 17, 2026

A Macroeconomic Analysis of India’s Current Economy: Growth, Stability, and Trajectory
 Abstract
 Reference
 Full-Text PDF
 Full-text HTML
Amarjit Singh1, Rajdeep Vraj Alpesh Kumar2
1Department of Civil, Environmental, and Construction Engineering, University of Hawaii at Manoa, Honolulu, HI, USA
2Department of Civil Engineering, IIT Gandhinagar, Gandhinagar, Gujarat, India
Correspondence to: Amarjit Singh, Department of Civil, Environmental, and Construction Engineering, University of Hawaii at Manoa, Honolulu, HI, USA.
| Email: |  |
Copyright © 2026 The Author(s). Published by Scientific & Academic Publishing.
This work is licensed under the Creative Commons Attribution International License (CC BY).
http://creativecommons.org/licenses/by/4.0/

This article assesses India’s macroeconomic performance in FY 2024–25 and FY 2025–26, using monetary management as the principal analytical framework and incorporating data and selected developments verified through July 2026. Fourteen indicators are examined, covering monetary policy, inflation, labour-market conditions, fiscal consolidation, merchandise and services trade, the current account, foreign investment, the exchange rate, monetary velocity, and tourism earnings. The findings reveal a qualified “goldilocks” configuration: real GDP growth of 7.1 percent in FY 2024–25 and 7.7 percent in FY 2025–26 coincided with exceptionally low CPI inflation, a cumulative 125-basis-point monetary easing cycle during 2025, and record gross FDI inflows of USD 94.53 billion in FY 2025–26. These favourable outcomes were accompanied, however, by a widening merchandise trade deficit, marked rupee depreciation, incomplete labour-market formalisation, and weak net FDI relative to gross inflows. Net FDI declined to approximately USD 0.96 billion in FY 2024–25 before recovering to USD 7.65 billion in FY 2025–26. The RBI reduced the policy repo rate to 5.25 percent, while headline CPI inflation reached a series low of 0.25 percent in October 2025. Strong services exports and remittance inflows supported current-account surpluses of USD 13.7 billion in Q4 FY 2024–25 and USD 7.1 billion in Q4 FY 2025–26, although the full-year FY 2025–26 current account remained in deficit by USD 25.2 billion, or 0.6 percent of GDP. The analysis concludes that India combined rapid growth, disinflation, and monetary easing with broad macroeconomic stability, but that the durability of this performance will depend on stronger external resilience, productive investment retention, labour formalisation, and continued fiscal consolidation.
Keywords: RBI monetary policy, Flexible inflation targeting, Fiscal consolidation, Exchange rate, FDI, Macroeconomic indicators, GDP growth
Cite this paper: Amarjit Singh, Rajdeep Vraj Alpesh Kumar, A Macroeconomic Analysis of India’s Current Economy: Growth, Stability, and Trajectory, Microeconomics and Macroeconomics, Vol. 12 No. 1, 2026, pp. 1-21. doi: 10.5923/j.m2economics.20261201.01.
Article Outline
1. Introduction
- India has emerged as one of the defining economic narratives of the early twenty-first century. India is now among the world’s five largest economies in nominal terms and ranks third globally on a purchasing-power-parity basis (International Monetary Fund, 2025b). What distinguishes the recent trajectory is its durability: the Reserve Bank of India (RBI) and successive Union governments have navigated a densely populated, rapidly industrializing economy through a pandemic contraction, an inflationary commodity supercycle, a geopolitical reconfiguration of supply chains, and a US dollar strengthening cycle — while apparently preserving macroeconomic stability and institutional credibility.The broader development picture is less favorable. Despite rapid infrastructure expansion, India continues to face significant deficits in urban mobility, environmental quality, sanitation, road safety, and human development. Traffic congestion is worsening in many major cities; road and construction dust constitutes a major source of urban particulate pollution, accounting for approximately 36 percent in the cited CPCB assessment (CPCB, 2024). Landfills are overflowing, and sewage treatment capacity remains incomplete in the majority of large cities, with MoHUA’s own data suggesting less than 40 percent of generated sewage is treated to acceptable standards (MoHUA, 2024). Pollution levels in rivers and along highways consistently exceed acceptable norms, while road safety incidents and fatalities remain exceptionally high (WHO, 2023)— India accounts for approximately 10 percent of global road accident deaths while owning only 1 percent of global vehicles (PTI, 2021). Importantly, India’s Human Development Index (HDI) value increased from 0.446 in 1990 to 0.685 in 2023, although its 2025 rank of 130 out of 193 countries indicates that human-development outcomes continue to lag behind the country’s macroeconomic scale (UNDP, 2025), suggesting that rapid economic growth has not yet translated proportionately into human capital improvement. These structural gaps mean that macroeconomic strength, while real, must be read alongside persistent gaps in public goods delivery and quality of life.The present article situates India’s macroeconomic condition within the analytical framework of monetary management. Broadly construed, monetary management encompasses the instruments and strategies through which a central bank and government regulate money supply, credit conditions, price stability, and external balance to achieve sustainable economic growth. For India, this framework is anchored in the Flexible Inflation Targeting (FIT) regime given statutory effect through the Finance Act, 2016, which amended the Reserve Bank of India Act, 1934 and established the six-member Monetary Policy Committee (MPC). Section 45ZA requires the Central Government, in consultation with the RBI, to determine and notify a consumer price inflation target once every five years. The initial Gazette notification of August 5, 2016 fixed the target at 4 percent, with a tolerance band of ±2 percentage points (Government of India, 2016; Government of India, Ministry of Finance, Department of Economic Affairs, 2016).Alongside the growth and disinflation gains documented in this article, four structural vulnerabilities recur throughout the analysis and are termed as such because each has the potential to constrain the RBI's policy space or destabilize India's external balance if left unaddressed: (1) a chronic negative merchandise trade balance (Section 8), (2) weak net FDI relative to record gross inflows (Section 9), (3) incomplete labour-market formalisation (Section 6), and (4) mounting exchange-rate depreciation pressure (Section 8.3). These are examined in detail, indicator by indicator, in the sections that follow.
1.1. Outline
- The article proceeds as follows: Section 2 presents a consolidated data snapshot. Sections 3 through 12 provide detailed indicator-level analyses, supported by eight author-constructed charts distributed across the discussion. Section 13 synthesizes the evidence through monetary management theory. Section 14 advances eight policy recommendations. Section 15 concludes.
2. Macroeconomic Snapshot
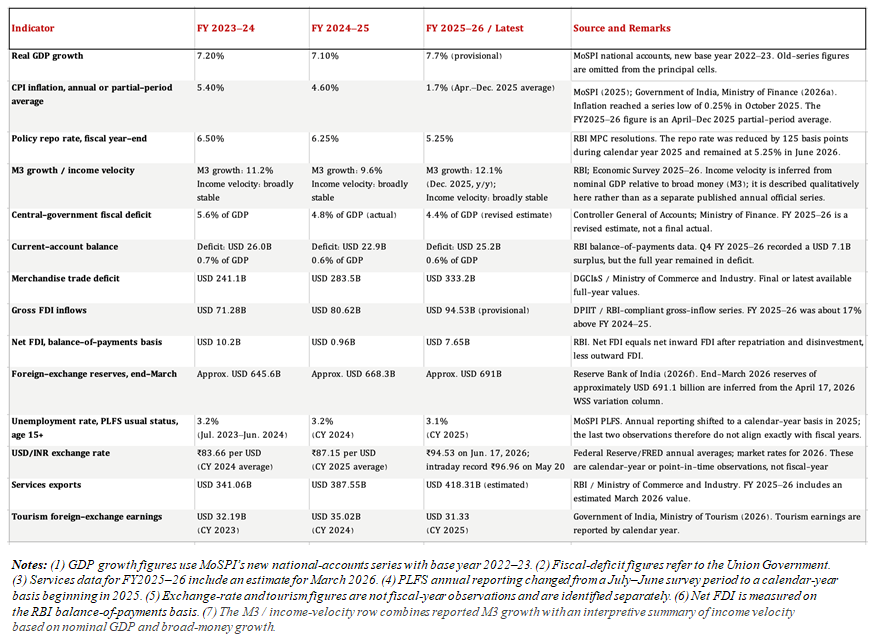
- Table 1 consolidates the principal macroeconomic indicators examined in this article, drawing on verified data from Ministry of Statistics and Programme Implementation (MoSPI), the Reserve Bank of India (RBI), the Ministry of Finance, Controller General of Accounts (CGA), Department for Promotion of Industry and Internal Trade (DPIIT), Press Information Bureau (PIB), and the Ministry of Tourism.
 | Table 1. Selected Macroeconomic Indicators—India, FY 2023–24 to FY 2025–26 (Latest available official data; reference periods differing from the fiscal year are identified.) |
2.1. Data Sources and Analytical Method
- The analysis uses fourteen macroeconomic indicators selected to represent monetary, fiscal, external-sector, labour-market, and structural dimensions of India’s economic performance. Official Indian sources—including MoSPI, RBI, CGA, DPIIT, the Ministry of Finance, the Ministry of Commerce and Industry, and the Ministry of Tourism—are used wherever available, supplemented by established international sources when necessary. Fiscal-year, calendar-year, quarterly, and point-in-time observations are distinguished explicitly to avoid false comparability. The study is descriptive and interpretive rather than econometric: it evaluates trends, policy transmission, and interrelationships among indicators through established monetary-management frameworks. The scores presented in Figure 8 are author-assigned assessments based on direction of change, proximity to policy objectives, historical performance, and macroeconomic sustainability, and should not be interpreted as official ratings.
3. GDP Growth Rate
3.1. Historical Trajectory
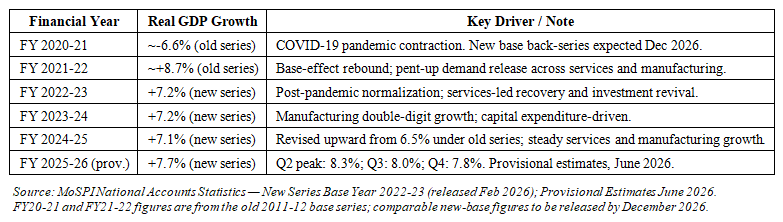
- India’s real GDP contracted sharply in FY 2020–21 under the old series (base 2011-12), and recovery was swift and V-shaped thereafter. Under the new MoSPI base year 2022-23, released in February 2026, FY 2023–24 growth stands at 7.2 percent and FY 2024–25 at 7.1 percent — both revised from the old series figures of 8.2 percent and 6.5 percent respectively. The new base incorporates improved methodology including double deflation and the SUT framework. Table 2 and Figure 1 present the verified trajectory under the new series.
 | Table 2. India Real GDP Growth Rate — Verified Data (New Base 2022-23 where available) |
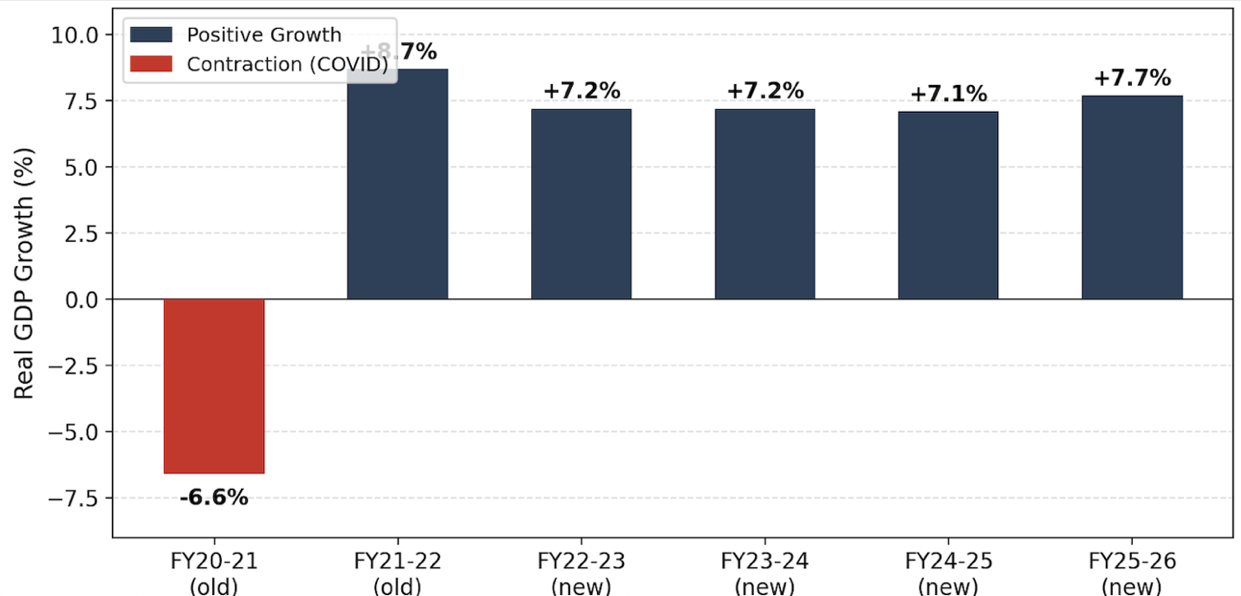 | Figure 1. India Real GDP Growth Rate (%) — FY 2020-21 to FY 2025-26 (Source: MoSPI National Accounts Statistics (New Base Year 2022-23, released Feb 2026); Provisional Estimates, June 2026. FY20-21 and FY21-22 use old series (base 2011-12).) |
3.2. Current Performance and Drivers
- In FY 2025–26, real GDP grew at 7.7 percent provisionally (MoSPI, 2026d). Growth accelerated from 6.8 percent in Q1 to 8.3 percent in Q2 and 8.0 percent in Q3 before moderating to 7.8 percent in Q4. This exceeded the RBI’s October 2025 projection of 6.8 percent, which was subsequently revised upward to 7.3 percent by February 2026 (Reserve Bank of India, 2025a, 2026c).Manufacturing was a major growth driver, recording double-digit expansion in both FY2023–24 and FY2025–26 under the new series. In FY2025–26, construction grew by 7.4 percent, financial, real-estate, and professional services by 10.4 percent, and manufacturing by 10.7 percent (MoSPI, 2026a, 2026d). When the government invests heavily in roads, railways, ports, and urban infrastructure, it directly stimulates demand for steel, cement, labour, and logistics services, creating a multiplier effect that ripples across the broader economy. India remains the world’s fastest-growing major economy, a position supported by the IMF’s October 2025 World Economic Outlook and its 2025 assessment of the Indian economy (International Monetary Fund, 2025a, 2025b). Evidently, there are a few reasons for this:• Strong domestic demand: A vast consumer market, rising incomes, and rapid urbanization sustain consumption even when global demand weakens.• High investment: Public spending on transport, energy, housing, and digital infrastructure is raising productive capacity and encouraging private investment.• Competitive services and reforms: Expanding technology and business-service exports, healthier banks and corporations, and earlier structural reforms support productivity and economic resilience.
4. RBI Monetary Policy and Interest Rates
4.1. The Flexible Inflation Targeting Framework
- India’s monetary architecture rests on the Flexible Inflation Targeting (FIT) framework, formalised under the RBI Act amendment of May 2016. The MPC meets bimonthly to vote on the policy repo rate — the rate at which the RBI lends overnight funds to scheduled commercial banks. The policy repo rate serves as the MPC’s principal policy signal. The Standing Deposit Facility and Marginal Standing Facility rates form the floor and ceiling, respectively, of the liquidity corridor, while RBI liquidity operations seek to transmit the policy rate to overnight money-market rates. The mandate is explicitly symmetric: the MPC must respond to both upside inflation breaches and downside undershoots relative to the 4 percent target (Bernanke and Mishkin, 1997).
4.2. The 125-Basis-Point Easing Cycle in Calendar Year 2025
- After maintaining the policy repo rate at 6.50 percent from February 2023 until January 2025, the Monetary Policy Committee (MPC) commenced an easing cycle in February 2025. It reduced the repo rate by 25 basis points to 6.25 percent in February, followed by another 25-basis-point reduction to 6.00 percent in April. In June, the MPC accelerated the easing cycle with a 50-basis-point cut, bringing the repo rate to 5.50 percent. The rate was subsequently held unchanged at the August and October meetings before the MPC delivered a final 25-basis-point reduction in December, lowering the repo rate to 5.25 percent. The cumulative reduction during calendar year 2025 was therefore exactly 125 basis points: February (−25) + April (−25) + June (−50) + December (−25) = −125 basis points (Reserve Bank of India, 2025b). The MPC maintained the repo rate at 5.25 percent at its February, April, and June 2026 meetings and continued with a neutral policy stance (Reserve Bank of India, 2026c, 2026d, 2026e). Figure 2 plots the movements in headline CPI inflation and the policy repo rate over this period.
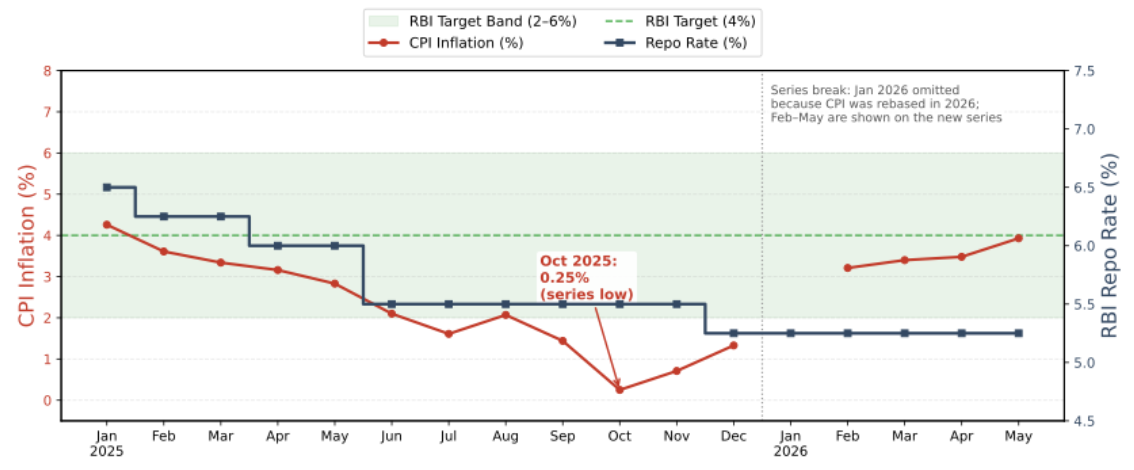 | Figure 2. CPI Inflation and the RBI Policy Repo Rate, January 2025 to May 2026 (Source: MoSPI (2025, 2026c) and Reserve Bank of India (2025b, 2026c–2026e). The shaded band denotes the RBI’s inflation tolerance range of 2–6 percent, with a 4 percent midpoint target. January 2026 is omitted because the CPI series was rebased in 2026; February–May 2026 are shown on the new series.) |
 where r is the ex ante real interest rate, i is the nominal interest rate, and
 is expected inflation (Fisher, 1930). Because the relevant variable is expected rather than contemporaneous inflation, observed CPI inflation cannot be treated as a precise measure of the ex ante real policy rate. It can, however, provide an ex post indication of monetary restrictiveness. Using December 2025 headline inflation of 1.33 percent as such a proxy, the 5.25 percent repo rate implied an approximate real policy rate of 3.92 percent. Immediately before the December rate cut, when the repo rate stood at 5.50 percent, the corresponding proxy would have been approximately 4.17 percent.Thus, the sharp decline in inflation would have raised the real policy rate—and tightened monetary conditions passively—had the nominal repo rate remained unchanged. The 125-basis-point easing cycle partly offset this effect and reduced the real cost of borrowing relative to what it otherwise would have been. By retaining a neutral stance, however, the MPC avoided committing itself to further reductions and preserved the flexibility to respond to incoming inflation, growth, and financial-market data (Reserve Bank of India, 2025a).
5. Inflation Dynamics
5.1. Inflation Dynamics in 2025
- Inflation declined sharply during 2025 and moved well below the RBI’s 4 percent midpoint target for most of the year. Headline CPI inflation fell from 4.26 percent in January 2025 to 3.61 percent in February, 3.34 percent in March, 3.16 percent in April, and 2.83 percent in May. It then slowed further to 2.10 percent in June, 1.61 percent in July, 2.07 percent in August, and 1.44 percent in September, before reaching a historic series low of 0.25 percent in October 2025. Inflation rose modestly thereafter to 0.71 percent in November and 1.33 percent in December, but remained well below the RBI’s tolerance band midpoint (MoSPI, 2025).This unusually rapid disinflation was driven primarily by food prices. Improved agricultural supplies, favorable base effects, easing prices of vegetables and pulses, and lower food inflation more broadly contributed materially to the decline. Monetary policy also played a supporting role by maintaining credibility and helping to anchor inflation expectations, but the magnitude and speed of the decline suggest that supply-side factors were especially important. The 2025 outcome should therefore not be interpreted simply as a demand-compression story. Rather, it reflected the interaction of restrained inflation expectations, easing commodity pressures, and favorable food-supply conditions (Government of India, Ministry of Finance, 2026a; MoSPI, 2025).Figure 2 shows that inflation moved from slightly above the 4 percent midpoint at the beginning of 2025 to well below the midpoint, and at times even below the lower edge of the RBI’s 2–6 percent tolerance band. This created room for monetary easing during 2025, even though the RBI still had to remain attentive to exchange-rate movements, oil-price volatility, and the possibility that exceptionally low inflation might later reverse.
5.2. Inflation Rebound in Early 2026
- The inflation trough proved temporary. Under the rebased CPI series introduced in 2026, headline inflation rose to 3.21 percent in February 2026, 3.40 percent in March, 3.48 percent in April, and 3.93 percent in May (MoSPI, 2026c). This rebound brought inflation back close to the RBI’s 4 percent target midpoint, although it still remained within the formal tolerance band.The rise in early 2026 should not be interpreted as an inflationary breakdown. Rather, it represented a normalization from the exceptionally low readings of late 2025. Part of the increase reflected the fading of favorable base effects, while part reflected renewed price pressures after the unusually soft food-inflation environment that had prevailed in mid-to-late 2025. In that sense, the inflation path in early 2026 reinforces the need for caution in interpreting the October 2025 low as a durable structural shift.From a monetary-management perspective, the 2025–26 sequence is significant for two reasons. First, it demonstrates that the RBI’s inflation-targeting framework was able to accommodate a substantial easing cycle without a loss of credibility. Second, it shows that inflation undershoots can reverse fairly quickly when base effects fade and relative-price pressures return. The principal concern was therefore not generalized deflation, but the risk of an excessively prolonged undershoot followed by renewed normalization.
6. Unemployment and Labour-Market Conditions
6.1. Aggregate Statistics
- India’s headline unemployment rate, measured by the Periodic Labour Force Survey under the usual-status definition for persons aged 15 years and above, declined from 4.2% in FY2020–21 to 4.1% in FY2021–22 and 3.2% in FY2022–23. It remained at 3.2% in FY2023–24. Under the redesigned PLFS, which shifted annual reporting from the July–June agricultural year to the January–December calendar year, the national unemployment rate edged down to 3.1% in 2025. Because the survey design and reporting period changed in 2025, the latest observation should be compared with the earlier series cautiously (Ministry of Statistics and Programme Implementation [MoSPI], 2024, 2026b). The urban unemployment rate remained consistently higher than the rural rate, although both declined over the period. Urban unemployment fell from 6.7% in FY2020–21 to 5.1% in FY2023–24 and 4.8% in calendar year 2025. Rural unemployment declined from 3.3% to 2.5% and then to 2.4% over the corresponding observations. The urban–rural gap therefore narrowed from 3.4 percentage points to 2.4 percentage points (MoSPI, 2024, 2026b). The lower rural unemployment rate should not be interpreted as evidence that rural labour markets are necessarily stronger. Rural households can absorb workers into family farming, self-employment, casual work, and subsidiary economic activities, even when hours, earnings, and productivity are low. Urban workers, by contrast, are more likely to remain openly unemployed while searching for regular salaried employment that matches their education, skills, and wage expectations. The urban–rural gap therefore reflects both genuine differences in employment opportunities and differences in the ways unemployment and underemployment appear in the two sectors (MoSPI, 2024, 2026b).Figure 3 presents the annual usual-status series and should be interpreted as an indicator of open unemployment, not as a complete measure of labour underutilization, job security, earnings, or employment quality.
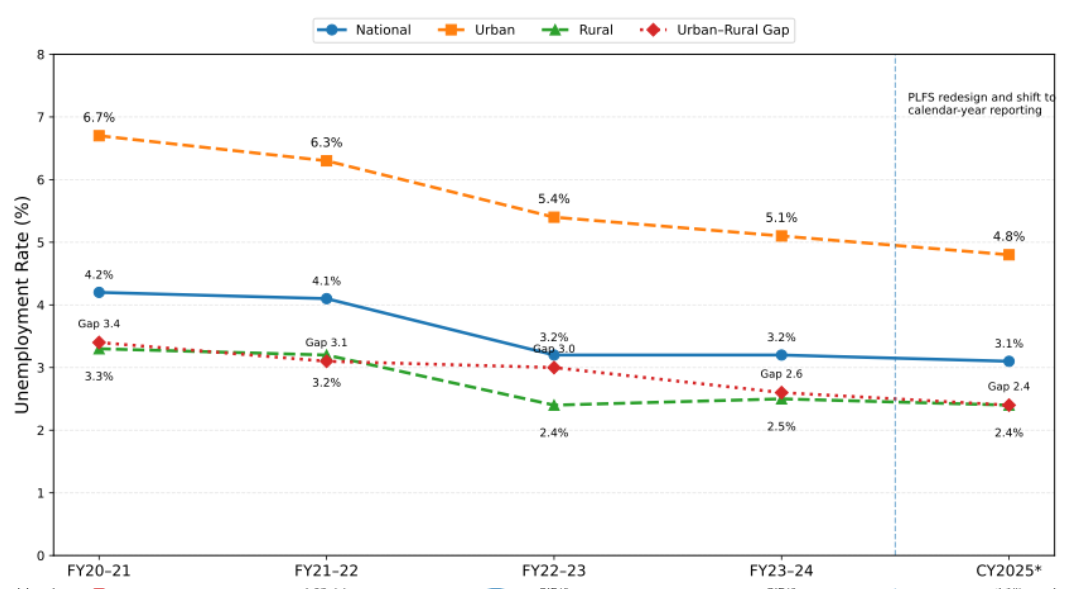 | Figure 3. India’s Unemployment Rate in Usual Status—National, Urban, and Rural, FY2020–21 to Calendar Year 2025 (% of labour force, age 15+) (Source: MoSPI, Periodic Labour Force Survey Annual Reports. Unemployment is measured in usual status, combining principal and subsidiary status. The urban–rural gap is calculated as the urban rate minus the rural rate. Calendar year 2025 reflects the redesigned PLFS and the shift from July–June to January–December reporting and is therefore not strictly comparable with preceding observations.) |
6.2. Structural and Demographic Dimensions
- The low headline unemployment rate does not eliminate concerns about employment quality and labour productivity. Agriculture and allied activities account for approximately 46.1% of India’s workforce but generate only about one-fifth of national income. This large employment–output imbalance indicates substantially lower average labour productivity in agriculture and suggests that underemployment and surplus labour remain widespread, although not every agricultural worker should be classified as disguisedly unemployed (Government of India, Ministry of Finance, 2026b). Employment also remains heavily concentrated in self-employment and informal work. In rural areas, self-employed workers accounted for approximately 63.2% of employment during October–December 2025. Such employment can include productive entrepreneurship, but it also encompasses own-account work and unpaid family labour undertaken because regular salaried opportunities are unavailable. Consequently, a decline in measured unemployment may coexist with low earnings, irregular work, and inadequate social protection (MoSPI, 2026b). The aggregate rate also conceals significant demographic disparities. In FY2023–24, the usual-status unemployment rate among persons aged 15–29 was 10.2%, more than three times the overall rate of 3.2%. In calendar year 2025, usual-status unemployment among urban women aged 15 years and above was 6.4%, compared with an overall urban rate of 4.8%. These differences reflect prolonged school-to-work transitions, skill and job mismatches, limited availability of suitable salaried positions, geographic constraints, and the disproportionate burden of unpaid care responsibilities on women (MoSPI, 2024, 2026b). There are nevertheless indications of gradual formalisation. The Employees’ Provident Fund Organisation (EPFO) recorded approximately 1.29 crore net payroll additions in FY2024–25, while Production-Linked Incentive schemes had supported more than 12.6 lakh direct and indirect jobs across fourteen sectors by September 2025. These figures should be interpreted carefully: EPFO net additions include workers who change jobs or re-enter covered employment, while reported PLI employment includes both direct and indirect jobs. They indicate expanding formal payroll and manufacturing activity, but they are not equivalent to an identical number of newly created permanent jobs (Government of India, Press Information Bureau, 2025; Press Information Bureau, 2025b; Government of India, Ministry of Finance, 2026a).
7. Fiscal Policy and the Deficit
7.1. Consolidation Trajectory
- The central government’s fiscal deficit has followed a credible consolidation path. The FY 2024–25 deficit was confirmed at 4.8 percent of GDP by the Controller General of Accounts (CGA) in May 2025, meeting the revised estimate target exactly at ₹15.77 lakh crore (CGA, 2025). This represents consolidation from a pandemic-era peak of 9.2 percent of GDP in FY 2020–21. Because the new GDP series produces a somewhat lower nominal-GDP denominator, a mechanical recalculation would raise the FY2025–26 fiscal-deficit ratio by approximately 0.1 percentage point. Table 1 and Figure 4 nevertheless report the official Revised Estimate of 4.4 percent, as published in the budget documents using the prevailing budget denominator (Ministry of Finance, Government of India, 2026)1. Figure 4 visualizes the full consolidation arc.
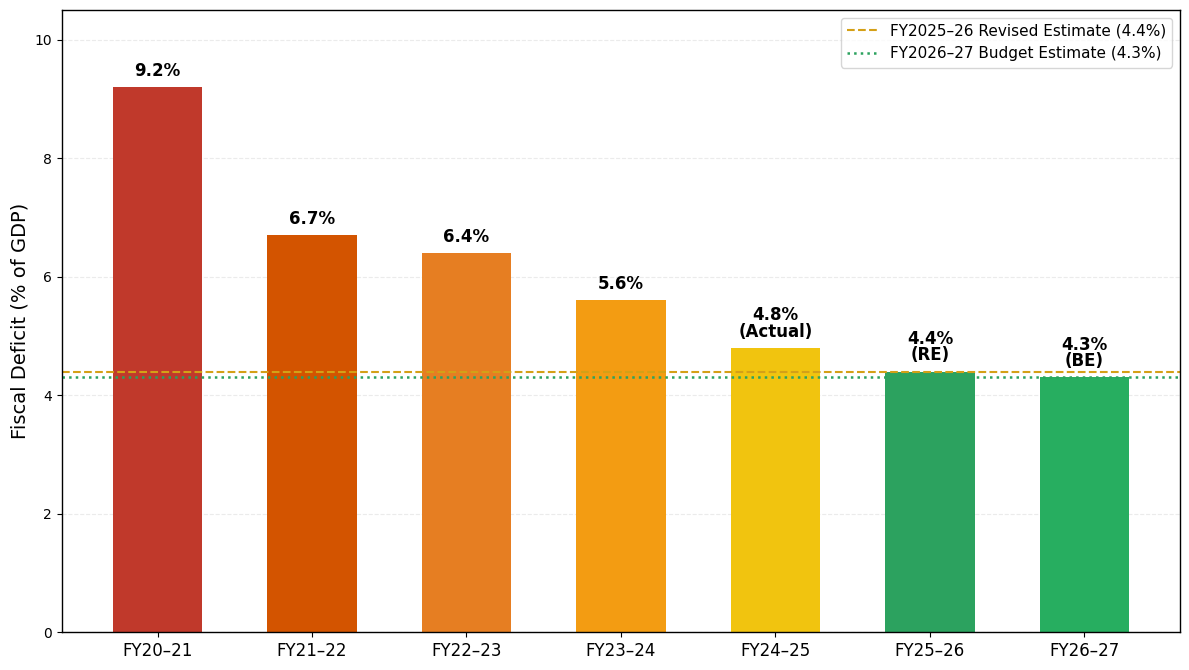 | Figure 4. India’s Central Government Fiscal Deficit as a Percentage of GDP, FY2020–21 to FY2026–27 (Source: Controller General of Accounts for actual fiscal outcomes through FY2024–25; Government of India, Ministry of Finance, Union Budget 2026–27, for FY2025–26 RE and FY2026–27 BE. RE = Revised Estimate; BE = Budget Estimate.) |
7.2. Revenue and Expenditure Dynamics
- Fiscal consolidation was achieved while preserving a strong emphasis on public investment. The Union government’s actual capital expenditure reached ₹10.52 lakh crore in FY2024–25. The FY2025–26 Budget initially provided ₹11.21 lakh crore for capital expenditure, equivalent to 3.1 percent of GDP, although the subsequent Revised Estimate placed expenditure at ₹10.96 lakh crore. This represented a modest shortfall relative to the original budget allocation but remained approximately 4.2 percent above the FY2024–25 actual level (Ministry of Finance, Government of India, 2025, 2026).Revenue performance also strengthened the fiscal position. Gross GST collections reached a record ₹22.08 lakh crore in FY2024–25, an increase of 9.4 percent over the previous year, with average monthly collections of ₹1.84 lakh crore (Press Information Bureau, 2025a). In addition, the RBI transferred ₹2.11 lakh crore—more precisely, ₹2,10,874 crore—to the Central Government during FY2024–25 from its surplus for the accounting year 2023–24. This was a record transfer at the time and substantially strengthened the government’s non-tax revenues and available fiscal space (Reserve Bank of India, 2024).These developments are broadly consistent with the debt-dynamics framework associated with Domar (1944). When the nominal growth rate of GDP exceeds the effective nominal interest rate on government debt, the resulting favourable interest-growth differential reduces the burden of the existing debt stock relative to GDP. Debt-ratio stabilization, however, also depends on the primary fiscal balance: even when growth exceeds the borrowing cost, a sufficiently large primary deficit can cause the debt ratio to rise. Consequently, sustained nominal growth, controlled primary deficits, and the productive use of borrowed funds for capital formation must operate together to support fiscal sustainability.
8. Trade Balance, Current Account, and Exchange Rate
8.1. Merchandise Trade
- India runs a structural merchandise trade deficit, reflecting its heavy dependence on imported energy, gold, electronics, machinery, and industrial intermediate inputs (Government of India, Ministry of Finance, Department of Economic Affairs, 2026). Final DGCI&S data show that merchandise exports remained broadly unchanged at USD 437.70 billion in FY 2024–25, while imports increased to USD 721.20 billion, producing a merchandise trade deficit of USD 283.50 billion—approximately 7.2 percent of nominal GDP on the contemporaneous GDP estimate (Government of India, Ministry of Commerce and Industry, Department of Commerce, 2026). Energy dependence accounts for a substantial portion of the imbalance. Imports of crude petroleum and petroleum products totaled USD 185.78 billion, equivalent to approximately 25.8 percent of merchandise imports. After accounting for USD 63.38 billion in petroleum-product exports, however, the net petroleum trade deficit was approximately USD 122.40 billion. Gold imports added USD 58.01 billion, while electronic components, telecommunications equipment, computer hardware, and industrial machinery constituted further major import categories (Government of India, Ministry of Commerce and Industry, Department of Commerce, 2026). The persistence of the deficit is partly a consequence of India’s rapid, domestically driven growth: rising consumption, infrastructure construction, manufacturing investment, and digitalization generate demand for fuels, capital equipment, components, and raw materials that domestic production cannot yet fully supply. At the same time, merchandise exports have not expanded sufficiently rapidly to match this import-intensive growth. The deficit therefore represents an external-sector vulnerability—raising foreign-exchange requirements and exposing the rupee and domestic inflation to commodity-price shocks—rather than a direct deterioration in the government’s fiscal balance. India’s large services surplus and inward remittances nevertheless offset much of the merchandise deficit when the broader current account is calculated. Figure 5 plots merchandise exports, imports, and the resulting trade deficit over five fiscal years.
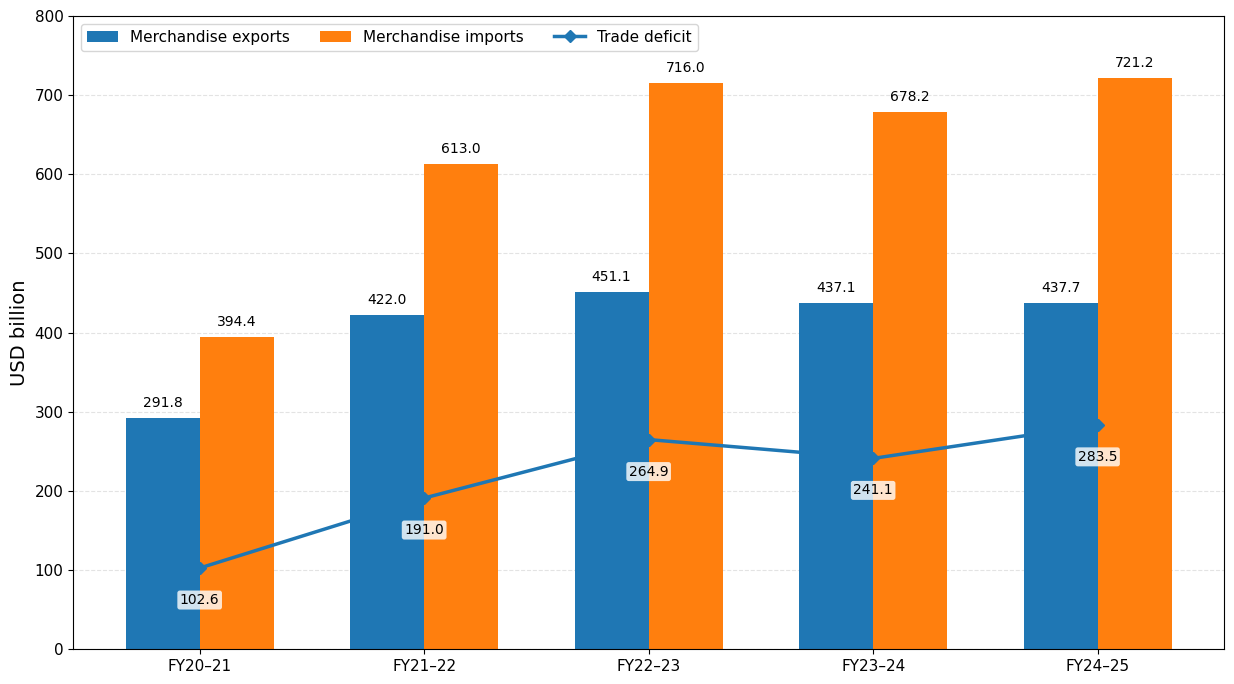 | Figure 5. India’s Merchandise Trade—Exports, Imports, and Trade Deficit, FY 2020–21 to FY 2024–25 (USD billion) (Source: Directorate General of Commercial Intelligence and Statistics, as reported in Government of India, Ministry of Commerce and Industry, Department of Commerce, Annual Report 2025–26. The trade deficit is calculated as merchandise imports minus merchandise exports.) |
8.2. Services Surplus and Current Account
- India’s persistent merchandise trade deficit is substantially offset by its strong services-export surplus and inward private transfers. On the latest partially revised RBI basis, services exports reached USD 387.6 billion in FY 2024–25, while services imports stood at USD 198.7 billion, producing a record services trade surplus of USD 188.8 billion. This surplus offset approximately two-thirds of the merchandise trade deficit (Government of India, Ministry of Finance, Department of Economic Affairs, 2026; Reserve Bank of India, 2026a).The strength of services exports reflects India’s established comparative advantage in computer, business, and professional services. It is supported by the availability of skilled personnel, extensive digital infrastructure, cost competitiveness, and the expansion of India-based Global Capability Centres. Software services remain the largest component, while business-process management, consulting, financial technology, engineering, and other professional services have broadened the export base. Unlike merchandise exports, many of these services can be delivered digitally and require relatively few imported physical inputs, allowing them to generate a large net foreign-exchange surplus (Government of India, Ministry of Finance, Department of Economic Affairs, 2026).India recorded a current-account surplus of USD 13.7 billion, equivalent to 1.4 percent of GDP, in Q4 FY 2024–25 on the subsequently revised RBI series. The surplus did not result from an elimination of the merchandise deficit. Rather, the merchandise trade deficit moderated to USD 59.3 billion during the quarter, while net services receipts reached USD 53.3 billion and net secondary-income receipts—principally private transfers and remittances—provided a further substantial offset. Nevertheless, the deficits accumulated during the preceding three quarters resulted in a full-year CAD of USD 22.9 billion, or 0.6 percent of GDP, compared with USD 26.0 billion, or 0.7 percent of GDP, in FY 2023–24 (Reserve Bank of India, 2026a).The quarterly surplus narrowed to USD 7.1 billion, or 0.7 percent of GDP, in Q4 FY 2025–26. The principal cause was the widening of the quarterly merchandise trade deficit from USD 59.3 billion to USD 83.4 billion. Net services receipts nevertheless increased to USD 60.4 billion, supported by computer and other business services, while personal transfer receipts—mainly remittances from Indians employed overseas—rose from USD 33.9 billion to USD 43.5 billion. These inflows were sufficiently large to preserve a quarterly current-account surplus, but not to offset the merchandise deficit over the full year. Consequently, the FY 2025–26 CAD stood at USD 25.2 billion, equivalent to 0.6 percent of GDP (Reserve Bank of India, 2026a).Current-account management is appropriately included as a macroeconomic performance indicator because the current account measures the economy’s net transactions in goods, services, primary income, and transfers with the rest of the world. In macroeconomic accounting terms, a current-account deficit broadly corresponds to the excess of domestic investment over national saving. It should not, however, be interpreted simply as evidence that a country is “living beyond its means.” A moderate deficit may be sustainable—and economically beneficial—when it finances productive investment and is supported by stable capital inflows, adequate foreign-exchange reserves, and manageable external liabilities.The principal concern is therefore not the existence of a CAD but its size, persistence, composition, and method of financing. A widening deficit increases the economy’s need for foreign capital and can place downward pressure on the rupee when capital inflows weaken. Currency depreciation may then raise the domestic cost of oil, machinery, electronics, and other imports, adding to inflationary pressures. Under such conditions, the external balance can complicate monetary easing, although it does not mechanically determine RBI interest-rate decisions. Fiscal policy also affects the current account indirectly through its effects on national saving, aggregate demand, and import requirements. CAD management therefore connects domestic saving and investment, trade competitiveness, energy dependence, capital flows, exchange-rate stability, and monetary policy, making it an important component of a macroeconomic performance scorecard (Government of India, Ministry of Finance, Department of Economic Affairs, 2026).
8.3. USD/INR Exchange Rate
- The Indian rupee depreciated materially over the period under review. The annual average exchange rate increased from ₹83.66 per USD in 2024 to ₹87.15 in 2025, representing depreciation of approximately 4.2 percent in annual-average terms. External pressures intensified during the first half of 2026. On May 20, 2026, the USD/INR rate reached an intraday record high of ₹96.96, corresponding to an all-time low for the rupee, before closing at ₹96.82. The decline was driven principally by the sharp rise in international oil prices associated with the Middle East conflict, higher global bond yields, weak capital inflows, foreign portfolio outflows, and sustained dollar demand from importers. By June 17, the rupee had recovered partially and closed at approximately ₹94.53 per USD as oil prices declined and geopolitical pressures temporarily eased (Board of Governors of the Federal Reserve System, 2026; Kalra, 2026).Rupee depreciation raises the domestic-currency cost of imported crude oil, natural gas, electronics, machinery, and industrial intermediate inputs. It can therefore increase firms’ production and transportation costs, widen the merchandise trade deficit, and contribute to consumer-price inflation. The inflationary pass-through is neither immediate nor one-for-one, however, because part of the increase may be absorbed through corporate profit margins, changes in petroleum taxes or administered prices, substitution among suppliers, and exchange-market intervention by the RBI.A weaker rupee may simultaneously improve the price competitiveness and rupee-denominated earnings of Indian exporters, particularly exporters of software and other services, and make India less expensive for foreign tourists. These benefits are not automatic. Exporters that rely heavily on imported machinery, energy, or intermediate inputs also face higher costs, while export performance ultimately depends on foreign demand, productive capacity, and the currency in which contracts are invoiced. Because India is a large net importer of energy and several critical industrial inputs, the adverse trade and inflation effects of rapid depreciation may dominate in the short run.Figure 6 plots the USD/INR exchange-rate trajectory. The rupee’s decline during the first half of 2026 was substantial: from approximately ₹89.9 per USD at the end of 2025 to the intraday low of ₹96.96 on May 20, the rupee depreciated by approximately 7.9 percent. By June 17, the year-to-date depreciation had moderated to approximately 5.2 percent. Such movement constitutes a significant external-sector shock and increases inflation, current-account, and monetary-policy risks, but it does not necessarily derail economic growth or produce high inflation. The ultimate effects depend on the duration of the depreciation, international oil prices, the strength of capital inflows, foreign-exchange reserve adequacy, RBI intervention, and the extent of domestic price pass-through.
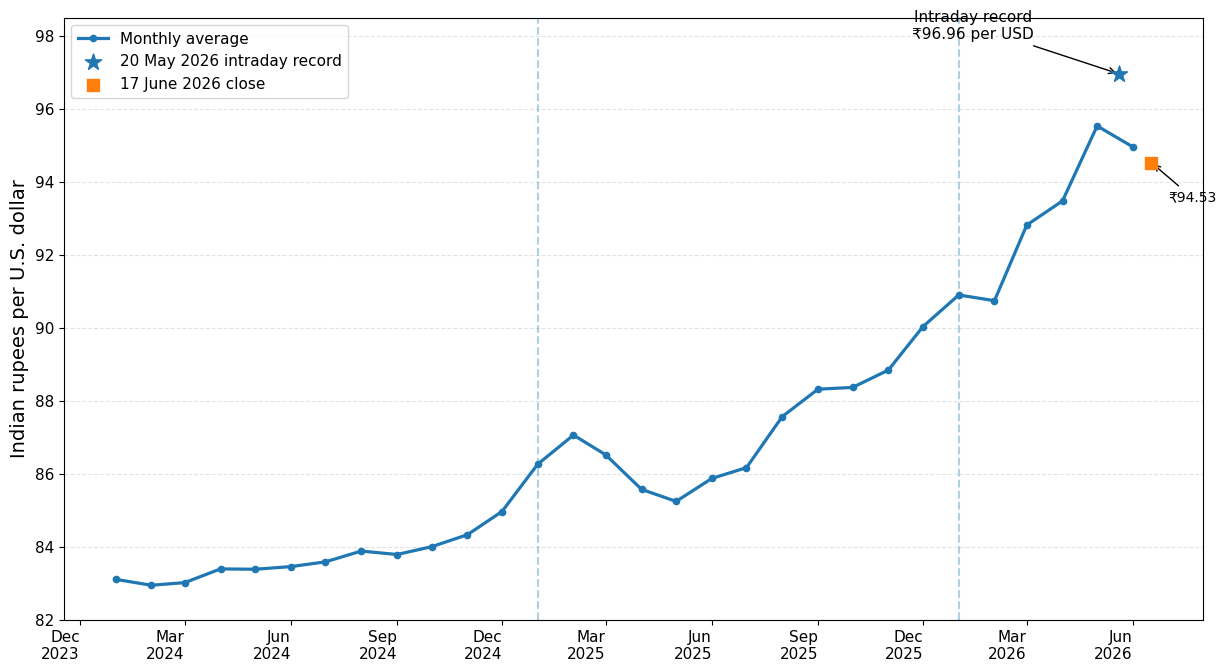 | Figure 6. Monthly Average USD/INR Exchange Rate — January 2024 to June 2026 (Source: Board of Governors of the Federal Reserve System, FRED series EXINUS. Monthly observations are averages of available daily exchange rates. The separately marked intraday record of ₹96.96 per USD on May 20, 2026, and the June 17 closing rate of ₹94.525 are reported by Reuters.) |
9. Foreign Direct Investment
9.1. Gross FDI Reaches a New Record
- On the latest RBI–DPIIT series, India received gross foreign direct investment inflows of USD 80.62 billion in FY 2024–25, an increase of approximately 13 percent from USD 71.28 billion in FY 2023–24 and more than twice the USD 36.05 billion recorded in FY 2013–14. Gross FDI subsequently increased by a further 17 percent to a record USD 94.53 billion in FY 2025–26. Consequently, cumulative gross FDI received between April 2000 and March 2026 reached approximately USD 1.166 trillion (Government of India, Ministry of Commerce and Industry, Department for Promotion of Industry and Internal Trade, 2026). The increase reflects a combination of India’s large and expanding domestic market, relatively rapid economic growth, continuing liberalization of sectoral FDI limits, greater use of the automatic approval route, improvements in physical and digital infrastructure, and multinational firms’ efforts to diversify production and supply chains. The Production Linked Incentive schemes, Make in India, improved logistics, and the development of sector-specific manufacturing ecosystems have also strengthened India’s attractiveness in electronics, automobiles, renewable energy, pharmaceuticals, and related industries. These factors should be regarded as contributing influences rather than as proof that the increase was caused by any single policy, including the PLI program. Government data also show that services, computer software and hardware, trading, and manufacturing remained important recipients of foreign investment. Gross FDI must nevertheless be interpreted carefully. It includes equity investment, reinvested earnings, intercompany debt, acquisitions, and other capital flows; it does not consist entirely of new greenfield investment or newly constructed productive capacity. The record inflow therefore indicates continuing foreign-investor engagement with India, but it cannot by itself measure the amount of new factories, infrastructure, employment, or productive capital created.
9.2. The Gross–Net FDI Divergence
- Despite strong gross inflows, India’s net FDI fell to approximately USD 0.96 billion in FY 2024–25 on the latest revised RBI series. This was slightly higher than the preliminary estimate of approximately USD 0.35 billion reported in May 2025 but remained exceptionally low in relation to gross inflows of USD 80.62 billion. Net FDI subsequently recovered to approximately USD 7.65 billion in FY 2025–26, although it remained modest relative to the record gross inflow of USD 94.53 billion (Reserve Bank of India, 2026a). The divergence arose because gross inflows were substantially offset by two categories of outflows. First, foreign investors repatriated profits and capital or divested existing holdings. Repatriation and disinvestment amounted to approximately USD 51.49 billion in FY 2024–25 and increased to approximately USD 53.58 billion in FY 2025–26. Second, Indian companies expanded their overseas operations, with outward FDI amounting to approximately USD 28.17 billion in FY 2024–25 and USD 33.29 billion in FY 2025–26. These transactions reduced net FDI even though foreign investment entering India remained substantial (Reserve Bank of India, 2026a). High repatriation and disinvestment can partly reflect the maturation of earlier investments. Foreign strategic investors and private-equity funds may sell established holdings through initial public offerings, secondary-market transactions, or sales to domestic investors after valuations have appreciated. Such exits demonstrate that investors can realize returns and redeploy capital, which is a normal feature of a developed investment market. Similarly, rising outward FDI can reflect the growing capacity of Indian multinational firms to acquire technology, markets, brands, natural resources, and production networks abroad. The decline in net FDI should therefore not be interpreted exclusively as foreign capital flight or deteriorating investor confidence.At the same time, persistently low net FDI has macroeconomic consequences. It means that direct investment provides a much smaller net source of external financing than the gross inflow figure suggests, leaving India more dependent on remittances, portfolio investment, external borrowing, and other capital flows to finance its current-account deficit and support the rupee. It may also indicate that India needs to improve the conditions that encourage foreign firms to reinvest earnings and retain capital domestically.Net FDI is therefore best interpreted as a measure of net cross-border direct-investment financing, not as a direct measure of productive capital formation. Figure 7 illustrates the substantial divergence between gross and net FDI.
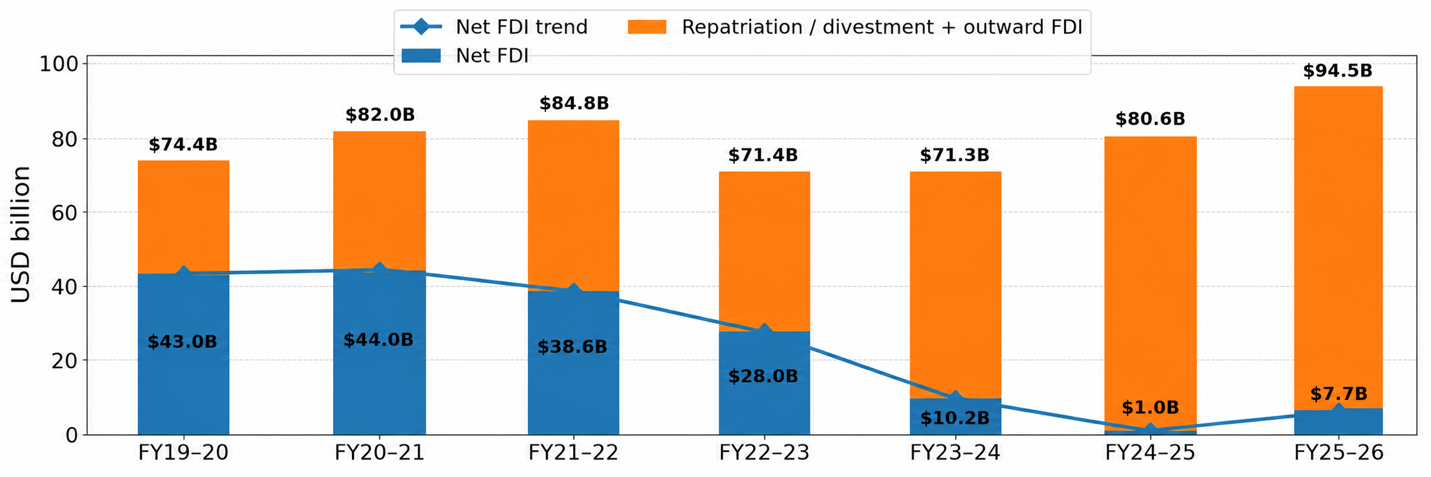 | Figure 7. India’s Gross FDI Inflows and Net FDI, FY2019–20 to FY2025–26 (Notes: (1) Net FDI = net inward FDI minus outward FDI. The upper segment is the portion of gross inflows offset by repatriation/divestment and outward FDI. (2) USD 1.0B Net FDI for FY24-25 is rounded up from USD 0.96B; other numbers have been merely rounded. Sources: Reserve Bank of India (2026a); Government of India, Ministry of Commerce and Industry, Department for Promotion of Industry and Internal Trade (2026).) |
10. Velocity of Money and Monetary Transmission
10.1. Quantity Theory Framework
- The Quantity Theory of Money provides a useful diagnostic framework, conventionally expressed in macroeconomic applications as
 And therefore,
 where
 is the money stock,
 is income velocity,
 is the price level, and
 is real output. The transactions formulation,
 is conceptually similar, but nominal GDP is generally used because the total volume of transactions is not directly observable (Fisher, 1911).In FY 2024–25, broad money (M3) grew by 9.6 percent, while nominal GDP increased by 9.8 percent. Since income velocity is measured as nominal GDP divided by the money stock, these closely matched growth rates indicate that M3 velocity remained broadly stable during the year. This does not, by itself, demonstrate that monetary easing generated real growth without inflation; output and prices were also influenced by credit conditions, fiscal policy, food supplies, energy prices, and productive capacity. By December 2025, M3 growth had accelerated to 12.1 percent, compared with 9.0 percent a year earlier, reflecting stronger deposit and bank-credit growth following monetary and liquidity easing (Government of India, Ministry of Finance, 2026c). India’s UPI-based payments system substantially reduces the time and cost of transferring funds. UPI processed approximately 21.63 billion transactions in December 2025, with a value of ₹27.97 lakh crore (National Payments Corporation of India, 2026). Digital payments improve payment-system efficiency, expand access to formal finance, and permit funds to be transferred and reused more rapidly. They should not, however, be equated automatically with higher measured monetary velocity. A rise in the number of digital transactions may reflect the replacement of cash payments, the splitting of purchases into smaller transactions, or repeated transfers of the same deposits without a corresponding increase in nominal GDP.
10.2. Credit Transmission and the EBLR
- The External Benchmark Lending Rate framework, introduced by the RBI with effect from October 1, 2019, strengthened monetary transmission by requiring all new floating-rate personal and retail loans—including housing and automobile loans—and floating-rate loans to micro and small enterprises to be linked to an external benchmark. Permitted benchmarks include the RBI repo rate, three- and six-month Treasury-bill yields, and other market rates published by the Financial Benchmarks India Private Limited. Rates linked to an external benchmark must be reset at least once every three months (Reserve Bank of India, 2019). The EBLR system therefore transmits repo-rate changes more directly and predictably than the MCLR framework, under which lending rates depend partly on banks’ marginal funding costs and change only on contractual reset dates. Transmission is nevertheless neither immediate nor complete. It varies with deposit rates, banking-system liquidity, competition, credit-risk premiums, loan spreads, and the proportion of outstanding loans still linked to older benchmarks.The RBI reduced the policy repo rate by a cumulative 125 basis points from February 2025, bringing it to 5.25 percent by December 2025. These reductions, together with cash-reserve-ratio cuts and liquidity injections, lowered borrowing costs, although by less than the full policy-rate reduction. The weighted average lending rate on fresh rupee loans declined by approximately 69 basis points, illustrating substantial but incomplete transmission (Government of India, Ministry of Finance, 2026c). Lower policy rates can also contribute to rupee depreciation by narrowing the interest-rate differential with foreign markets and reducing the relative attractiveness of rupee-denominated assets. The relationship is not direct or mechanically predictable, however. Exchange-rate movements also depend on international oil prices, the strength of the US dollar, portfolio and direct-investment flows, the trade and current-account balances, geopolitical risk, and RBI intervention. The 2025–26 depreciation of the rupee should therefore be interpreted as the result of several interacting domestic and external forces rather than as a natural consequence of repo-rate reductions alone.
11. Tourism Revenue and Global Market Position
- India’s tourism economy experienced a pronounced V-shaped recovery following the severe disruption caused by the COVID-19 pandemic. Foreign exchange earnings from tourism reached USD 35.02 billion in 2024, an increase of 8.78 percent from USD 32.19 billion in 2023. The 2024 figure exceeded the pre-pandemic level, confirming the full recovery of international tourism receipts (Government of India, Ministry of Tourism, 2025). Foreign-exchange earnings from tourism declined to USD 31.33 billion in 2025, 10.53 percent below the 2024 record of USD 35.02 billion, although still slightly above the 2019 level of USD 30.70 billion (Government of India, Ministry of Tourism, 2026).Although international tourism is an important source of foreign exchange, domestic travel remains the principal foundation of India’s tourism economy. Domestic visitor expenditure reached approximately ₹15.5 trillion in 2024, compared with international visitor spending of approximately ₹3.1 trillion. Domestic travelers therefore accounted for more than four-fifths of total visitor expenditure. When the direct, indirect, and induced effects generated throughout the tourism value chain are included, travel and tourism contributed almost ₹21 trillion to the Indian economy, equivalent to approximately 6.6 percent of GDP (World Travel & Tourism Council [WTTC], 2025). Tourism supports economic activity not only through hotels, airlines, restaurants, and travel agencies, but also through transportation, retail trade, construction, food production, cultural industries, and numerous small and medium-sized enterprises. Its large domestic base also provides a measure of stability because domestic travel is generally less exposed than international tourism to global recessions, exchange-rate fluctuations, international conflicts, and restrictions on cross-border mobility.India’s position in the international tourism market reveals an important distinction between visitor numbers and tourism earnings. In 2024, India accounted for approximately 1.40 percent of worldwide international tourist arrivals but 2.02 percent of global tourism receipts (Government of India, Ministry of Tourism, 2025). The higher share of receipts relative to arrivals suggests that international visitors to India generate comparatively high expenditure per trip. This may reflect longer average stays and the importance of relatively high-value segments such as medical, wellness, business, cultural, and specialized leisure tourism.Over the longer term, India’s share of worldwide tourism receipts increased from approximately 0.71 percent in 2004 to 2.02 percent in 2024. This expansion coincided with the international promotion of the Incredible India campaign, airport modernization, improved international air connectivity, expansion of hotel and tourism infrastructure, and the progressive introduction of electronic visa facilities. By 2019, India’s share of global tourism receipts had exceeded 2 percent, although the pandemic subsequently interrupted this upward trajectory (Government of India, Ministry of Tourism, 2025).The post-pandemic recovery was supported by the restoration of international air services, the easing of travel restrictions, renewed business and leisure travel, and continuing demand for medical and wellness tourism. By 2024, India’s share of global tourism receipts had returned to approximately 2.02 percent. International visitor spending also exceeded its previous 2019 peak, while domestic expenditure remained substantially above its pre-pandemic level (WTTC, 2025). Taken together, these trends show that India’s tourism economy is supported by two complementary forces: a very large domestic travel market that anchors sectoral activity and employment, and a growing international tourism sector that generates foreign exchange and strengthens India’s position in the global visitor economy. The relatively high share of global receipts compared with international arrivals further suggests that India has considerable potential to expand tourism earnings by attracting more visitors while continuing to develop higher-value tourism segments.
12. Import and Export Performance
- India’s combined exports of merchandise and services reached an estimated USD 860.09 billion in FY 2025–26, an increase of 4.22 percent from USD 825.26 billion in FY 2024–25. Total imports increased more rapidly, by 6.47 percent, from USD 919.92 billion to USD 979.40 billion, widening the combined trade deficit from USD 94.66 billion to USD 119.30 billion. The deterioration was concentrated in merchandise trade: goods exports increased by only 0.93 percent to USD 441.78 billion, while merchandise imports rose to USD 774.98 billion, producing a goods deficit of USD 333.19 billion. By contrast, services exports grew by an estimated 7.94 percent to USD 418.31 billion and generated a surplus of USD 213.89 billion, offsetting a substantial portion of the merchandise imbalance (Government of India, Ministry of Commerce and Industry, 2026b). India’s principal merchandise exports include engineering goods, petroleum products, electronic goods, pharmaceuticals, organic and inorganic chemicals, and gems and jewellery. Electronics have become particularly important as multinational firms diversify their production networks. Apple’s contract manufacturers assembled approximately USD 14 billion worth of iPhones in India in FY 2023–24, equivalent to about 14 percent of the company’s global iPhone production at that time (Government of India, Ministry of Finance, Department of Economic Affairs, 2024). This development demonstrates India’s capacity to participate in highly standardized, precision-dependent, and tightly scheduled global production networks. It can generate workforce skills, managerial expertise, logistics capabilities, and supplier relationships that extend beyond smartphone assembly.The significance of electronics exports should nevertheless be interpreted cautiously. Gross export values do not measure domestic value added, because many high-value components continue to be imported. The longer-term benefit will therefore depend on whether India progresses from final assembly into component manufacturing, tooling, product design, semiconductor packaging, research and development, and locally controlled intellectual property. Such movement would deepen India’s integration into global value chains and convert its present cost and scale advantages into a more durable form of dynamic comparative advantage.The conclusion of India–European Union Free Trade Agreement negotiations on January 27, 2026 represents a potentially consequential expansion of India’s trade integration. It is one of the most consequential trade agreements concluded by India although it will become legally binding only after signature and completion of the required domestic procedures. The official terms provide immediate elimination on 70.4% of tariff lines covering 90.7% of India’s export value, with broader preferential treatment covering approximately 97% of EU tariff lines and more than 99% of trade value. India’s offer covers approximately 92.1 percent of tariff lines and 97.5 percent of EU export value, with much of the liberalization phased over five, seven, or ten years (Government of India, Ministry of Commerce and Industry, 2026a). The agreement is expected to create significant opportunities for Indian textiles and apparel, leather and footwear, chemicals, marine products, gems and jewellery, selected agricultural products, processed foods, and professional and computer-related services. These gains are not automatic, however. Indian exporters must satisfy stringent European requirements relating to product quality, food safety, environmental performance, traceability, labour practices, and rules of origin. At the same time, phased tariff reductions will expose some Indian manufacturers—particularly in machinery, automobiles, chemicals, medical equipment, and premium consumer products—to stronger European competition. The agreement’s ultimate effect will therefore depend not merely on tariff reduction, but on how effectively India manages adjustment, improves productivity, supports affected workers and firms, and enables exporters to meet European regulatory standards.On the import side, dependence on foreign crude oil remains India’s principal structural vulnerability. Approximately 88 percent of India’s crude-oil requirements are imported. At recent import volumes, a sustained USD 10-per-barrel increase in crude prices could add roughly USD 15–18 billion to the annual crude-import bill before accounting for exchange-rate movements. Higher oil prices also raise freight and production costs, exert downward pressure on the rupee, widen the merchandise deficit, and can feed into domestic inflation. The exact effect varies with import volumes, refinery demand, supplier discounts, petroleum-product exports, exchange rates, and government taxation or price-smoothing measures (Petroleum Planning & Analysis Cell, 2026). India’s achievement of approximately 20 percent ethanol blending in petrol in 2025 and the continued expansion of electric mobility provide medium-term mechanisms for reducing petroleum demand. Electric vehicles accounted for approximately 8.5 percent of total vehicle registrations in FY 2025–26, with adoption concentrated mainly in two- and three-wheelers rather than passenger cars (Government of India, Ministry of Petroleum and Natural Gas, 2026; JMK Research & Analytics, 2026). These transitions will strengthen energy security over time, but they cannot rapidly eliminate oil vulnerability because petroleum remains essential to freight transport, aviation, petrochemicals, agriculture, and much of India’s existing vehicle fleet.
13. Synthesis: Monetary Management in Context
- Viewed through the prism of monetary management theory, India’s macroeconomic performance in FY 2025–26 is best described as a qualified “goldilocks” configuration rather than a stable equilibrium. Real GDP expanded by 7.7 percent (MoSPI, 2026d), while CPI inflation averaged approximately 1.7 percent during April–December 2025, largely because of a sharp moderation in food inflation (Government of India, Ministry of Finance, 2026a; MoSPI, 2025). Improvements in infrastructure, logistics, digitalization, agricultural supply, and manufacturing capacity may also have increased productive efficiency. The combination of strong growth and low inflation is therefore consistent with favorable supply conditions, although it cannot be attributed exclusively to structural reforms or the PLI programme (Government of India, Ministry of Finance, 2026a; MoSPI, 2026d). The Impossible Trinity, or Mundell–Fleming Trilemma, provides a useful framework for interpreting India’s external adjustment (Mundell, 1963). India combines monetary-policy autonomy with considerable, though still managed, international capital mobility; it therefore cannot simultaneously maintain a permanently fixed exchange rate. Under the RBI’s managed-float regime, the rupee absorbs part of the pressure generated by oil-price shocks, capital flows, and movements in the US dollar, while foreign-exchange intervention is used to limit disorderly volatility rather than defend an immutable rate. The rupee’s depreciation to record lows in 2026 illustrates this trade-off. Intervention can smooth adjustment, but its capacity is finite and it cannot indefinitely resist exchange-rate movements supported by underlying economic fundamentals.The divergence between gross and net FDI reinforces this distinction between headline capital inflows and net external financing. Gross FDI reached USD 80.62 billion in FY 2024–25, while revised net FDI amounted to approximately USD 1.0 billion. Net FDI recovered to USD 7.65 billion in FY 2025–26 but remained modest relative to gross inflows. This does not imply that foreign-financed productive capital formation was negligible: repatriation and divestment may transfer ownership without eliminating the underlying factories, businesses, employment, or productive assets. It does mean, however, that FDI supplied relatively little net balance-of-payments financing. Monetary stability therefore benefits from complementary fiscal and regulatory policies that encourage reinvestment, domestic value addition, employment creation, and technology transfer (Government of India, Ministry of Commerce and Industry, Department for Promotion of Industry and Internal Trade, 2026; Reserve Bank of India, 2026a). Figure 8 summarizes performance across eight macroeconomic dimensions. Scores were assigned using the direction of change, distance from stated policy objectives, historical performance, and macroeconomic sustainability; they are interpretive rather than statistically estimated measures. Growth, inflation control, current-account management, and fiscal consolidation generally improved, while exchange-rate stability and net FDI performance remained comparatively weak. Export performance was positive but constrained by the widening merchandise deficit, and employment outcomes continued to reflect underlying structural problems.
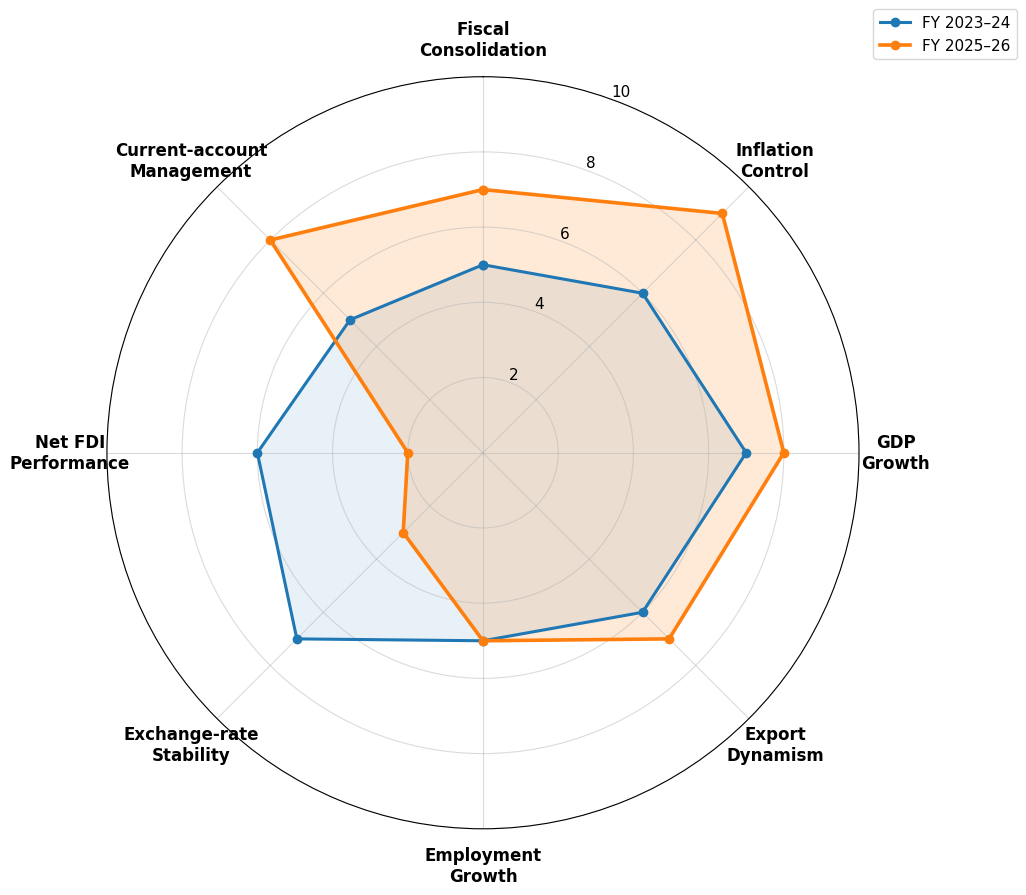 | Figure 8. India’s Macroeconomic Performance Scorecard—FY 2023–24 versus FY 2025–26 (Author-Assigned Scores, 0–10) (Source: Author’s assessment based on the macroeconomic evidence reported in this article and data from MoSPI, RBI, DPIIT, CGA, and the Ministry of Finance. FY 2025–26 scores are: fiscal consolidation, 7; inflation control, 9; GDP growth, 8; export dynamism, 7; employment growth, 5; exchange-rate stability, 3; net FDI performance, 2; and current-account management, 8. The scores are interpretive assessments and should not be characterized as official ratings.) |
14. Policy Recommendations
- The preceding analysis indicates that India’s principal policy challenge is not to maximize any single macroeconomic indicator, but to preserve rapid growth while strengthening fiscal, external, and financial resilience. The following eight recommendations address the principal vulnerabilities and opportunities identified in the analysis. Table 3 provides a structured summary.
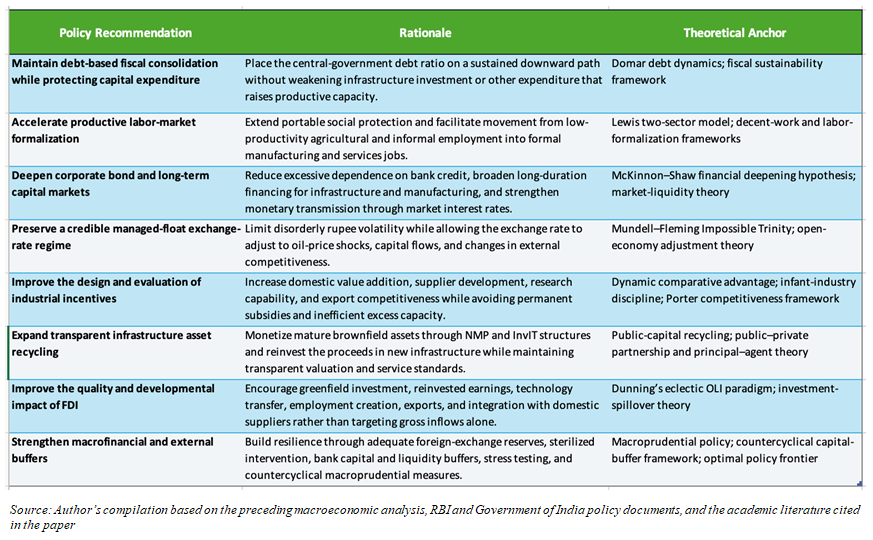 | Table 3. Policy Recommendations, Rationales, and Theoretical Anchors |
14.1. Maintain Debt-Based Fiscal Consolidation
- Fiscal consolidation should proceed within the government’s debt-reduction framework while protecting productive capital expenditure. The FY 2026–27 Budget estimates the fiscal deficit at 4.3 percent of GDP and central-government debt at 55.6 percent of GDP. Priority should be given to improving GST compliance, rationalizing poorly targeted subsidies and tax expenditures, strengthening non-tax revenues, and directing borrowing toward investments with demonstrable economic returns. A rigid fiscal-deficit target should not displace the broader objective of placing the debt-to-GDP ratio on a sustained downward path. Under the Domar framework, debt sustainability depends jointly on the primary balance, the existing debt ratio, and the relationship between nominal growth and the effective interest rate—not on a universally applicable deficit threshold (Domar, 1944; Government of India, Ministry of Finance, 2026d).
14.2. Accelerate Productive Labour-Market Formalisation
- Labour formalisation should combine portable social protection with the creation of higher-productivity employment. Greater interoperability among e-Shram, ESIC, EPFO, tax, and enterprise-registration systems would broaden coverage and reduce administrative fragmentation. Simplified compliance for smaller firms, expanded apprenticeship programs, and support for labour-intensive manufacturing and urban services would facilitate movement from low-productivity agricultural and informal employment into formal occupations. This approach is consistent with the Lewis two-sector model, under which sustained development requires the transfer of surplus labour into more productive modern-sector employment. Formal registration alone is insufficient unless it is accompanied by higher productivity, stable earnings, and access to social insurance (Government of India, Ministry of Finance, 2026b; Lewis, 1954).
14.3. Deepen Corporate Bond and Long-Term Capital Markets
- India should reduce excessive dependence on bank financing by developing deeper and more liquid corporate bond markets. Priorities include improving disclosure and credit-rating quality, strengthening insolvency and recovery processes, broadening pension and insurance fund participation, developing bond-repurchase markets, and expanding credit-enhancement mechanisms for infrastructure and established medium-sized firms. A broader institutional-investor base would increase the availability of long-duration finance and reduce the maturity mismatch created when banks finance long-lived projects with shorter-term deposits. Deeper capital markets would also strengthen monetary transmission through market yields, credit spreads, and asset-price channels, consistent with the McKinnon–Shaw financial-deepening framework (Government of India, Ministry of Finance, 2026c; McKinnon, 1973; Shaw, 1973).
14.4. Preserve a Credible Managed-Float Exchange-Rate Regime
- The RBI should continue to intervene against disorderly exchange-rate movements without defending a predetermined rupee level. Exchange-rate flexibility allows the economy to absorb changes in oil prices, global interest rates, capital flows, and external demand, while intervention can limit destabilizing short-term volatility. Reserve adequacy, deeper forward and swap markets, and wider corporate use of currency hedging would further strengthen resilience. This approach is consistent with the Mundell–Fleming trilemma: an economy seeking monetary-policy autonomy and substantial capital mobility cannot simultaneously maintain a permanently fixed exchange rate. The IMF similarly recommends exchange-rate flexibility as the first line of defense against external shocks, with intervention directed toward disorderly market conditions rather than a particular exchange-rate target (International Monetary Fund, 2025a; Mundell, 1963; Obstfeld & Rogoff, 1995).
14.5. Improve the Design and Evaluation of Industrial Incentives
- Industrial policy should emphasize domestic value addition, supplier development, technological capability, research and development, and export competitiveness rather than gross production or final assembly alone. Semiconductors, advanced-chemistry-cell batteries, solar modules, automobiles, and other strategic industries already receive dedicated government support; the priority should therefore be to evaluate existing programs rather than merely extend PLI coverage. Incentives should be conditional on measurable investment, production, export, employment, and domestic-sourcing outcomes and should contain credible sunset provisions. This would preserve fiscal discipline, limit subsidy dependence, and encourage firms to develop sustainable competitive capabilities consistent with Porter’s framework of dynamic national advantage (Government of India, Press Information Bureau, 2025; Porter, 1990).
14.6. Expand Transparent Infrastructure Asset Recycling
- NMP 2.0 and Infrastructure Investment Trust structures can release public capital tied up in mature brownfield assets and redirect it toward new infrastructure. NMP 2.0 identifies an aggregate monetization potential of ₹16.72 lakh crore over FY 2025–26 to FY 2029–30. Successful implementation requires transparent asset valuation, competitive bidding, enforceable service-quality standards, independent regulation, and clear allocation of construction, operating, and demand risks. Monetization proceeds should be transparently linked to new capacity creation rather than absorbed into routine expenditure. Asset recycling should therefore be treated as a financing and governance mechanism—not as privatization for its own sake—and evaluated by its effects on service quality, fiscal risk, maintenance, and investment (Engel, Fischer, & Galetovic, 2014; Government of India, Ministry of Finance, 2026e).
14.7. Improve the Quality and Developmental Impact of FDI
- Policy should focus on the composition and developmental effects of FDI rather than attempting to maximize gross inflows or prevent normal investor exits. India recorded gross FDI inflows of USD 94.53 billion in FY 2025–26, but the long-term benefits will depend on the extent to which investment generates greenfield capacity, reinvested earnings, domestic value addition, exports, employment, supplier integration, and technology transfer. Stable taxation, predictable regulation, reliable infrastructure, efficient industrial-land access, and stronger domestic supplier networks would encourage multinational firms to retain and expand operations in India. Outward FDI and foreign-investor divestment are not inherently adverse; the policy objective should be to strengthen India’s location-specific advantages in accordance with Dunning’s ownership–location–internalization framework (Government of India, Ministry of Commerce and Industry, Department for Promotion of Industry and Internal Trade, 2026; Dunning, 1977).
14.8. Strengthen Macrofinancial and External Buffers
- India should build resilience during favorable periods through adequate foreign-exchange reserves, prudent sterilization, strong bank-capital and liquidity positions, regular stress testing, and countercyclical macroprudential instruments. The policy repo rate should remain directed toward the inflation and growth mandate, while capital, provisioning, liquidity, and borrower-based measures address excessive leverage and financial-system risk. The countercyclical capital-buffer framework provides a mechanism for increasing bank resilience when credit conditions become excessive and releasing buffers during periods of stress. This separation of monetary and macroprudential instruments would preserve rate-setting flexibility while strengthening the financial system’s capacity to withstand commodity-price shocks, capital-flow reversals, and domestic credit-cycle downturns (Bank for International Settlements, 2010; Reserve Bank of India, 2026b).
15. Conclusions
- India’s macroeconomic landscape in FY 2025–26 combines exceptional promise with persistent structural fragility. Several indicators remain favourable, including real GDP growth, relatively low inflation, a narrowing fiscal deficit, a manageable current-account deficit, comparatively low headline unemployment, and strong investment momentum. Real GDP expanded by 7.7 percent, CPI inflation fell to a series low of 0.25 percent in October 2025, the current account recorded a USD 7.1 billion surplus in Q4, and monetary policy delivered 125 basis points of easing without destabilising expectations. Record gross FDI inflows of USD 94.53 billion and estimated services exports of USD 418.31 billion further demonstrate India’s deepening integration into the global economy.At the same time, the rupee’s movement toward ₹97 per US dollar, net FDI of only USD 0.96 billion in FY 2024–25 and USD 7.65 billion in FY 2025–26, persistent labour-market duality, incomplete fiscal consolidation, and a widening merchandise trade deficit expose the economy to recurring vulnerabilities. These are not merely cyclical disturbances but structural constraints requiring sustained and coordinated policy attention.The monetary-management framework provides the article’s integrating analytical lens. The RBI’s symmetric inflation targeting, active liquidity management, improved transmission through the EBLR system, and exchange-rate smoothing enabled it to navigate a complex easing cycle while preserving policy credibility. The next stage will require complementary fiscal, regulatory, and structural reforms that deepen capital markets, promote productive labour formalisation, diversify exports, strengthen domestic value addition, and encourage the reinvestment of foreign capital. Effective implementation of this agenda would materially improve India’s prospects for sustaining rapid real GDP growth within an environment of price stability and manageable external imbalance. India’s macroeconomic trajectory therefore represents one of the most consequential contemporary applications of monetary-management theory, with implications extending well beyond its 1.4 billion citizens.
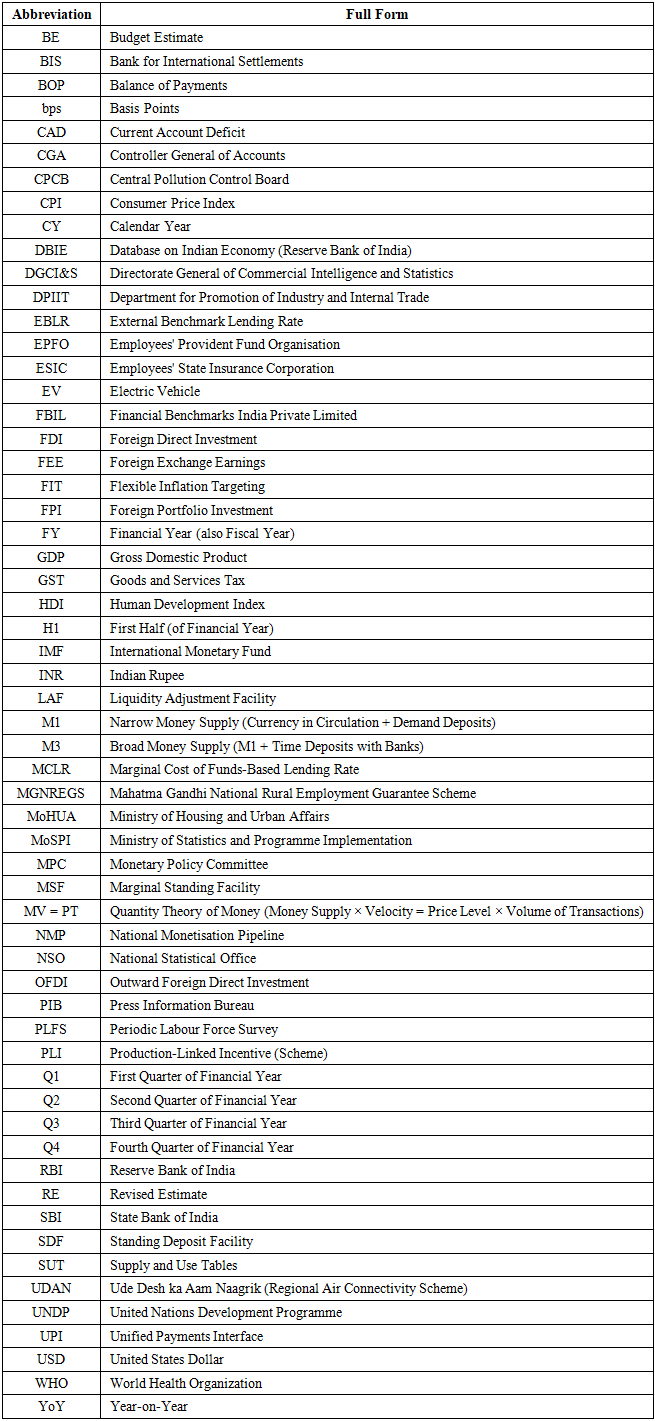
16. Nomenclature
- All abbreviations and short forms used in this article, along with their full forms, are listed below:
Declarations
- • The authors have no relevant financial or non-financial interests to disclose.• The authors did not receive support from any organization for the submitted work.
Note
- 1. The Government sets a medium-term debt path toward 50 +/- 1% of GDP by FY 2030-31.