-
Paper Information
- Paper Submission
-
Journal Information
- About This Journal
- Editorial Board
- Current Issue
- Archive
- Author Guidelines
- Contact Us
Microeconomics and Macroeconomics
p-ISSN: 2168-457X e-ISSN: 2168-4588
2021; 9(1): 1-6
doi:10.5923/j.m2economics.20210901.01
Received: Dec. 10, 2020; Accepted: Jan. 6, 2021; Published: Jan. 15, 2021

Analysis of the Sectoral Causes of Inflation in Côte d'Ivoire: An Approach Using Leontief's Input-Output Multipliers
 Abstract
 Reference
 Full-Text PDF
 Full-text HTML
Makaye Gongbé Blaise
UFR SED, Alassane Ouattara University, Bouaké, Researcher at the Laboratory of Analysis and Modeling of Economic Policies (LAMPE), CRD, Alassane Ouattara University, Abidjan, Ivory Coast
Correspondence to: Makaye Gongbé Blaise , UFR SED, Alassane Ouattara University, Bouaké, Researcher at the Laboratory of Analysis and Modeling of Economic Policies (LAMPE), CRD, Alassane Ouattara University, Abidjan, Ivory Coast.
| Email: |  |
Copyright © 2021 The Author(s). Published by Scientific & Academic Publishing.
This work is licensed under the Creative Commons Attribution International License (CC BY).
http://creativecommons.org/licenses/by/4.0/

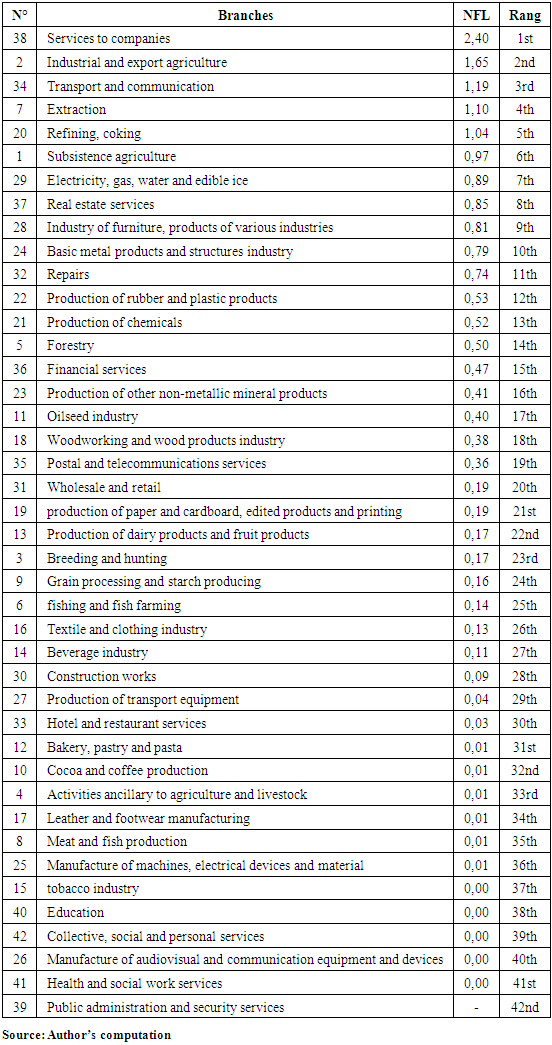
This article analyzes the sectoral channels of inflation in Côte d'Ivoire, using net input-output price multipliers of Leontief. The results show that the eight branches which propagate the most inflation in Côte d'Ivoire are respectively, in decreasing order of degree of net downstream interdependence, the branches the following branches: (38) Business services, (2) Industrial and export agriculture, (34) Transport and communication, (7) extraction industry, (20) refining and coking industry, (1) Food crops, (29) Electricity, gas, water and food ice and (37) Real estate services. These results can be explained by the strong dependence of the other branches of the economy on these eight branches in terms of intermediate consumption. Price regulators should pay more attention to the evolution of factor costs in these branches, because an increase in the prices of their outputs can generate a higher level of inflation, compared to other branches of the economy.
Keywords: Price, Input-Output, Forward linkage
Cite this paper: Makaye Gongbé Blaise , Analysis of the Sectoral Causes of Inflation in Côte d'Ivoire: An Approach Using Leontief's Input-Output Multipliers, Microeconomics and Macroeconomics, Vol. 9 No. 1, 2021, pp. 1-6. doi: 10.5923/j.m2economics.20210901.01.
Article Outline
1. Introduction
- One of the main objectives of economic policies is a low level of inflation (Mankiw, 2010: 427). This is particularly the case in the West African Economic and Monetary Union where the convergence pact requires member states to have an inflation rate of at most 3%. Theoretically, inflation in itself is not bad for the economy. Indeed, the supply of companies being an increasing function of the price, an increase in the latter, ceteris paribus, should encourage companies to increase their production, and to hire more workers. And this results in an increase of national production. On the other hand, a zero level of inflation could be bad for the economy insofar as companies would not be encouraged to hire in such a situation (see the Philips curve). However, above a certain level of inflation, the purchasing power of households can drop to a level which can lead to the insolvency of the latter. Under these conditions inflation can be harmful to the economy. To this must be added the different costs of inflation when it is anticipated (less pernicious) and unanticipated (more pernicious) (Mankiw, 2010: 147-150). It is these social costs that push the authorities to control the rate of inflation. The authorities thus determine the threshold inflation rate, which allows companies to continue to hire, without significantly deteriorating purchasing power.It is in this context that this article attempts to understand the channels of transmission of inflation in Côte d’Ivoire Economy. In theory, depending on the type and context of the economies concerned, inflation can result from a bundle of causes which can each act separately or in combination. The monetary theory shows that an excessive increase in the money supply can cause inflation; a demand greater than the supply of available goods and services can create inflation; rising prices of imported goods and / or raw materials can cause inflation; increase in production costs (wages vs. productivity, raw materials, energy) can cause inflation; structural increases caused by lack of competition and administered prices can cause inflation. The inflation can also be caused by anticipation phenomena. In this paper, we analysis the inflation through an increase in production costs for Côte d'Ivoire economy, using a sectorial approach, precisely from the measurement of the downstream interdependence of the industries (or branches) of the Ivorian economy. This choice is motivated by the lack of this kind of studies for Côte d’Ivoire. It is therefore a question of how inflation diffuses in the economy, and what roles each industry plays in relation to its links with other industries of the economy. To do this, we use Leontief's input-output price model to estimate the price-multipliers (which is a measure of downstream interdependence) of each branch. Knowing these interindustrial links (downstream interconnection or price multipliers) not only helps to understand the mechanism of cost inflation in Côte d'Ivoire, and therefore to identify sensitive branches, whose rise in product prices can be more disastrous in terms of the level and diffusion of inflation in Côte d'Ivoire, compared to other branches of the economy. The remainder of this paper is organized as follows: section 2 presents the method used, section 3 presents and interprets the results. Finally we end with a brief conclusion in section 4.
2. Methodology and Data
- In the empirical literature, one of the most widely used methods for measuring industrial interdependencies is Input-Output (IO) analysis, the father of which is Wassily Leontief (see Duchin and Lange (1995), Dietzenbacher and Velazquez (2007)). Stone (1961) defines IO analysis as "a means of describing and analyzing the productive process of an entire economic system". The IO model is built from a symmetrical Input-Output table.
2.1. Data
- To build the Input-Output model of prices, we use an Input-Output table constructed by Makayé (2017) for the Côte d'Ivoire economy, from the Make and Use Table of 2012. This is an Input-Output table for the year 2012, industry * industry, model D of the Eurostat methodological manual (2008), at constant price, with a distinction between the Input-Output table for domestic production and the Input-Output table of imports, and comprising 42 branches. From an empirical point of view, model D appears to be the most adequate for the kind of problem that we are addressing here, due to its transparency and its comparability with national historical data. The reader will find the theoretical and technological assumptions as well as all the technical details of the construction of the table in Blair and Miller (2009) and the Eurostat manual of Input-Output (2008). The last constant price Input-output table for the Côte d’Ivoire economy is the one we have built in Aka et al. (2020), for the year 2013, but it is still at current price. The Make and Use Tables take a delay of at least five year to be constructed by national accounting services as it can be observed in many African countries. But while structural changes in an economy take many years to occur, the 2012 Input-Output can be used for present studies. We can se this in Llop (2020) who used data for the year 2011 in an Input-Output price model to study energy import costs in Spain.
2.2. Input-Output Price Multipliers
- The IO price multipliers are obtained using the Leontief price model. We assume in this model that in the short run, the structure of the inputs is fixed, the returns are constant, and the quantities are fixed so that a variation in prices does not lead to a substitution effect (Mc Lennan, 2006). The model is based on the fundamental identity of the Input-Output analysis, reasoning on the columns of the IO table. Thus, the production of each branch is obtained by summing its intermediate consumption and its added value:
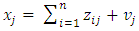 | (1) |
 = branch production j,
  = he intermediate sale from branch i to branch j, and
  = value added of the branch j; i=1,2, …n; and n= number of branches in the IO table.By writing (1) in matrix form we obtain:
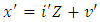 | (2) |
 = row vector of productions by branch;
  = row vector whose elements are all the number 1 and therefore
  = row vector made up of the sum of intermediate purchases by branch, and
  = the row vector of value added by branch.We can transform (2) by dividing each term by the corresponding element of the vector
  . We obtain:
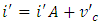 | (3) |
 = the primary input price vector (or the productivity or remuneration of primary inputs).We can notice that (3) shows that the prices of goods and services in the base year are equal to the sum of the prices of intermediate inputs and the prices of primary inputs. And the price of each product is equal to the unit in the base year.If we call P the price vector of the base year, then we have:
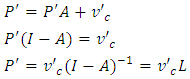 | (4) |
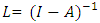 known as the inverse of Leontief.In practice, model (4) is used in its transposed form to obtain column vectors instead of row vectors. We obtain after transformation:
 | (5) |
 known as the Allocation Matrix
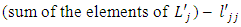
 represents the variation in the price of output in sector i following a unit variation in the prices of primary inputs in branch j. The sum of the elements on the columns
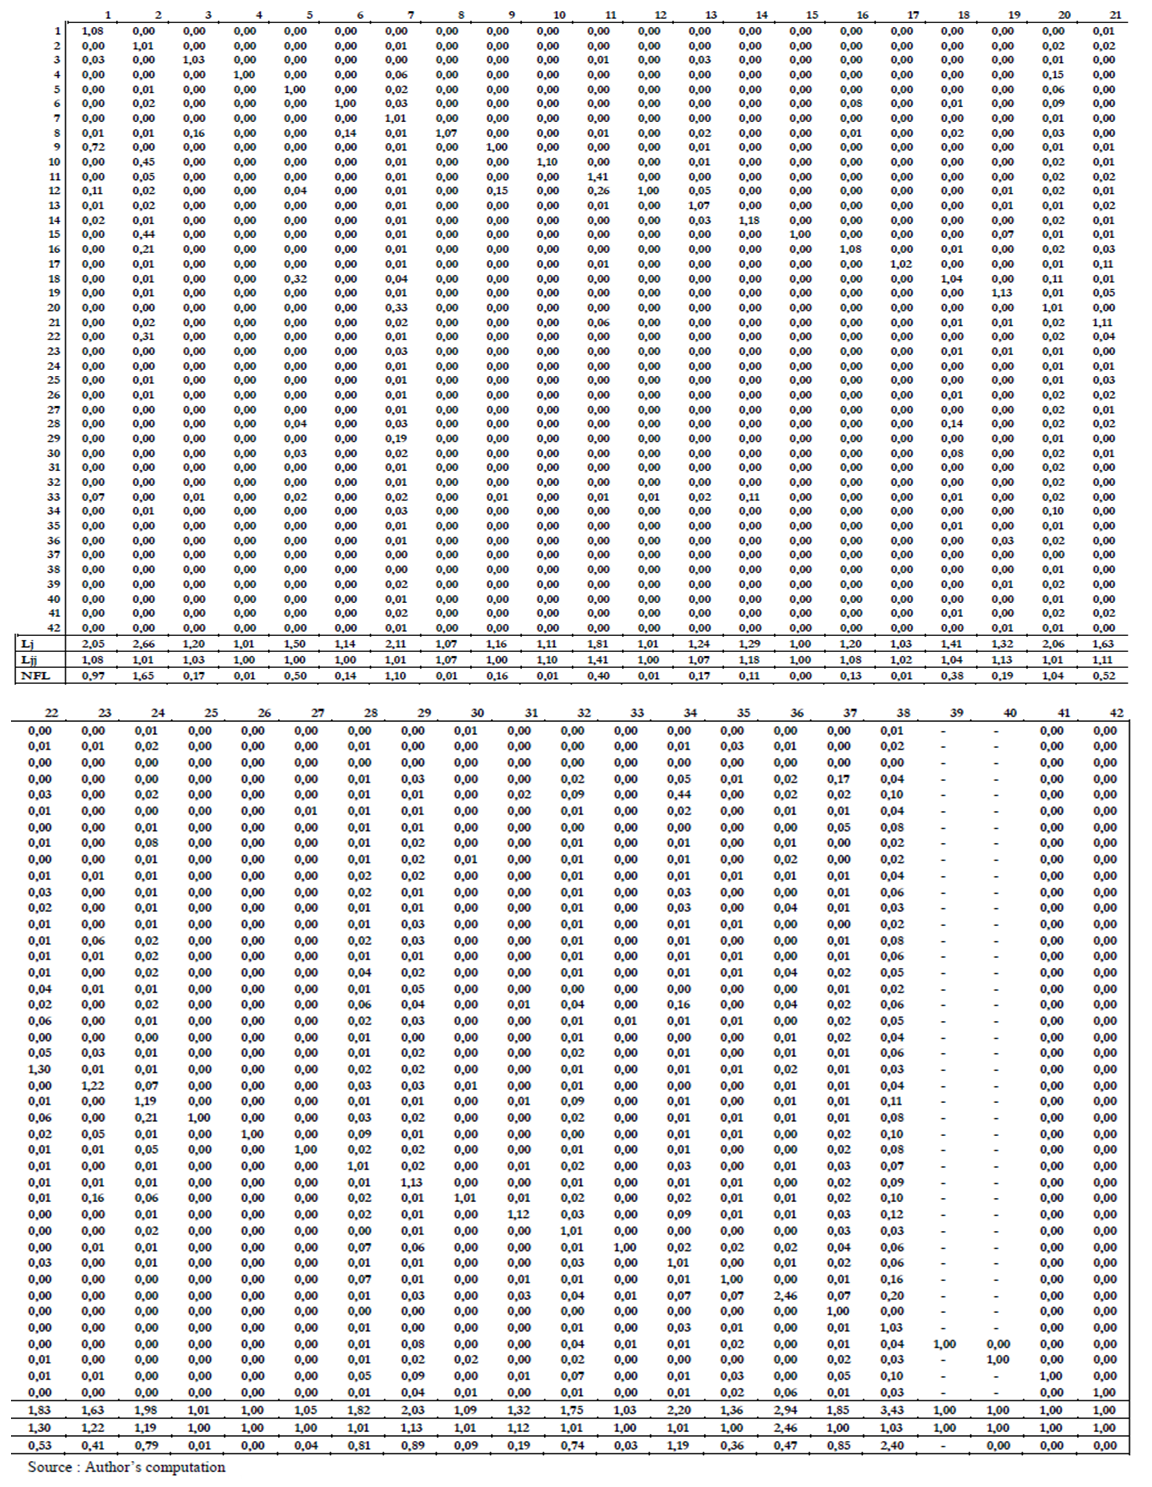
  represents the price multiplier of the output of branch j, that is, the total effect of a unit change in the price of primary inputs of branch j on the prices of domestic output. We will use the net multiplier in the sense of Leontief (1951) to measure the net downstream interconnection (Net forward linkage). According to Leontief, the elements of the main diagonal should be removed in order to capture the interconnection between the branches, and to make reliable comparisons of the branches according to their degree of training.Let NFL =
 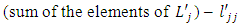 Then equation (6) makes it possible to measure the effects of the variation in the price of primary inputs (or factor costs), on the price of domestic production:
 | (6) |
3. Results
- Table 1 ranks the branches in descending order of price multiplier. The value of NFL (Net forward Linkage) of the first line means that an increase in factor costs in the branch (38) "Business services" by 10% leads to an average increase in the prices of products from other branches of activity by 24%. The distribution of this price increase is given in the inverse Leontief matrix (see appendix). The interpretation is the same for the other branches of Table 1.NFL =
|
4. Conclusions
- This article has analyzed the sectoral causes of inflation in Côte d'Ivoire, using net input-output prices multipliers of Leontief. The results show that the eight branches which propagate the most inflation in Côte d'Ivoire are respectively, in decreasing order of degree of net downstream interdependence, the branches the following branches: (38) Business services, (2) Industrial and export agriculture, (34) Transport and communication, (7) extraction industry, (20) refining and coking industry, (1) Food crops, (29) Electricity, gas, water and food ice and (37) Real estate services. These results can be explained by the strong dependence of the other branches of the economy on these eight branches in terms of intermediate consumption. Price regulators should pay more attention to the evolution of factor costs in these branches, because an increase in the prices of their outputs can generate a higher level of inflation, compared to other branches of the economy. Thus, policies aimed at stabilizing the prices of products in these branches could help stabilize prices in the Ivory Coast. The results of this paper must be taken with prudence because of the hypothesis of fixity of the technical coefficients of the model. Change in these coefficients will result in change in the results, even if changes in the economy structure are due to major innovation, and innovations take many year to occur.
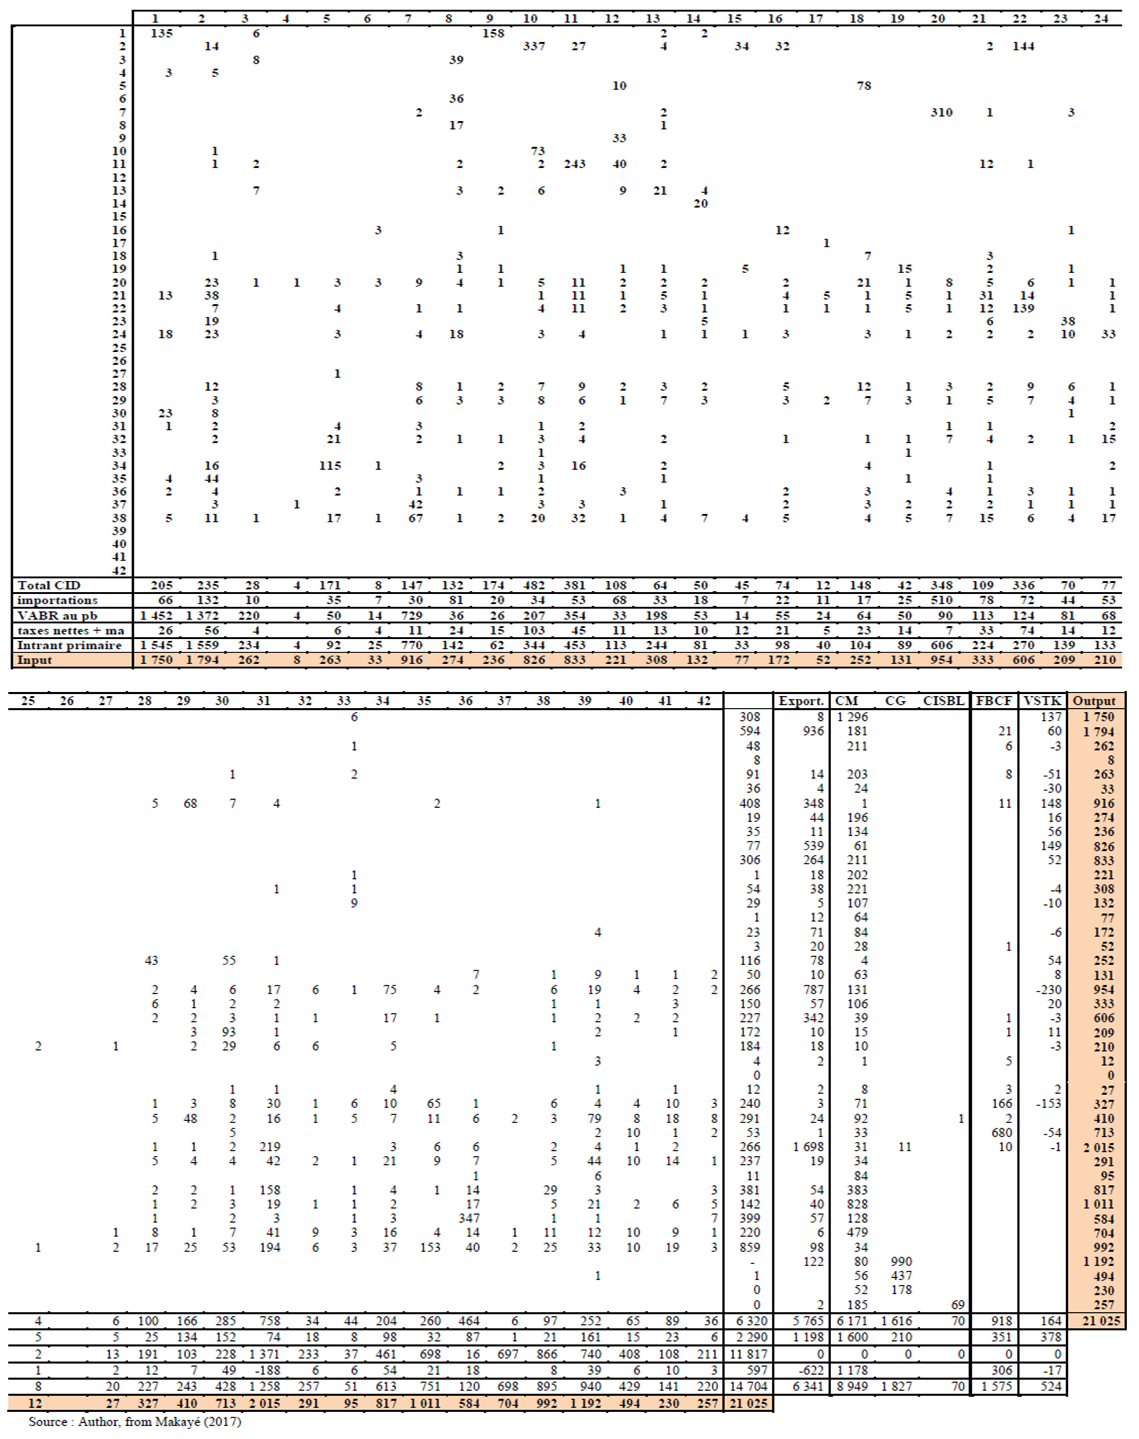 | Table 2. Input-Output table industry by industry, at basic price, in billion CFA constant, Côte d'Ivoire 2012, Model D of the Eurostat manual (2008) |
Appendix: Transpose of the inverse Leontief matrix (L’)
 | Transpose of the inverse Leontief matrix (L’) |