-
Paper Information
- Paper Submission
-
Journal Information
- About This Journal
- Editorial Board
- Current Issue
- Archive
- Author Guidelines
- Contact Us
Microeconomics and Macroeconomics
p-ISSN: 2168-457X e-ISSN: 2168-4588
2018; 6(3): 55-66
doi:10.5923/j.m2economics.20180603.01

Monetary Policy Transmission in Nigeria: How Important is Asset Prices Channel?1
 Abstract
 Reference
 Full-Text PDF
 Full-text HTML
Adekunle P. A., Baba N. Yaaba, Stephen S. A., Ogbuehi F., Idris A., Zivoshiya P. B.
Department of Statistics, Central Bank of Nigeria, Abuja, Abuja, Nigeria
Correspondence to: Baba N. Yaaba, Department of Statistics, Central Bank of Nigeria, Abuja, Abuja, Nigeria.
| Email: |  |
Copyright © 2018 The Author(s). Published by Scientific & Academic Publishing.
This work is licensed under the Creative Commons Attribution International License (CC BY).
http://creativecommons.org/licenses/by/4.0/

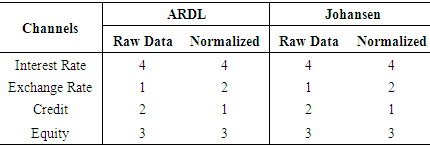
Using a multi-model approach including Johansen and Autoregressive Distributed Lag (ARDL) techniques, the study assesses the prevalence of the channels of monetary policy transmission mechanism in Nigeria to determine the position of asset prices channel with emphasis on equity channel of Monetary Policy Transmission Mechanism (MPTM). The study covers all the four prominent channels of MPTM in Nigeria – Interest rate, exchange rate, credit and equity channels – over the period 1985Q1 to 2017Q4. The data was used from two perspectives: raw and normalized data such that four set of regressions were carried out and the best model determined based on the one that yield the lowest information criteria. Overall, the results return exchange rate channel as the most prevalent, while equity channel occupies third position. Consequently, the study suggests close monitoring of the market by the Central Bank of Nigeria (CBN) so as to be able to take proactive policy decisions since disruption in the market is likely to affect the general price level which is the primary mandate of the CBN.
Keywords: ARDL, Johansen, Monetary Policy Transmission Mechanism
Cite this paper: Adekunle P. A., Baba N. Yaaba, Stephen S. A., Ogbuehi F., Idris A., Zivoshiya P. B., Monetary Policy Transmission in Nigeria: How Important is Asset Prices Channel?1, Microeconomics and Macroeconomics, Vol. 6 No. 3, 2018, pp. 55-66. doi: 10.5923/j.m2economics.20180603.01.
Article Outline
1. Introduction
- The primary instrument of price stability-oriented monetary policy is interest rate; hence the traditional interest rate channel is recognized by most economists as the most effective channel of monetary policy transmission (MPT). Changes in interest rate ceteris paribus do have some level of impact on output and the general price level. Evolving economic theory and recent development experience has however revealed other transmission channels through which the level of economic activity and prices can also be affected. Assets prices channel is increasingly gaining recognition as important means for the realization of monetary policy goals considering their role as a component or mechanism of monetary policy transmission. Economic theory had long recognized asset prices as one of the critical indicators of financial equilibrium2, of which any disruption distort the market leading to systemic crisis.More so, a consensus is gradually emerging that the long-run objective of price and financial stability are mutually supportive. Stability in the general price level reduces speculative activities in the asset market, which in-turn stabilizes prices and consequently strengthens the stability in the overall financial system. In another dimension, monetary policy decisions geared through the traditional interest rate channel affects households. Higher interest rate, for instance, can serve as an incentive to lower equity prices, which in-turn results to fall in financial wealth and by implication fall in aggregate investment and consumption spending. Asset prices can therefore play a significant role in monetary policy not only as a channel of MPT but also as an important indicator of future expectations through the provision of vital signals about price stability related risks which is the ultimate goal of Monetary Policy (MP). The value of assets is also generally agreed to be one of the critical determinants of the balance sheets of financial intermediaries and to some extent influence their appetite for risk. Asset prices identifiable in monetary economics include; exchange rate, share/equity prices and property prices3. Considering the essential and evolving roles of asset prices, there is the strong need to examine on continuous basis not only the potency of the channel but also the changing pattern of its effect as MPTM in order to enable monetary authorities take proactive policy actions. This study is therefore an attempt to determine the prevalence of asset prices channel of MPTM in Nigeria with a view to guide monetary authority in taking monetary policy decision. Asset prices are best proxy by property prices in developing countries including Nigeria due to under developed equity market arising in some cases to low participation. However, due to absence of data on property prices, the study uses equity prices to represent the channel.To achieve the objective, the study is divided into five sections including this brief introduction. Section two reflects on the theoretical foundation of monetary policy transmission mechanism and relevant empirical literatures, while section three details the methodologies. Section four discusses the result and section five concludes and proffers some policy actions.
2. Literature Review
2.1. Theoretical Foundation
- Monetary policy is generally believed to have significant impact on financing conditions of the economy. Besides its effect on the cost of capital, it also impact on the credit creation capability of banks through availability or otherwise of loanable funds as well as reshape banks appetite for specific risks. Monetary policy changes agents’ expectations about the level of economic activities, the probable level of general prices as well as the pattern of consumption and investment. For instance, downward adjustments in the cost of borrowing increase both consumption and investment spending, which can be achieved with accommodative monetary policy arising from reduction in interest rate. The knowledge of the stance of monetary policy helps in the formation of expectations about the strength of economic activities. This is capable in prompting banks to ease/tighten their lending policy, which improves/worsens spending by both the households and firms. Easing or tightening of lending policies brings about low/high interest rate, which in turn leads to decline/increase in savings capable of attracting/distracting investors to/from the stock market.At the heart of this study are the theories that characterize the channel which affects asset prices, namely: exchange rate and equities channels of monetary policy transmission mechanisms.
2.1.1. Exchange Rate Channel of Monetary Policy Transmission
- The view on exchange rate channel of monetary policy transmission takes two dimensions, following Loayza and Hebbel (2002), namely: aggregate demand and aggregate supply effects. The aggregate demand effect occurs when the domestic real interest rates falls in an accommodative monetary policy environment and the fall induce higher net-exports which in turns strengthens aggregate demand but triggers domestic currency depreciation. Aggregate supply effect, on the other hand occurs when expansionary monetary policy raises the domestic prices of imported goods through real depreciation of the domestic currency, which directly affects inflation. In other words, the higher price of imported intermediary goods reduces aggregate supply through decline in the level of input thereby affects outputs, hence prices increase. More so, higher prices of imported finished goods arising from depreciation in the value of the domestic currency affects aggregate demand through higher prices of goods in the domestic economy (see Yaaba, 2018 for more details).Monetary policy transmission through exchange rate channel however largely depends on the exchange rate regime. In a free floating regime, monetary policy shocks are fairly easily transmitted when compared to a fixed regime. According to Mishkin (1996) and Loayza and Hebbel (2002), monetary sector is often adjusted to support fixed exchange rate and this is schematically presented as:
 From S1, accommodative monetary policy (M
  ) leads to fall in domestic interest rate (ir
  ), which triggers domestic currency depreciation (E
  ), that could culminate in rise in net-exports (NX
  ) and consequently increase in aggregate output (Y
 ).
).2.1.2. Equity Channel of Monetary Policy Transmission
- There are two critical channels, relevant to this paper that can be identified under the equities channel of monetary policy transmission. These are: investment effect and wealth effect on consumption.Investment EffectThe investment effect can be viewed from the perspective of Tobin’s q theory of investment which explains a mechanism that transmits the effect of monetary policy to other sectors of the economy through its impact on the assessment of equities (Tobin 1969). Tobin proposed the general equilibrium theory (popularly referred to as Tobin ‘q’ or ‘q’ theory). The theory is defined as:
 | (1) |
 From S2, as monetary policy becomes liberal (M
  ), equity prices rises (Pe
  ) leading to increase in q (q
  ) through increase in investment (I
  ) and consequently aggregate output increases (Y
  ).Wealth EffectsAndo and Modigliani (1963), ‘Life Cycle Hypothesis’ hypothesized that individual consumption decisions are based not only on current income but also on the life time savings which includes human capital, real capital and financial wealth. The hypothesis contends that individuals build assets at their working ages to rely on at retirement. These assets include financial wealth comprising mostly of common stocks. Mathematically, the working of ‘Life Cycle Hypothesis’ can be illustrated as:
 | (2) |
 | (3) |
 | (4) |
 | (5) |
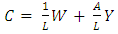
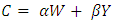
 The schematic representation S3 indicates that” as monetary policy becomes accommodative (M
 ), equity prices (P
 ) rises leading to increase in wealth (W
 ) of the consumer which further raises the aggregate consumption (C
 ) and aggregate output (Y
 ) and vise vasa.
2.2. Review of Empirical Literature
- Hung (2007) using seasonally adjusted quarterly data for Vietnam from 1996Q1 to 2005Q4 applied Vector Autoregression (VAR), impulse response function, Granger causality test and variance decomposition to evaluate the effect of monetary shocks on output. The results return credit and exchange rate channels as the most effective channel in transmitting monetary shocks to real sector of the economy during the study period.In their effort to evaluate the monetary policy transmission mechanism for Nigeria, Adenekan and Ahortor (2010) employ VAR on Nigerian data spanning 2000 through 2009 and found that credit, interest rate and exchange rate channels are weak in transmitting monetary policy shocks to the other sectors of the economy, reflecting weak and shallow financial system. They submitted that Central Bank of Nigeria is far more focused on price stability than growth generation.Yang, Davies, Wang, Dunn and Wu (2011) applying autoregressive distributed lag (ARDL) approach on data from 2000 to 2009, assess the interest rate and credit pass-through after the global financial crisis of 2007/08 of the Pacific Island countries including Fiji, PNG, Samoa, Solomon Islands, Tonga and Yanuatu. The study finds that monetary policy transmission was weak during the study period probably due to weak credit demand and under-developed financial markets. They therefore highlighted the importance of a highly deepened financial market as well as proper coordination of macroeconomic policies and tools with emphasis on exchange rate flexibility.Onyemachi and Lezaasi (2012) examine the bank’s assets channels of monetary policy transmission for Nigeria as well as determine the direction of causality among the instruments of monetary policy. The study applied co-integration and error correction model on Nigeria annual data from 1970 to 2010 within the context of a Keynesian framework. The results conformed to the theoretical expectation, as bank’s assets channels (BKA) and money supply (MNS) returns positive and significant coefficients. The Granger causality test shows a unidirectional causality between BKA and MNS as well as cash reserve ratio and money supply. Nwosa and Sabi (2012) apply unrestricted vector autoregression model on Nigeria quarterly data from 1986Q1 to 2009Q4, to examine the monetary policy transmission mechanism for Nigeria. The result shows that interest rate channel is the most effective monetary policy transmission channel especially to Agriculture and Manufacturing sectors, while exchange rate channel proves to be the most effective to building/construction, mining, services and wholesale/retail sectors.Abaenewe and Ndugbu (2012) assess the impact of monetary policy rates on equity prices on the Nigeria stock market. The study adopted ordinary least square (OLS) on five different monetary policy instruments including minimum rediscount rate, treasury bill rate, interest rate and exchange rate using annual data from 1985-2010. The result shows that all the variables are insignificant. The study therefore conclude that equities market do not effectively respond to monetary policy decisions. It therefore, recommends that monetary authority should effectively align their monetary policy decision to equity market activities so as not only to boost investment but to also enhance price stability. Davoodi, Dixit and Pinter (2013) adopted a multi model approach to assess the efficacy of the channel of monetary policy transmission for countries of East African Community which includes Kenya, Tanzania, Uganda, Rwanda and Burundi. The technique used in the study covers Recursive Structural VAR, Bayesian VAR and Factor Augmented VAR. the empirical result, in a nutshell; show a mixed results as different techniques yield different results. For instance, the monetary transmission mechanism is generally weak for all the study countries when standard statistical technique is adopted but the reverse when non- standard statistical technique is used. Overall the study submits that the relative importance of transmission mechanism varies across countries.Bernhard (2013) in an attempt to determine the most effective transmission channel for monetary policy in Nigeria applies Granger causality test on three transmission channels and some selected macroeconomic aggregates. The study utilizes annual data from 1970 to 2011 and found that interest rate has the strongest impact. The study concludes that only three channels are functional i.e. interest rate, exchange rate and the credit channels. They recommend that the three channels should form the basis for inflation targeting. Williams and Robinson (2014) evaluate the impact of monetary policy shocks on macroeconomic variables including the level of economic activities, inflation, money & credit, Treasury bill rates and equity prices. The study utilized quarterly data from 1998Q1 to 2013Q1. The results show that changes in interest rate impacted positively on inflation. The study thus suggests the need to strengthen the credit channel of monetary policy prior to the country’s transition to full-fledged inflation targeting. Ngozi and Eugene (2015) test the strongest and most dominant monetary policy transmission channels to monetary shock using a combination of FAVAR and traditional VAR. The study utilized quarterly data from 1970 to 2013. The results show that interest rates and credit channel are the leading channels for monetary policy transmission mechanism in Nigeria. It recommends that interest rate and credit channels should be improved upon by central bank so as to improve their efficiency in the conduct of monetary policy to enhance economic growth.Frances and Eugene (2015) investigate the effectiveness and dominance of the channels of monetary policy by applying FAVAR on 53 different variables from the first quarter of 1970 through the last quarter of 2013. The results show that interest rate and credit channels are the dominant and most effective monetary policy transmission channels in Nigeria, followed by Exchange rate channel. Thus, recommend that Central Bank of Nigeria (CBN) should rely more on these channels as policy variables in the conduct of monetary policy. Bungin, Reljic and Ivkovic (2015) adopted an unrestricted VAR to determine the significance of exchange and interest rate channels of monetary policy transmission mechanism for Serbia using monthly data from 2007:01 to 2014:12. The results reveal that although interest rate plays a role but exchange rate channel has the strongest effect on inflation in the country during the study period.In an attempt to determine the relative importance of the channels of monetary policy transmission in Poland, Kapuscinski, et. al (2015) applied SVAR on Polish data from January 2001 to March 2015. They found that there was a sharp decline in the relevance of exchange rate channel in transmitting monetary shocks to other sectors of the economy hence exchange rate channel, according to the authors, was relatively weaker and less effective during the study period. They attributed the weakening of the channel to variations in the production process arising from massive entry of international enterprises. They concluded that movement in inflation was largely a function of interest rate channel which turn-out to be the strongest.
3. Methodology and Data Issues
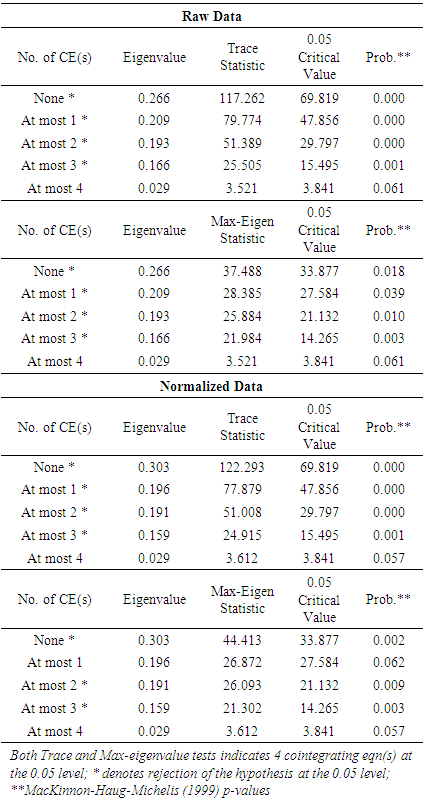
3.1. Johansen Cointegration Test
- Johansen methodology as contained in Vector Autoregression (VAR) of order ρ is obtained from:
 | (10) |
 | (11) |
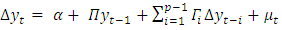
 With reduced rank of coefficient matrix Π, r < n, and nXr matrices of α and β each with rank r will ensue such that Π = αβ’ and β’yt is stationary. In this case r is the number of the cointegrating relationships, while α is the adjustment parameters in the vector error correction model (VECM), each column of β is a cointegrating vector. For any given number of the cointegrating relationships (r), the maximum likelihood of estimator of β is an indication of a combination of change in yt (Δyt) such that yt-1 will correct for lagged differences and deterministic variables if present. Two different likelihood ratio tests of the significance of the relationships are available for Johansen as well as the reduced rank of the Π matrix, namely: the trace test and maximum Eigen value test. These tests are presented as equations 12 and 13, respectively.
 | (12) |
 | (13) |
 is the i’th largest canonical correlation. The maximum eigenvalue tests the null hypothesis of r cointegrating vectors against alternative hypothesis of r +1 cointegrating vectors.In other words, the decision rules upon which to accept or not, the existence of long run relationship between variables is that the TRACE statistics value and their respective critical values are at an appropriate level of significance. If TRACE statistics value is greater than the critical value, the null hypothesis is rejected. On the other hand, if TRACE statistics value is less than the critical value, the null hypothesis is not rejected. The hypothesis indicates the number of cointegrating equations.
3.2. Autoregressive Distributed Lag Approach
- Following Pesaran, Shin and Smith (2001), the autoregressive distributed lag (ARDL) approach to Cointegration is formulated as:
 | (14) |
 | (15) |
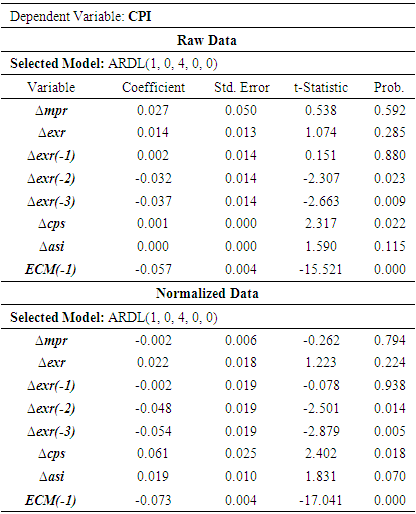
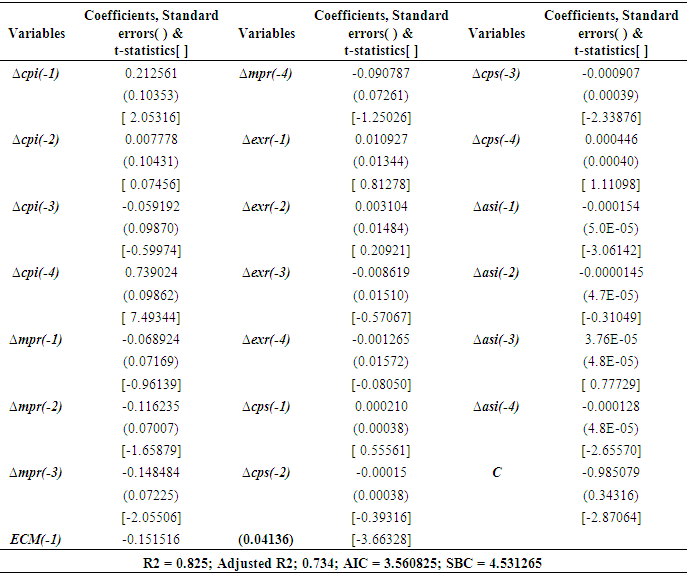
4. Discussion of Results
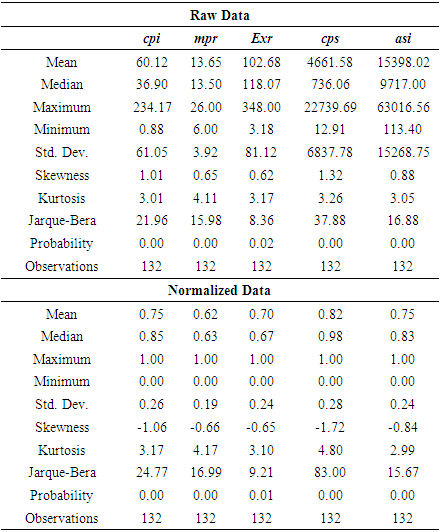
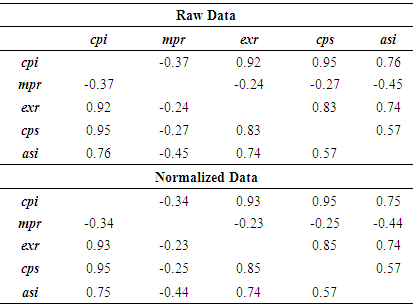
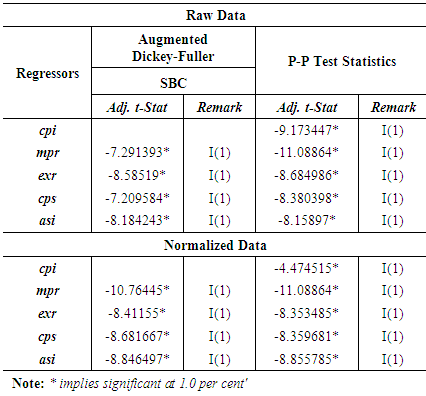
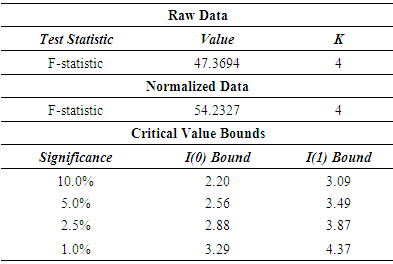
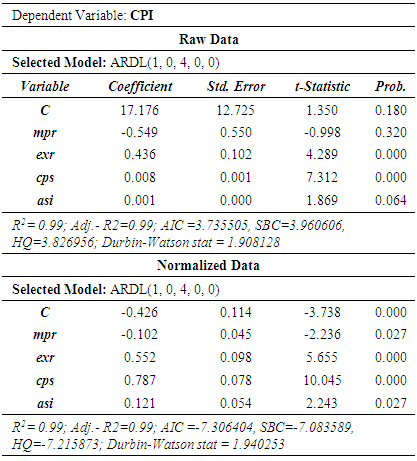
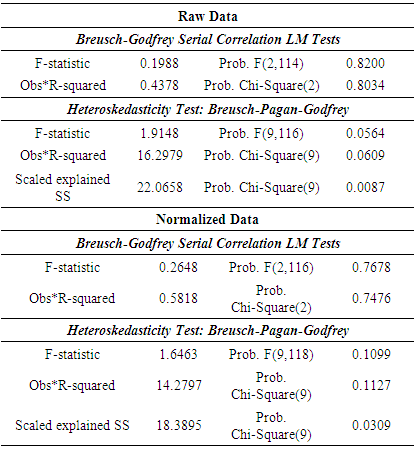
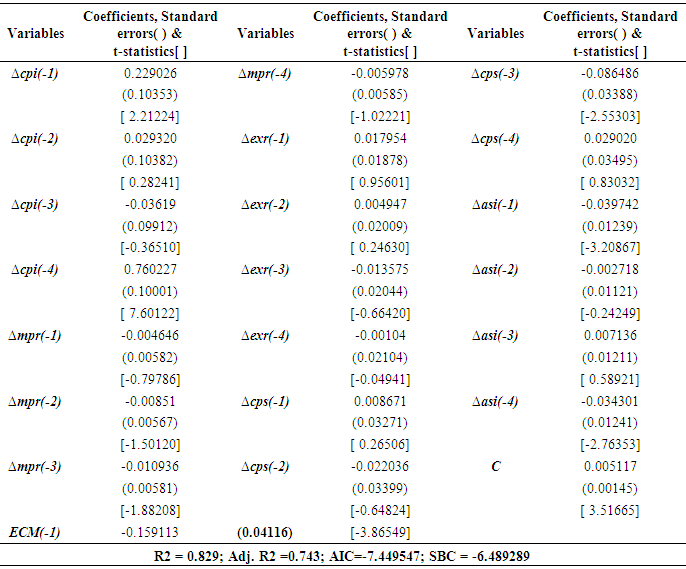
- The results are discussed from two perspectives. The first perspective which explores the characteristics of the data use for the estimation considers the descriptive statistics, correlation analysis and stationarity tests. The second perspective takes care of the regression analysis and post estimation diagnostic tests. Both perspectives consider both the raw and normalized data series.Summary StatisticsTable 1 presents the descriptive statistics of variables used for the estimation at both the contemporaneous and normalized levels. The upper region of the table shows the descriptive statistics of the data at the contemporaneous level, whereas the lower part of the table presents same at the normalized level. Close scrutiny of the table shows that there are one hundred and thirty-two (132) observations per each variable. The minimum value of the distribution is 0.88 for Consumer Price Index (CPI) while the maximum value is 63,016.56 for All Share Index (ASI). The distribution is positively skewed as portray by positive coefficient of skewness of all the variables. The kurtosis of the distribution ranges from 3.01 for CPI and 4.11 for MPR. The minimum Jarque-Bera stands at 8.36 for exr. The summary statistics for raw data, in a nutshell, reveals that the distribution is asymmetrical. Conversely, the normalized data shows that all the variables are negatively skewed with -0.65, -0.66, -0.84, -1.06 and -1.72 for exr, mpr, asi, cpi and cps, respectively.
|
|
|
 | (16) |
 | (17) |
|
|
|
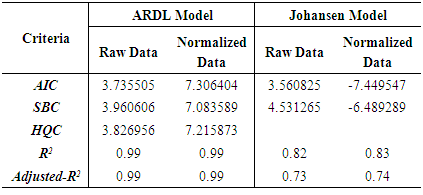
5. Conclusions and Policy Options
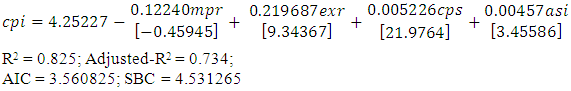
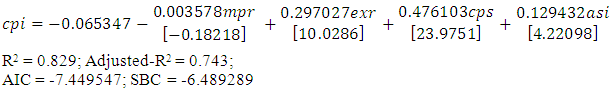
- Using a multi-model approach, the study assesses the channels of monetary policy transmission mechanism in Nigeria to determine the prevalence of asset prices channel with emphasis on equity channel of MPTM. The study applies Johansen and ARDL approaches on raw and normalized data sets from the period 1985Q to 2017Q4. Thus, each technique was run twice; first using raw data and normalized version of the raw data thereby yield four set of regression. Each channel of MPTM was represented by one variable and the choice of the best model was determined by lowest information criterion with emphasis on Akaike Information Criterion. The results return exchange rate channel as the most prevalent while equity channel occupies third position.On the basis of the findings, the study therefore, suggests close monitoring (and possibly active participation) in the equity market by the monetary authority (CBN). In other to take proactive policy decisions since disruption in the market is likely to affect the economy wide general price level which is the primary mandate of CBN. For equity channels to realize its full potential, financial market stakeholders (both regulators and operators) should devise products and provide conducive environment that will empower, stimulate and encourage investment opportunities for both local and international investors.
Notes
- 1. The views expressed herein are solely ours and do not represent or reflect the position of the Central Bank of Nigeria.2. See Gantnerova (2004).3. Others include credit to enterprises and households.
Appendix
|
|
|
|
|
|
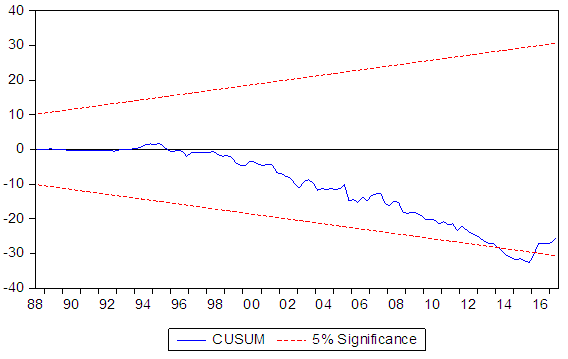 | Figure 1. CUSUM of the Raw Data |
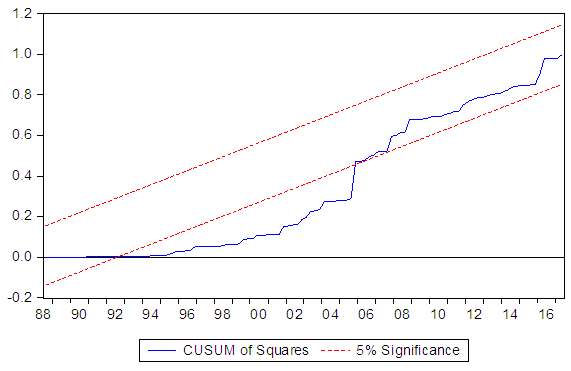 | Figure 2. CUSUMSQ of the Raw Data |
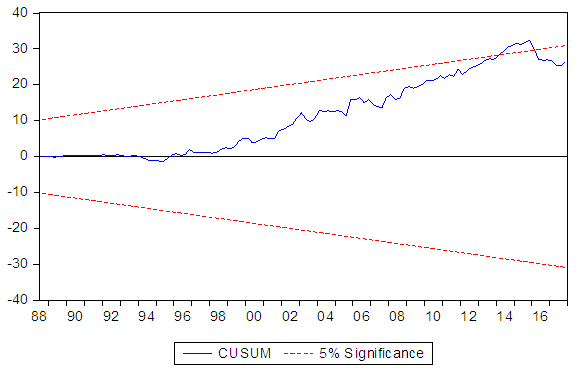 | Figure 3. CUSUM of the Normalized Data |
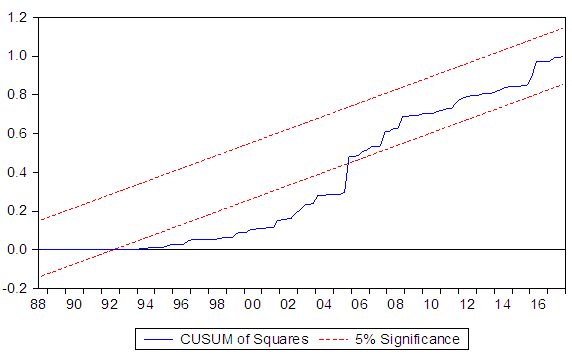 | Figure 4. CUSUMSQ of the Normalized Data |
|