-
Paper Information
- Paper Submission
-
Journal Information
- About This Journal
- Editorial Board
- Current Issue
- Archive
- Author Guidelines
- Contact Us
Microeconomics and Macroeconomics
p-ISSN: 2168-457X e-ISSN: 2168-4588
2018; 6(1): 20-31
doi:10.5923/j.m2economics.20180601.03

Macroeconomic Determinants of Electricity Access in Rwanda, an Empirical Analysis
 Abstract
 Reference
 Full-Text PDF
 Full-text HTML
Didier Mwizerwa1, Gerard Bikorimana2
1Department of Commercial Engineering, Catholic University of Rwanda, Butare/Huye, Rwanda
2Center for Economic Research, Shandong University, China
Correspondence to: Didier Mwizerwa, Department of Commercial Engineering, Catholic University of Rwanda, Butare/Huye, Rwanda.
| Email: |  |
Copyright © 2018 The Author(s). Published by Scientific & Academic Publishing.
This work is licensed under the Creative Commons Attribution International License (CC BY).
http://creativecommons.org/licenses/by/4.0/

Access to electricity by all categories of Rwandan population is a heavy problem which worries fiscal authorities in Rwandan economy. Households; factories in agriculture, manufacturing and mining; enterprises in hospitality and other services sector’ components all of them creates a growing demand for electricity. This paper highlights macroeconomic variables which determine the access to electricity in Rwanda and gives out the policy recommendations to improve generation and distribution of the electricity economically. Using the times series data spanning the period from 1997 to 2012 year, OLS method was used to estimate the zero intercept model, to test the significance of estimate and to confirm short and long-run relationship between variables. The simulations incorporated variables from capital investments and purchasing power of population dimensions. Two dimensions that describe the electricity supply and demand, and the third dimension of opportunity costs that describes where else resources that could be used to finance electricity generation, distribution and uptake are used in. The findings have shown that variables within these dimensions - gross capital formation, average interest rate on new external debt and agriculture - positively increase the access to electricity rate. Whereas, Adjusted Savings, Agriculture value Added, Claims on Central Government and Multilateral debt variables reduce the access to electricity rate. Their short, long-run impacts and priori expectations on access to electricity rate were statistically significant. Policy recommendations to policy makers are to efficiently negotiate - in favor of electricity generation and distribution – with Bretton-Woods institutions on multilateral debt and to increase the sensitization and empowerment of youth-women category to allow them participate in the agriculture value-added chain.
Keywords: Macroeconomic determinants, Access, Electricity
Cite this paper: Didier Mwizerwa, Gerard Bikorimana, Macroeconomic Determinants of Electricity Access in Rwanda, an Empirical Analysis, Microeconomics and Macroeconomics, Vol. 6 No. 1, 2018, pp. 20-31. doi: 10.5923/j.m2economics.20180601.03.
Article Outline
1. Introduction
- The lack of access to energy of the poorest people is a major barrier to poverty reduction and economic development. Beyond the basic use of electricity in households for lighting, radios, communications and basic home appliances, the application of electricity to activities that might bring economic development through productive enterprises and agricultural development can be an important engine of growth. Thus, access to electricity, in particular, is a crucial component to poverty reduction, to lengthen the day that facilitates economic and educational opportunities, and electricity also provide important services such as public/street, refrigeration, health centers and schools, piped water, communication facilities lighting. Although it is not explicitly mentioned in the Millennium Development Goals (MDGs), access to energy is often referred to as the missing MDG (IEA, 2009).With regard to the role of energy in the development of an economy and household wellbeing; MININFRA (2012), in its sector strategic plan 2012-2017, have set ambitious targets for both the access to electricity (increasing access to 70% of households by 2020) and the electricity generation capacity (developing an installed capacity of 1000MW by 2017). With regard to electricity generation capacity, the research has highlighted that MININFRA has invested significantly in electricity network and its generation infrastructure and recent additions include: 1. Grid extension and connections: The National electricity grid extended by 898 km of MV and the total number of connections to the national grid increased to 309,764 by the end of June 2012. 2. Generation investments: ü Rugezi Hydro Power plant (2.2MW) completed in March 2011 and connected to the main national grid by June 2011 after the completion of the construction of the transmission line. ü Three MHPP (approx. 3MW) Construction of 3 micro hydro power plants of Keya (2.22MW), Nkora (0.68MW) and Cyimbili (0.3MW) in Rutsiro, completed in July 2011.ü Mazimeru MHPP (0.5MW) The construction of Mazimeru MHPP by ENNY, a private joint venture of the German Company CARENA and the Rwandan NGO ADENYA-completed and connected to the grid on 30th April 2012 after successful testing. ü Nyabahanga (0.2MW) supplied power on 15th August 2012 but it is still under commissioning process.ü Janja (0.2MW) commissioned after successful testing and connected to the grid on 11th September 2012. (MININFRA, 2012)Energy Sector Management Assistance Programme, (2003) defines access and affordability of electricity as follows. By access, ASMAP means that households and business in a given area can connect to electricity that is established either by grid or smaller non-grid connected supply. This assumes that individual households or businesses do not take decisions about investing in power supply or electricity grids.A distinction can be made between the affordability of access (e.g., related to the costs of connection) and the affordability of using electricity. The most common approach to approximate affordability of use is to quantify the share of household income spent on energy. Affordability in the context of electrification and use of electricity means whether households can afford to actually use electricity once they are connected to the grid. An energy poor household has been defined in the UK Department of Trade and Industry (DTI) as “An energy poor household is one that cannot afford to keep adequately warm and light home at reasonable cost. The most widely accepted definition of an energy poor household is one which needs to spend more than 10% of its income on all energy use and to heat its home to an adequate standard of warmth behind lighting it. The root causes of energy poverty are the cost of energy, the income of the household and the energy efficiency of the home (UK Department of Trade, 2001).In light of this important role of energy in the development of an economy and household wellbeing; Toman’s approach links macro and micro perspectives through factor analysis. He concludes that the following factors show how energy is related to economic development:Ÿ Cleaner fuels resulting in health-related benefits reduced smoke exposure, clean water and refrigeration, yields direct benefits and higher productivity.Ÿ Access to modern energy services allows reallocation of household time (especially by women) from energy provision to improved education and income generation.Ÿ Economics of scale occurs in more industrial-type activities because of energy provision.Ÿ Lighting provides greater flexibility in time allocation through the day and evening, as well as better conditions for education; andŸ Lower transportation and communication costs results in greater market size and access, more access to information are the combined results of energy and other infrastructure (Toman & Jemelkova, 2002).In general, one can say that energy is an important factor for development, even how hard energy on its own is not easy to produce and distribute. Extending access to affordable electricity energy services is a core point to developing countries, and in that perspective for example Rwandan Energy Utility Corporation Limited has been created, operated with both public and internal generated funds (MININFRA, 2012). Applying such concepts one needs to take into account other factors. For example, a high share of energy expenditure could be due to a high level of consumption (as a result of large household size or high levels of discretionary use or low efficiency of use), more energy might be spent on cooking and lighting, or it could be due to high unit prices of energy, or it could be due to exceptionally low levels of income (Foster & Tre, 2000). However, as electricity energy is linked to economic development of the whole economy, the access to electricity by the citizen of Rwandan economy as a core factor to its development, still at a low level of 19.4% in 2014 as indicated by World Bank (2018) development indicators. This paper highlights the macroeconomic variables which determine the Access to electricity in Rwanda, examines the causal relationship between them thereby drawing up policy recommendations for policy makers throughout the period of 1997 to 2012.It summarizes important literature that provided the impulse for our study. It then labels the data sources and methodological structure, which it uses for the regression conditions and analysis. Subsequently, it shows the results in the following division, which also are analyzed with more existing literature and other statistics. In this section, we also present the important determinants of electricity access in Rwandan electricity sector, and how they could be relevant to the rebound effect from electricity scarcity and limited access. We include a separate division for further policy discussion on their possible impacts in economy. The conclusion will round up the details of our study and highlight important areas for future work.
1.1. Brief Literature Review
- During the past several decades, the electricity industry has received great attention globally. Restructuring the electricity industry by introducing competition, deregulation, and reform has been widely accepted by most governments. Some of the recent literatures include analyses related to macroeconomic indicators that influence the electricity access based on time series data (Poyer and Williams, 1993).Albertini et al. (2011) have highlighted how that energy consumption is based on the influences from socio-economic variables and dwelling characteristics. On the other side, the literatures of Kanagawa and Nakata (2008) and World Bank (2008) explains clearly that access to and availability of electricity has long been recognized as critical to advancing human economic development. The grid connectivity and distribution of electricity to population involves costs, often financed by the government. These costs which must be considered include: capital investment for generation, network assets and flexibility options such as storage; operational costs associated with managing network congestion; the cost of network losses; and the cost of ancillary services required to provide sufficient reliability and quality of supply (K. Bell and S. Gill, 2018a). For many decades, the majority of electricity generation connected to large power systems has been connected to the transmission networks which avail the electricity to the proximity of population. The macroeconomic determinants of electricity access are mainly indicated through three dimensions. The first dimension is about the level of capital investments in electricity production and the costs of electricity distribution. The formal concerns the provision of physical infrastructure through grid connectivity behind the increase of off-grid connectivity to increase the access. The second dimension that is about the purchasing power of population who consumes the electricity; This concerns mainly the commitment of fiscal policy or quality government to projects which increase the income of poor people in remote areas. Behind that, there must also be the fiscal policies that concern efficient distribution of the economy’s output. Most targeted sector by these policies is the agricultural sector which includes a big part of population in developing countries. The third dimension of opportunity cost concerns where else the resources - that are used for electricity production and distribution - can be used in (Prasad & Visagie, 2005). On this dimension of capital investment in electricity production, capital formation indicator has been recognized by many scholars. MOSES ABRAMOVITZ (1955) said that capital formation involves three distinct, if interdependent, activities. One is investment itself, the activity by which resources are actually committed to the production of capital goods (physical infrastructures development, human capital formation and social capital formation). A second is finance, the activity by which claims to resources are either assembled from among those released by domestic saving, or obtained from abroad, or specially created, usually as bank deposits or notes, and then placed in the hands of investors. The third is saving, the activity by which claims to resources, which might be exercised in favor of current. Consumption, are set aside and so become available for other purposes. The volume of capital formation depends on the intensity and efficiency with which these activities are carried on.The investments in electricity infrastructures and its linkages with the socioeconomic development of countries depend of how most developing governments invest in capital formation. Fiscal constraints, the acquisition and management of the growing demand for infrastructure, coupled with an increasing privatization of electricity infrastructures has made governments in developing countries rethink and embrace a new paradigm of electricity infrastructure (Vives, 1996). D. Palit, K.R., (2017) highlighted key features any government can work on to allow easy electricity access by the population through capital formation. These include:Ÿ Provision of basic framework for electric supply industry;Ÿ Stimulating the growth of the sector through private licensees, Licensed by State Government;Ÿ Provision for license for supply of electricity in a specified area;Ÿ Legal framework for lying down of wires and other works;Ÿ Provisions laying down relationship between licensee and consumerNot only physical infrastructures of electricity increase population’s access to electricity, the human capital formation also can be linked to energy consumption through multiple channels. First, human capital can increase income, which may then cause more energy consumption. Second, human capital can stimulate R&D of new energy and accelerate the transition to energy-efficient technologies, thus high level of electricity provision to population (Li and Lin, 2016). In addition to this, Social capital is defined as informal forms of association, institutions and organizations that are based on social relationships, networks, and associations that create shared knowledge, mutual trust, social norms, and unwritten rules (Durlauf & Fafchamps, 2005). Its formation leads to social capital formation which in returns reduces poverty where people in these different forms of association 1) increase their income generating activities, 2) facilitates the access to electricity and 3) rural development in general (Hayami, 2009). Still in this first dimension, one cannot ignore the cost of these capital investments. How the government commits the external debts in electrification programs leads to a high rate of electricity access by the population (William J. Hausman, et al., 2018). For Leland and Pyle (1977), the motivation to understand the costs of financing electricity infrastructures through external debt financing mechanism stems from a fundamental theory of financial intermediation. The key issue in many external financing models is the information asymmetry between the government borrower who seeks capital to finance the electricity infrastructure and the electricity infrastructure's financier. The government of high-quality investments in electricity has incentive to reduce information asymmetry by retaining a high equity ownership stake in the electricity investments. This increases the efficiency in electricity production and distribution thus an effective electricity access by its population (Jensen and Meckling, 1976). Here, what is most important economic characteristic of an electrification program is the capital intensity committed into electrification program. This means that attraction of outside finance is essential because new projects, or expansion of existing systems, cannot be financed from local finances. Those finances can come from the private market, from governments, or from multilateral and bilateral development agencies. An evaluation of the developing countries electrification program (grid connectivity) found that connection costs were not widely affordable, that is why many governments of developing countries embraced off-grid electrification program (Borchers, 2001). Despite this, the drive towards electricity distribution, often incentivized by financial support mechanisms such as feed-in tariffs or tax breaks and other diversification of electricity providers such as reactive power providers, micro-hydro power plant, solar energy provider, distributed generators and other smaller non-grid connected supply are changing this situation (K. Bell and S. Gill, 2018b). However, today over one and a half billion people worldwide lack access to electricity. Most of these people live in rural areas of developing countries, largely in Africa and South-East Asia (UNDP-WHO, 2009).In addition to gross capital formation as one among indicators of capital investment dimension, saving accumulation is also considered as an indicator of such dimension. Keynes (1936) argued on saving motives by highlighting eight different motives, to which Browning and Lusardi (1996) added one motive. These are (1) precautionary motive, (2) life-cycle motive, (3) inter-temporal substitution motive, (4) improvement motive, (5) independence motive, (6) enterprise motive, (7) bequest motive, (8) avarice motive, and (9) down payment motive. The adjusted national saving is a result of Net National Saving plus Expenditures on Education minus resources Rents (such as depletion of energy, minerals and forest) minus carbon dioxide (CO2) damage. In the calculation of ANS (Adjusted Net Saving), current expenditure on education (books, salaries of teachers, etc.) is treated as saving rather than consumption, since it increases the country's human capital. Pollution damages reflect losses of welfare in the form of human sickness. Energy depletion is the depletion of oil, coal and natural gas. Mineral depletion is the sum of the depletion of bauxite, copper, iron, lead, nickel, phosphate, tin, zinc, gold and silver. Measures of depletion stand for the management expenditures of the natural resources, it is clear that the saving treatment here do incorporate all necessary macroeconomic aspects of development economics (World Bank, 2004).Most recent literatures have highlighted the link between the second dimension of access to electricity and its indicators such as agricultural land or arable land area, agricultural value added and others. Johanna Choumert and Pascale Phélinas (2015) have highlighted the factors that are expected to influence agriculture land value and said that they can be split into two groups, intrinsic and extrinsic characteristics. The first includes physical characteristics such as surface, soil characteristics, land quality, productivity, and yield. Extrinsic characteristics include locational characteristics such as access to the nearest city, access to roads, urban pressure, and climate. In sub-Saharan countries few studies have highlighted the link of agriculture land value to population access to electricity. Troncoso et al. (2010) find that localization, access to the nearest city and connectivity to roads are the most influential attributes which increase the agricultural land area; hence the increase of population access to electricity because of income and other resources generated agricultural activities on that arable land. Some of the recent literatures about the outcome and outputs from arable land, suggests that land outcomes and outputs may vary with potential environmental contamination such as soil exhaustion and degradation (Sills E. and Caviglia-Harris, 2009), the cropping history of the plot, and the implications of land tenure on fertilization, adoption of conservation practices, and long-term land improvements (Abdulai A. et al., 2011).The second dimension of Agriculture value added as the annual growth percentage is defined by ISIC as Annual growth rate for agricultural value added based on constant local currency. Value added is the net output of a sector after adding up all outputs and subtracting intermediate inputs. It is calculated without making deductions for depreciation of fabricated assets or depletion and degradation of natural resources. Agriculture value added is related to the average profitability of a specific crop in a given geographical area and it is strictly dependent on the geographical area characteristics and crop type (Sallustio L., et al., 2018). This agricultural value added variable leads to an increase of the population access to electricity since the processing of the harvest or produce from agriculture requires the electricity. The controversies exist in the economic literature about the drive of external debt in the economic growth process. With sound economic institutions of developing countries, the foreign inflows with clear economic development agendas contribute positively in the total output (Carlsson et al., 1997). Weak economic institutions may result in moral hazard and rent seeking problems that will reduce the productivity of external debts. North (1992) states that the good governance enables a country to achieve its economic development goals and become prosperous, by establishing a conducive environment that is impartial, predictable and consistently to enforce the rule of laws as the fundamental for the persistent growth and high level of people’s access to the country’s resources such as electricity. Acemoglu and Robinson (2008) explain that countries with weak institutions must reformulate their institutional structure and external debts management strategies to enhance the economic growth and people’s access to resources such as electricity. Before World-War II, most of socio-economic activities in developing economies were financed by multilateral debts. Multilateral debts includes aid projects grants, mixed loans and grants, loans at discretionary rates from multilateral organizations, loans or loan guarantees at market rates, technical assistance, and sector aid program transfers in cash or in kind, (Clifton et al., 2006). With “Washington Consensus” foreign direct investment and private investment in the electric utility sector was revived. Many of the multilateral aid agencies created in the post-World War II era welcomed this development and fostered it since it offered new and potentially productive outlets for their grants, credits, and lending (Manibog et al., 2003). Despite this, some of the concessional debts which are part of external debt may inhibit the incentive for greater resource mobilization through taxation, bilateral/multilateral condition associated to these inflows, goods, services and human capital imported through these concessional debt channels (Berg, 1993).
2. Methodology
2.1. The Empirical Model Specification
- The model specified here is the regression through the origin that produces quantitative estimates of partial coefficients for various independent variables; it was adopted on the basis of underlying economic theories and the capital asset pricing model (CAPM). The underlying economic theory commands that the intercept term be absent from the model. Other instances where the zero intercept model may be appropriate are Milton Friedman’s permanent income hypothesis, which states that permanent consumption is proportional to permanent income; cost analysis theory, where it is postulated that the variable cost of production is proportional to output; and some versions of monetarist theory that state that the rate of change of prices (i.e., the rate of inflation) is proportional to the rate of change of the money supply.In line with access to electricity, three dimensions of the explanatory variables are broadly determined. These are capital investments and purchasing power of population which describes the structure of electricity supply and demand (intrinsic variables). The dimension of opportunity costs of resources used in electricity production despite distribution, describes the financial economic conditions (extrinsic variables) under which some infrastructures and economic activities are financed in. Extrinsic variables are relevant to the levels of electricity production, and it is thus expected that they would also play a role in influencing the success of electricity access program. Based on the empirical work of Aman Srivastava et al., (2018) and Sohail Ahmad (2014) the simulation of access to electricity determinants was made using OLS method and the regression model used in this paper takes the form of:
 | (2.1) |
 Is the dependent variable proxied by the percentage rate of people who have electricity at their homes and it is measured as:
 are the explanatory variables in a vector of macroeconomic variables grouped in capital investments, purchasing power and opportunity costs dimensions.The coefficients
  are the partial regression coefficients for various explanatory macroeconomic variables
 random disturbance term. Initially, we assume that the X’s are non-stochastic; the error term is normally distributed with zero mean and constant variance. That is,× Given the value of
  , the mean, or expected, value of the random disturbance term
  is zero. Symbolically,
  × Also, the variance of
  is the same for all observations. That is, the conditional variances of
  are identical. Symbolically,
  and because of the above assumption
  In the first dimension, Gross Capital Formation
  as a macroeconomic variable that influence the access to electricity is expected to positively influence it. Gross capital formation (formerly gross domestic investment) consists of outlays on additions to the fixed assets of the economy plus net changes in the level of inventories. Fixed assets include land improvements (fences, ditches, drains, and so on); plant, machinery, and equipment purchases; and the construction of roads, railways, and the like, including schools, offices, hospitals, private residential dwellings, and commercial and industrial buildings. Inventories are stocks of goods held by firms to meet temporary or unexpected fluctuations in production or sales, and "work in progress." According to the SNA (1993), net acquisitions of valuables are also considered capital formation.Still in the same dimension, adjusted net savings as the macroeconomic variable used in this paper, are the difference between gross national income and public and private consumption, plus net current transfers (World Bank, 2018). While with average interest on new external debt commitments, Interest represents the average interest rate on all new public and publicly guaranteed loans contracted during the year. To obtain the average, the interest rates for all public and publicly guaranteed loans have been weighted by the amounts of the loans. Public debt is an external obligation of a public debtor, including the national government, a political subdivision (or an agency of either), and autonomous public bodies. Publicly guaranteed debt is an external obligation of a private debtor that is guaranteed for repayment by a public entity (World Bank, 2018).In the purchasing power dimension, Agricultural land variable as the percentage of arable land refers to the share of land area that is arable, under permanent crops, and under permanent pastures. Arable land includes land defined by the FAO as land under temporary crops (double-cropped areas are counted once), temporary meadows for mowing or for pasture, land under market or kitchen gardens, and land temporarily fallow. Land abandoned as a result of shifting cultivation is excluded. Land under permanent crops is land cultivated with crops that occupy the land for long periods and need not be replanted after each harvest, such as cocoa, coffee, and rubber. This category includes land under flowering shrubs, fruit trees, nut trees, and vines, but excludes land under trees grown for wood or timber. Permanent pasture is land used for five or more years for forage, including natural and cultivated crops (FAO, 2018). Still, Agriculture value added as percentage annual growth of GDP, Annual growth rate for agricultural value added is based on constant local currency. Aggregates are based on constant 2010 U.S. dollars. Agriculture corresponds to ISIC divisions 1-5 and includes forestry, hunting, and fishing, as well as cultivation of crops and livestock production. Value added is the net output of a sector after adding up all outputs and subtracting intermediate inputs. It is calculated without making deductions for depreciation of fabricated assets or depletion and degradation of natural resources. The origin of value added is determined by the ISIC (World Bank, 2018).In the opportunity cost dimension the increase of financial, technological and labor resources allocated in the production of goods and services (such as allocation of government loans to projects related to construction investment, development of health or education sectors, capacity building) other than electricity production and distribution leads to a decrease of access to electricity rate. In this dimension, Claims on central government variable expressed as the percentage annual growth of broad money include loans to central government institutions as a net of deposits. Multilateral debt variable used in this paper as the percentage of total external debt stocks is about loans from Bretton-woods institutions (World Bank, 2018).
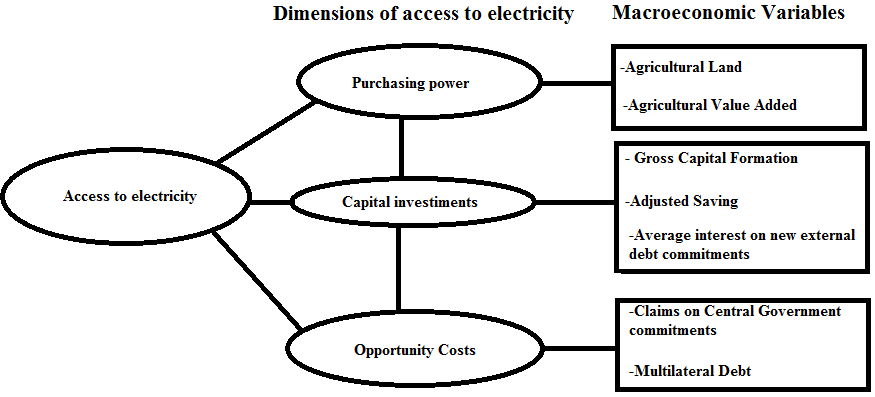 | Figure 1. Conceptual Framework of access to electricity |
|
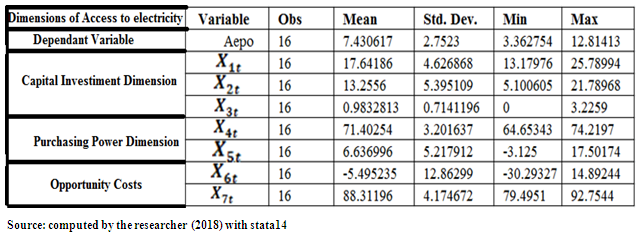
2.2. The Data
- The researcher collected data with the aim to show up the macroeconomic determinants of electricity access in Rwanda. The information from this research is useful to evaluate and inform policy decision makers in the electricity sector and financial sector. The time series employed here are for the period between 1997 to 2012 years for one cross section Rwanda. The availability of data is one of the justifications behind choosing these periods. The time series data are shown in the appendix. We are interested in finding out how macroeconomic variable under three dimensions determine the access to electricity in Rwanda, where the proxy of such access is the percentage of people with access to electricity (Aepo) to total population in Rwanda between 1997 to 2012 period and depend on: × The capital investments dimension. This paper made simulations to describe how this dimension determines access to electricity using data from three macroeconomic variables:ü Gross Capital Formation
 and its data considered are the percentage of GDP,ü The adjusted saving data
  including particulate emission damage are the percentages of GNI; ü Average interest data
  on new external debt commitments are just in percentages× The dimension of population’s purchasing-power who consumes the electricity includes all variables that target the increase of population’s income. Those macroeconomic variables are:ü Agricultural land
  and its data are expressed in the percentages of total land areaü Agriculture value added
  and its data are annual percentages of growth× The opportunity cost dimension which concerns where else the resources used in electricity production and distribution can be used in has the following as macroeconomic variables:ü Claims on central government
  and its data are expressed in annual growth percentages of broad moneyü Multilateral debt
  and its data are expressed in percentages of total external debtData for each variable were obtained from the World Bank’s World Development Indicators (2018) online, National Institute of Statistics of Rwanda available online, and from National Accounts (2017) available online.
2.3. Test of Estimate’s Significance
- To estimate the model, a multiple regression analysis is used to reflect the explanatory nature of the variables. To verify the validity of the model, two major evaluation criteria were used: the a-priori expectation criteria which is based on the signs and magnitudes of the coefficients of the variables under investigation; and (ii) statistical criteria which is based on statistical theory, which in other words is referred to as the First Order Least Square (OLS) consisting of T–test and confidence interval, R-square
 F-statistic, Unit Root test and cointegration tests. T–test and confidence intervalsSince we have invoked the assumption of zero mean and constant variance, this paper uses the t-test and 95% confidence intervals to test a hypothesis about any individual partial regression coefficient. The critical t-value is 2.262 with 5% significance level and 9 degree of freedom.The Coefficient of Determination
  The Coefficient of Determination is concerned with the overall explanatory power of estimates obtained from the regression analysis. The coefficient of determination (R-Square) measures the goodness of fit for our access to electricity regression model. It measures the percentage of the total variation in the dependent variable as explained by explanatory variable.F-statisticThe F-test is one of the econometric criteria to ascertain the overall significance of the estimated model, the stability of coefficients over time and also a test of significance of
  With this test also, this paper find out the degree of multicollinearity. The multicollinearity is fundamentally a sample problem in the logic that even if the explanatory variables are not linearly related in the population, they may be so related in the particular sample at hand: When we hypothesize the access to electricity model, we believe that all the explanatory variables included in the model have an independent influence on the access to electricity variable Aepo. But it may happen that in any given sample that is used to test the access to electricity model some or all of the explanatory variables are so highly collinear that we cannot isolate their individual influence on Aepo. Also, F-statistics is used also to test the multicollinearity problem arising from the exact linear relationship between explanatory variables. Given n-variables in the regression model (2.1) to test the hypothesis:
 (i.e., all slope coefficients are simultaneously zero) versus
 Not all slope coefficients are simultaneously zero. This paper computes
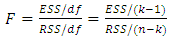 | (2.2) |
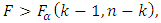 we reject
  otherwise we do not reject it, where
 is the critical value at α level of significance and (k-1) numerator df and (n-k) denominator df. Alternatively, if the p-value of F obtained from (2.2) is sufficiently low, we reject
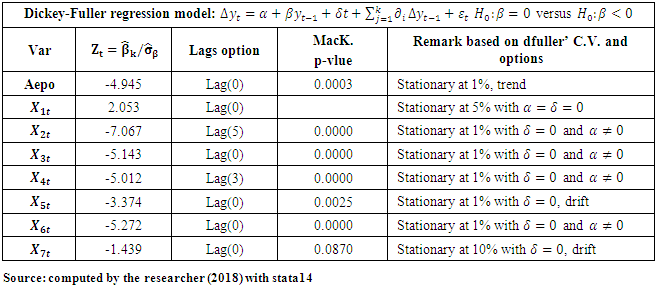
  Unit Root TestIn literature, most macroeconomic time series variables are trended and therefore in most cases are non-stationary and using non-stationary variable in the estimation of model leads to spurious regression (Granger and Newbold, 1977). The first and second difference terms of the variables will usually be stationary (Asterious and Hall 2010). Aepo, Gross capital formation, agriculture value added, Average interest on new external debt, claims on central government debt and multilateral debt variables in this study are tested at level where as adjusted saving and agriculture land are tested at lag (5) and lag (3) respectively for stationarity using Augmented Dickey–Fuller test that a variable follows a unit-root process. The null hypothesis is that the variable contains a unit root, and the alternative is that the variable was generated by a stationary process. For some variables to test their stationarity, this paper excluded the constant in the model of Gross capital formation that test unit root, included a trend term in the model of Aepo test unit root, included the drift term in the model of agriculture value added and multilateral debt to test unit root (see also, Hamilton, 1994). To compute the test statistics, we fit the augmented Dickey–Fuller regression
 | (2.3) |
 or time trend
  is omitted and k is the number of lags specified in the lags ( ) option. The test statistics for
  is
is  where
where  is the standard error of
  The critical values used in this paper are interpolated based on the tables in Fuller (1996), the t-statistic has the usual t-distribution and the approximated p-values on the basis of a regression surface are all reported in (MacKinnon, 1994). Cointegration Test The theory of cointegration has been developed to eliminate the problem of false correlation often associated with non-stationary macroeconomic time series data. According (Mill 1990) cointegration establishes the link between integrated processes and the concept of steady state equilibrium. The idea behind cointegration is that ‘although two different series may not themselves be stationary, some linear combination of them may be stationary with more than two series (Komolafe 1996). According to Asterious and Hall (2010), cointegration is an over-riding requirement for any economic model using non-stationary time series data. Once the variables in the model don’t cointegrate, then there exists the problem of false regression analysis and the econometric effort becomes almost worthless. The key point here is that if there really is unpretentious long-run relationships between two variables say
  then although the variables will rise over time, there will be a common trend that associates them together. For an equilibrium, or long-run relationship to occur, what it require, then, is linear combination of
  can be directly taken from estimating the following regression:
 And taking the residuals
 | (2.4) |
 then the variables
  and
and  are said to be cointegrated. All the variables under study shall be subjected to Engle-Granger cointegration test to avoid spurious correlation often associated with non-stationary time series data. The Engle-Granger permits for the OLS residuals to be tested for unit root and stationarity.
3. Results
3.1. Unit Root Test Estimation
- The table 3.1 shows the results of the unit root test at different levels of difference respectively to establish the stationarity of the variables under contemplation. The results disclose that at level Access to Electricity, Gross Capital Formation, Average interest on new External Debt, Agriculture value Added, Claims on Central Government and Multilateral Debt variables are stationary. At third and fifth differences, the variables Agriculture land and Adjusted Savings are respectively stationary. Since all the variables are stationary at different level of differences, it means that adoption of OLS method gives reliable and efficient estimates.
|
3.2. Engel-Granger Cointegration Test
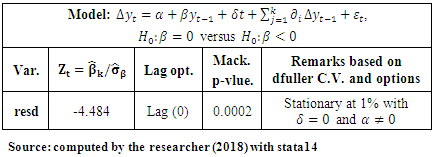
- The result in the table 3.2 shows that the null hypothesis
 which says that the OLS residuals of Access to electricity model contain a unit root was rejected in profit of the alternative that residuals of Access to Electricity were generated by a stationary process. As shown by the result above on unit root test, the time series of Access to electricity (Aepo), Gross Capital Formation
  Adjusted Savings
  Average interest on new External Debt
  Agriculture land
  Agriculture value Added
  Claims on Central Government
  and Multilateral Debt
  variables are stationary and since residuals of Access to electricity model were generated by a stationary process, they are also cointegrated. Consequently, it is suitable to make extrapolations from the OLS linear regression model that describes the relationship between the variables.
|
3.3. Model Estimation
3.4. Interpretation of OLS Results
- With the above results, from table 3.3, the values of our explanatory variables in equation (2.1) of Access to Electricity model, Gross Capital Formation
 Adjusted Savings
  Average interest on new External Debt
  Agriculture land
  Agriculture value Added
  Claims on Central Government
  and Multilateral Debt
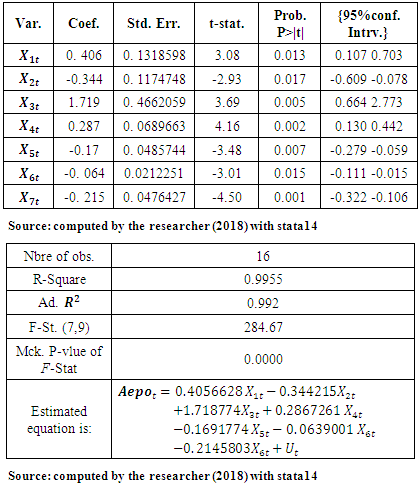
  are correctly signed, statistically significant (as shown by t-statistics) and are in line with priori expectations. In the case of indicator under opportunity cost dimension as the dimension which simulates the relationship between of fiscal policy targets or priorities and access to electricity rate, we were expecting the negative relationship with Access to Electricity rate because of the main government’s strategic focus (reflected in the 2 main government’s programme which are PRSP and EDPRS I) in force under the period of the study. PRSP ended in the 2005-2006 fiscal year, where the main emphasis was on managing a transition from emergency relief to rehabilitation and reconstruction. Six broad areas were identified as priorities for action: rural development and agricultural transformation: human development, economic infrastructure; governance, private sector development and institutional capacity-building. EDPRS I ended in the 2011-2012 fiscal year, the priority was given to accelerating growth, creating employment and generating exports. The policy and strategy focus under EDPRS 1 was, therefore to (a) accelerate growth and diversification by giving a bigger role to the private sector, and (b) further decentralize governmental functions to take developmental decision-making closer to the people, accompanied by strengthened accountability mechanisms (see MINECOFIN, 2018). The production and distribution of electricity was far among the main government’s heavy investments in which financial funds can be put in (external debt funds, either concessional or multilateral debt). The variations of the access to electricity in Rwanda, during the period under study, is explained by the independent variables as shown as by R-square of 99.5%.The value of F-statistics (284.67) is said to be statistically significant, given the fact that its probability value (0.0000) is far below than 0.05 significance level. This implies that the overall model is statistically significant, coefficients are stable under the period of the study, and the degree of multicollinearity/collinearity between variables is low. An overview of the Ordinary Least Squares (OLS) results show that Gross Capital Formation
  Average interest on new External Debt
  and Agriculture land
  have a positive impact to increase the access to electricity rate given the positive linear relationship between access to electricity and these variables. In this study, it was found that a one unit increase in gross capital formation, average interest on new external debt and agriculture land rates increases the access to electricity rate by 0.405, 1.718, and 0.286 respectively. These are important variable as they contribute to the success of capital investment and purchasing power/income dimensions, especially gross capital formation and agriculture land variables. Adjusted Savings
  as the citizen’s income forgone now to satisfy future expenditures, this paper found out that if it is increased by one unit, there is a reduction of 0.344 in the access to electricity rate. Agriculture value Added
  decreases the access to electricity rate by 0.169 if it increases by one unit. This paper investigated the impact of fiscal funds invested in the government’s heavy investment on access to electricity, by introducing external debt indicators. Claims on Central Government
  as the costs of other activities in which government’s funds has been invested in, decrease the access to electricity rate by 0.063 if its percentage annual growth to broad money is increased by one unit. In addition to this, if the loans to central government institutions continue to be invested in other projects other than electricity production and distribution, Aepo declines by the same rate. The Multilateral Debt
  variable, as a part of external debts often associated with lender’s conditions of where and what to invest in funds, reduces the access to electricity rate by 0. 2145803 if their percentage to total external debt is increased by one unit.
4. Summary of Findings, Conclusions and Recommendations
4.1. Summary of Findings
- An overview on the estimated results using OLS method, show clearly with significant statistics, show that increase of gross capital formation (the increase of Rwanda’s fixed assets and inventories), external debt in general without distinction based on any criteria proxied by average interest rate on new external debts, and increase of agriculture land have a positive impact to increase the access to electricity rate in Rwanda. While making simulations on new external debt, this paper introduced in the model two variables to highlight the individual effects of conditions associated with Bretton-Woods finances (multilateral debts) and of loans to central government compared to its net deposit (claims to central government). These variables were found to be significantly reducing the access to electricity. However, the Rwanda’s external debt (in general without any distinction based on the source, borrower category, cost or lender’s conditions) increases the access to electricity by the population.The increase in gross capital formation has effect on the economy with the dribble effect on the living standards of the citizens. It is believed that when capital formation leads to the proper exploitation of natural resources and the establishment of different types of industries, levels of income increase and the varied wants of the people are satisfied.Despite this, savings (since it an outlay forgone now so as to meet future expenditure) and agriculture value added has been found to be reducers of access to electricity rate in Rwanda. With adjusted net saving and agriculture value added, it may be attributed to the structure of economy that is growing from destructions which occurred in 1994 Tutsi Genocide. The returns from agriculture were low to the level that it cannot allow access to electricity. Also, even if these variables which contribute negatively on access electricity in Rwanda are statistically significant, it may be attributed to poor performance of agriculture sector and low saving rate which implies low investment rate under the period of the study. Considering agency theory, if this sector is revived by the government with the inclusion of women and youth on the benefits of agriculture valued added, the big part of (more than 70%) will have their income increased, thus increase of purchasing power to afford electricity.
4.2. Conclusions
- This paper explored the macroeconomic determinants of access to electricity in Rwanda using Ordinary Least Square method. It reveals that, as they are significant, gross capital formation, new external debt without any distinction as proxied by the average interest on new external debt and arable land proxied by agriculture land (all expressed in percentages) increase the access to electricity rate. This paper revealed also that (with distinction of external debt constituents) multilateral debt and loans to central government proxied by claims to central government (all expressed in percentages) reduces the access to electricity rate. Claims on central government which are the costs of funds/loans borrowed by only central government compared to net economy’s deposit, were decreasing the access to electricity because it reduces government’s income which would be in return used in electricity production and distribution. With regard to multilateral debt, the government of high-quality invests in electricity by retaining a high equity ownership stake and must build an incentive to reduce information asymmetry in the electricity investments. This increases the efficiency in electricity production and distribution consequently an effective electricity access by its population. Multilateral debts are often associated with difficult condition from lenders that hinder the success of the economy’s projects of electricity production and distribution or totally orient those projects in activities which don’t increase the access to electricity.
4.3. Policy Recommendations
- × The economy has to invest in capital goods both in material and human capital that significantly increase the yield of productive effort at the disposal of the nation and its people so as to move out of low access to electricity.× As it is significantly increasing the access to electricity, arable land together with value addition from agricultural produce must be coordinated closely so as to get the same trend on both variables. Then,× The government has to strategically check on the distribution of value added from agriculture produces. The inclusion of the biggest part of Rwandan population in this equitable distribution would facilitate the increase of access to electricity.