-
Paper Information
- Paper Submission
-
Journal Information
- About This Journal
- Editorial Board
- Current Issue
- Archive
- Author Guidelines
- Contact Us
Microeconomics and Macroeconomics
p-ISSN: 2168-457X e-ISSN: 2168-4588
2016; 4(2): 46-55
doi:10.5923/j.m2economics.20160402.02

Imperatives of Economic Fluctuations in the Growth and Performance of Nigeria Construction Sector
 Abstract
 Reference
 Full-Text PDF
 Full-text HTML
Peter Uchenna Okoye1, Chukwuemeka Ngwu2, Fidelis Okechukwu Ezeokoli1, Stanley Chukwudi Ugochukwu2
1Department of Building, Nnamdi Azikiwe University, Awka, Nigeria
2Department of Quantity Surveying, Nnamdi Azikiwe University, Awka, Nigeria
Correspondence to: Peter Uchenna Okoye, Department of Building, Nnamdi Azikiwe University, Awka, Nigeria.
| Email: |  |
Copyright © 2016 Scientific & Academic Publishing. All Rights Reserved.
This work is licensed under the Creative Commons Attribution International License (CC BY).
http://creativecommons.org/licenses/by/4.0/

The study investigated the impact of economic fluctuations on the growth and performance of construction sector in Nigerian. Quarterly published data from the National Bureau of Statistics (NBS) on construction sector and aggregate GDP from 2010 to 2015 were used. The study used econometric techniques such as unit root test, cointegration test, Granger causality test as well as ordinary least square regression method to establish the stationarity, causality and relationships between the aggregate GDP and the construction sector growth. The result showed that the series were stationary at the level form and were from common trend and in the same order of zero I(0). It also revealed existence of a long–term equilibrium contemporaneous relationship between the variables from the model, which produced two cointegration equations. A counter cyclicality (negative relationship) (R = -0.088) which was not significant was also established between the GDP and construction sector. The R2 value (0.007804) indicated that only about 0.78% proportion of variation in the GDP growth can be explained by the construction growth. Although a relationship model between GDP growths and construction growth was established, it was found that the growth rate of construction sector is more volatile compared to that of GDP as a whole. The study then recommended for positive construction policies as construction sector has the potentials for improving and growing the national economy and recovering economy from recession.
Keywords: Construction Sector Performance, Economic Cycles, Economic Growth, GDP, Recession
Cite this paper: Peter Uchenna Okoye, Chukwuemeka Ngwu, Fidelis Okechukwu Ezeokoli, Stanley Chukwudi Ugochukwu, Imperatives of Economic Fluctuations in the Growth and Performance of Nigeria Construction Sector, Microeconomics and Macroeconomics, Vol. 4 No. 2, 2016, pp. 46-55. doi: 10.5923/j.m2economics.20160402.02.
Article Outline
1. Introduction
- Economists of the nineteenth and early twentieth centuries were persuaded by a pattern exhibited in the overall level of economic activity and enthusiastically sought to characterise the observed regularities of what came to be known as the “business cycle” [1]. Berman and Pfleeger [2] acknowledge that industries react in different ways to the business cycle fluctuations. Some industries are very vulnerable to economic swings; others are relatively immune to them. For those industries that are characterised as cyclical, the degree and timing of these fluctuations vary widely; the industries that experience only modest gains during expansionary periods may also suffer only mildly during contractions, and those that recover fastest from recessions may also feel the impact of a downturn earlier and more strongly than other industries [2]. However, Kun [3] argues that subject to large and extensive fluctuations, construction investment is one of the most volatile components of the GDP. He maintains that construction needs long development periods and a long response time for stocks to adjust to new market conditions. As a result, substantial gaps between planning and completion phases cause construction to respond cyclically to exogenous shocks. Kun [3] however, observes that most empirical construction economic literature of recent decades focused more on the cyclical behaviour of construction investment’s components, and their relationship with output and other economic series, and notes that it presents a wide range of often contrasting results. Sequel to this, the proliferation of cycle research has become a priority for large institutional investors such as real estate investment trusts, insurance companies, pension plans and their sponsors. In order to make more informed decisions on construction investment, a clear understanding of the factors that drive the working of the cycles in the construction industry is necessary. In the United States of America for instance, the number of fluctuations in total construction investment and some of its main components exceed that of the output series [4]. In Nigeria specifically, after restructuring and re-basing her National Account at 2010 constant basic price, Nigeria’s economy became the largest in the Sub-Saharan African. Consequently, Nigeria’s GDP increased from 18% in 2009 to around 32% in 2013 and thus outpaced the South African economy which used to be the largest economy, but whose share decreased from 30% in 2009 to 22% in 2013 [5]. Interestingly, National Bureau of Statistics (NBS) [6] reports that the Nigerian economy has experienced a great change in terms of volume of activities covered in all sectors of the economy as the post-rebasing data in the construction sector shows a much more optimistic picture, as more modern construction activities have been captured, and prices correctly deflated. The boom in the oil sector played a key role for the economic development in Nigeria in the past. Unfortunately, the current slump in oil prices has caused serious problem for the Nigerian economy and presented a major risk for the construction industry as it reduced budget revenues and restricted the government’s abilities for infrastructure investments. Recent freezing of budget-funded projects also resulted in an increasing number of redundant people in the construction industry [5]. The shock on the Nigerian economy is greatly noticed in the overall performance of the economy.Therefore, the continue decline and contraction of the Nigeria economy needs to be investigated in relation to the activities of the construction sector as one of the key sectors of the economy. This period of economic redundancy and retrogression requires workable policies based on accurate information in all sectors of the economy for efficient and sustainable economic growth. This position is substantiated by Kargi [7] who found that the growth rate of the construction industry in the developing countries is more than the GDP growth rate, and that the percentage it takes in the GDP of developed countries relatively diminishes. Kargi [7] maintains that construction industry’s growth in the economic fluctuation periods, in the aftermath of a recession, is more than the GDP. Consequently, Giang and Pheng [8] opine that the construction industry is vastly affected by and also affects the economic growth trends and the fluctuations in these trends. It should then be noted that the process of economic growth is closely related especially to the sufficiency of the public infrastructure investments even if there are fluctuations [8].Regrettably, there is dearth of research effort in this area especially in the developing countries like Nigeria. The paucity of data covering all the activities describing the functioning of the construction industry in Nigeria is a major concern on its own. Few studies in this area are mainly from the developed economies [4, 9-14] with very few from other regions of the world [15]; and virtually none from Nigeria. Additionally, current reports on the state of Nigeria economy present a horrifying trend. In the First Quarter of 2016 for instance, the nation’s Gross Domestic Product (GDP) grew by -0.36% (year-on-year) in real terms [16, 17]. The negative growth in Q1, 2016 was largely driven by the services, construction, and industrial sectors with relative contributions of 0.07, 0.23, and 1.03 percentage points, respectively [16]. This suggests that Nigeria economy is gradually creeping into recession. Therefore, understanding the dynamics of construction sector in the economic cycle is instrumental to drawing right policy conclusions for the future. The fact that construction sector is subject to boom-bust cycle far stronger than those experienced by other sectors usually associated with fluctuating fortunes [18] makes this study worthwhile. Thus, this study investigates the impact of economic fluctuations on the construction sector growths and performance in Nigeria using construction sector economic data from 2010 to 2015.
2. Literature Review
- The construction industry is a key industry in many countries, usually making up to 5–10% of the overall gross domestic product (GDP) [11]. Accordingly, it is closely related to the financial and labour markets, depending on the characteristics of businesses in a given country. Studies have shown that construction sector is subject to volatility due to economic dynamisms. Yusof [15] reports that an analysis of economy, construction and commercial property cycle indicates that for some type of construction sector, there is evidence of general economy influence. Baker and Agapiou [10] found that housing construction as a share of GDP has a negative relationship with interest rates and that construction prices are positively associated with construction activity, although there is a slight lag between the movement in activity and the change in prices. Gostkowska-Drzewicka [12] also shows that changes in the prices of production factors in construction are closely related to the situation in the sector, but argues that this relationship is particularly noticeable in the growth phase of the cycle. Thus, as an indispensible sector of the economy, fluctuation in economic variables (labour, equipment, materials, employment, GDP) that determine the demand and supply of construction stock is unavoidable over time, hence, cycles in the construction industry. Therefore, construction as a capital goods industry plays important role in economy for both recovery from recession and prevention from contraction [14].Grebler and Burns [4] analysed the cycles of total construction and its major sector after adjustment for the varying growth trends of real expenditure. The study found that there are relationships between cycles in total construction and its components and between construction and GNP cycles. It further shows increasing volatility of private construction over time and substantial inter-sector differences in average volatility. Grebler and Burns [4] aver that although public policies have a strong potential influence on the cyclical performance of construction, the complexities revealed in the study indicate severe problems in attempt to stabilise its output. According to Ruddock, Kheir and Ruddock [13], firms in the construction industry have always had to deal with the challenges of the economic cycle and develop strategies to deal with the resulting fluctuations in their business environment. Rice and Shewan [18] agree that construction sector has a key role to play in overcoming the issues related to economic cycles.Lahdenperä [9] related the economic cycle to the methods of procurement in construction in Finland and found that design-build and management-type procurement, and to some extent also separate contracts, increase their share as the economic outlook improves. It further found that the traditional comprehensive contract assumes a larger role as economic trends weaken. The development trend independent of economic cycles also indicates that use of the comprehensive contract decreases as the other procurement methods mentioned above are used more.Park et al. [11] analysed the construction business cycle of three countries: the United States, the United Kingdom, and South Korea using the three-state Markov switching model and construction industry data for categorising GDP by economic activity. Although the validation results of the U.S. construction industry were unsatisfactory because of the unprecedented long-term recession, results of the analysis showed that the proposed model could be used to determine the construction business cycle. The forecasting performance test also showed that the proposed model could be used to predict more than one quarter in advance, which was the interval in identifying the business cycle. Accordingly, it is believed that the proposed methodology can be used to determine and cope with each country’s business cycle.Ruddock, Kheir and Ruddock [13] assessed whether the strategies of large companies in the construction sector, when faced with issues associated with variation in economic cycle, have changed since the previous business cycle (i.e. the 1986–1990 boom followed by the 1990–1991 recession) following the 2008–2011 double-dip recession in the UK. While there are many similarities between policies adopted during the recessionary periods of the two cycles, the research found notable changes in attitudes towards diversification, human resource management and price bidding among the top 100 construction industries in the UK.Although, some studies have affirmed the existence of relationships between the construction sector and the aggregate economy and other sectors of the economy in Nigeria [8, 19-26], research into the impact of economic fluctuations on the construction sector growth and performance in Nigeria has remain unexplored. Ogujiuba, Abraham and Stiegler [27] argue that effort of several studies in the economics literature; have focused on examining the factors driving growth leaving fewer ones to grapple with examining seasonalities associated with growth trends. It would be recalled that the re-computation of Nigeria economic variables has altered a lot of things, thus, the need to examining the current performance of construction sector in the Nigeria economy. Besides, several changes have occurred in Nigeria in recent years. For instance, the new economic policies, the fiscal and monetary policies adjustment which have affected all sectors of the economy need to be factored into perspective. Another twist is the declining Nigeria economic growth in the recent time, where there has been a negative growth trend, thereby signalling an economic recession. The above scenarios and inability of previous studies to capture the current trends in the construction sector and Nigeria economy formed the thrust of this study.
3. Methodology
3.1. Data and Data Description
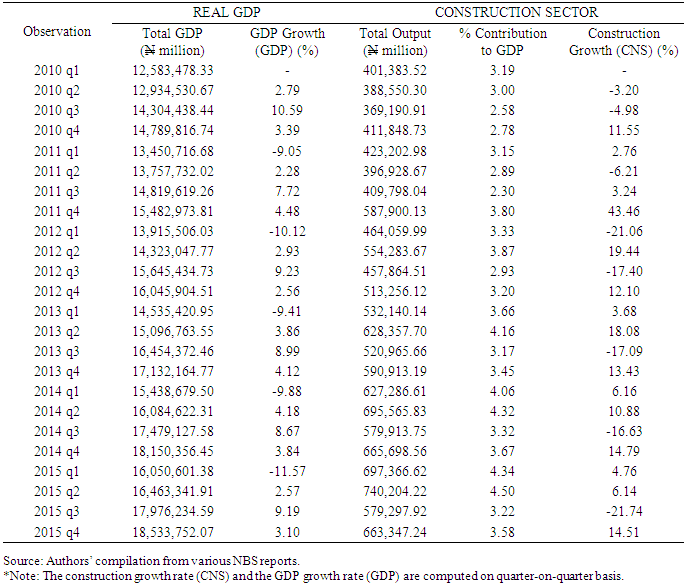
- The quarterly data for the period 2010Q1 to 2015Q4 on construction sector output, growth in construction sector, total Gross Domestic Product and GDP growth were extracted from the National Bureau of Statistics (NBS) publications in Million Naira and employed to analyse the dynamic relationship between GDP growth (GDP) and construction sector growth (CNS). Contemporaneous correlation is examined while evidence of Granger causality between these two variables is checked. Table 1 presents the total real GDP, GDP growth, total construction sector output, construction sector growth and construction sector percentage contribution to GDP at 2010 constant basic price quarter-on-quarter from 2010q1 to 2015q4. Quarterly observations of GDP and construction sector data were obtained from the following NBS publications: Revised and Final GDP Rebasing Results by Output Approach [28], Nigerian Construction Sector Summary Report 2010-2012 [6], Nigerian Gross Domestic Product Quarterly Report, Quarter Four 2014 [29], and Nigerian Gross Domestic Product Quarterly Report, Quarter Four 2015 [30].
|
3.2. Unit Root Test
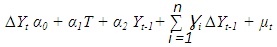
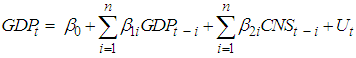
- The unit root test is conducted to check the stationarity of data series in this study. This step is very important because if non-stationary variables are not identified and used in the model, it will lead to a problem of spurious regression [31], whereby the results suggest that there are statistically significant relationships between the variables in the regression model when in fact all that is evidence of contemporaneous correlation rather than meaningful causal relations [31, 32]. The unit root test is typically based on the following mathematical formulation.
 | (1) |
 | (2) |
 | (3) |
3.3. Granger Causality Test
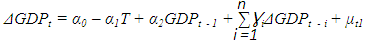
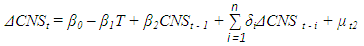
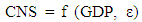
- The conventional practice in testing the direction of causation between two variables has been to use the standard Granger framework. The basic concept of the Granger causality tests is that future values cannot predict past or present values. If past values of construction sector growth do contribute significantly to the explanation of GDP growth, then construction sector growth is said to Granger-cause GDP growth. This means that construction sector growth is Granger-causing GDP growth when past values of construction sector have predictive power of the current value of GDP growth even if the past values of GDP growth are taken into consideration. Conversely, if GDP growth is Granger-causing construction sector growth, it would be expected that GDP growth change would take place before a change in construction sector growth. The Granger causality test is used in the present study, fitted with quarterly data from 2010 q1 to 2015 q4 to test whether construction sector growth stimulates GDP growth or GDP growth leads the construction growth, or if there exist feedback effects between construction sector growth and the real GDP growth, The Granger causality test consists of estimating the following equations:
 | (4) |
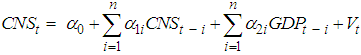 | (5) |
 and
and  .Against the alternative hypothesis that
  and
and  for equation (4) or (5) respectively.If the coefficients of β2i are statistically significant, but α2i are not statistically significant, then GDP growth is said to have been caused by CNS (uni-directional). The reverse causality holds if coefficients of α2i are statistically significant while β2i are not. But if both α2i and β2i are statistically significant, then causality runs both ways (Bi-directional).
3.4. Cointegration Test
- The stationary linear combination is called the co-integrating equation and may be interpreted as a long-run equilibrium relationship between variables. Although there are several co-integration techniques available for the time series analysis, their common objective is to determine the most stationary linear combination of the time series variables under consideration. Consequently, Johansen’s [36, 37] co-integration technique has been employed for the investigation of stable long run relationships between construction sector growth and total gross domestic product growth. The following equations were estimated with VAR lag 1 and assume that the series does not contain deterministic linear trends. Johansen’s Co-integration Test (consider a VAR of order p).
 | (6) |
3.5. Ordinary Least Square Regression Analysis
- When data series are stationary at the same level, the Ordinary Least Square Method is used to regress the series to get results. Under certain assumptions, the method of least squares has some very attractive statistical properties that have made it one of the most powerful and popular methods of regression analysis. Least squares or ordinary least square (OLS) is a mathematical optimisation technique which, when given a series of measured data, attempts to find a function which closely approximates the data (a "best fit"). It attempts to minimise the sum of the squares of the ordinate differences (called residuals) between points generated by the function and corresponding points in the data. Specifically, it is called least mean squares (LMS) when the number of measured data is 1 and the gradient descent method is used to minimise the squared residual. LMS is known to minimise the expectation of the squared residual, with the smallest operations (per iteration). In this case, OLS is used to determine the impact of the real GDP trends on the construction sector output in Nigeria. Mathematically, the relationship between the Real GDP growth (GDP) and construction sector growth (CNS) is represented in the regression model as:
 | (7) |
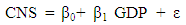 | (8) |
4. Results and Discussions
4.1. Descriptive Statistics
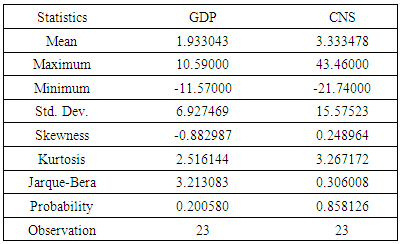
- From table 2, the average Gross domestic product growth (GDP) from the first quarter of 2010 to the last quarter of 2015 in Nigeria stood at 1.93%. The maximum and minimum GDP growth within this period is 10.59% and -11.57% respectively. The skewness and kurtosis values indicate that the GDP growth within the period is negatively skewed and has no excess kurtosis. While the Jarque-Bera statistic value of 3.213083 and the corresponding probability value of 0.200580 show that the Nigerian economic data are normally distributed. Likewise, the total construction sector growth rate (CNS) stood at average of 3.33% from the first quarter of 2010 to the last quarter of 2015 in Nigeria. The maximum and minimum values are 43.46% and -21.74% respectively. The skewness and kurtosis values indicate that within this period, the construction sector growth (CNS) is positively skewed and has no excess kurtosis. While the Jarque-Bera statistic value of 0.306008 with the corresponding probability value of 0.858126 show that Nigerian construction output is normally distributed.
|
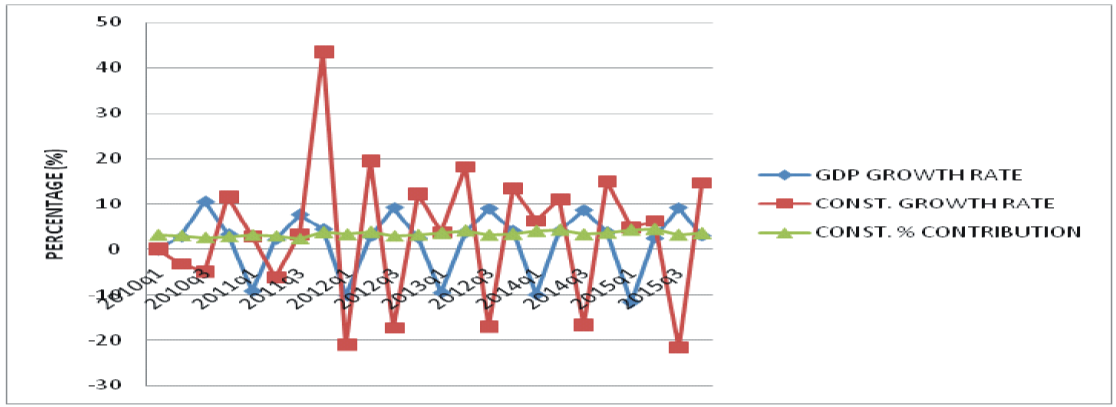 | Figure 1. Quarterly growth trends of GDP and Construction sector and percentage contribution of construction to GDP |
4.2. Result of Unit Root Test
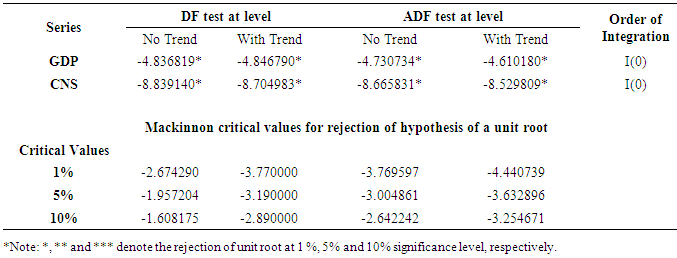
- Table 3 shows the results of the unit root of the variables (CNS and GDP) under investigation. The results from the DF and ADF tests indicate that the two data series (CNS and GDP) are stationary in their level form since the null hypothesis of unit root with and without time trend can be rejected at all conventional levels of significance. Since both the DF and ADF test statistics reject the hypothesis of a unit root at all conventional levels of significance, it implies that both series (CNS and GDP) appear to be level stationary (i.e. I(0)). Since both test variables are integrated of the same order I(0), it is possible to apply Johansen’s co integration tests to determine whether there exists a stable long run relationship between the construction sector (CNS) and Real Gross Domestic Product (GDP) in Nigeria.
|
4.3. Result Granger Causality Test
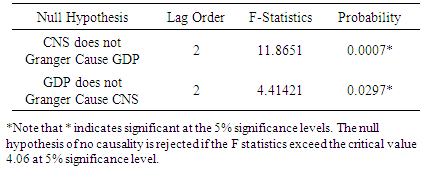
- The result of causality from construction growth (CNS) to gross domestic product growth (GDP) and from GDP growth to construction growth (CNS) in Nigeria is shown in table 4. The result reveals that construction growth Granger cause GDP in lag order of 2. Likewise, the real GDP Granger cause construction sector output at the same order of 2 lag. This means that there is strong causality between construction growth rate and the nation’s GDP growth rate, which is true for lag order of 2. This implies that construction growth leads GDP growth by two quarters in Nigeria and vice versa. This causal linkage can be interpreted as the forward and backward linkages of the construction growth with the GDP growth.
|
4.4. Result of Cointegration Test
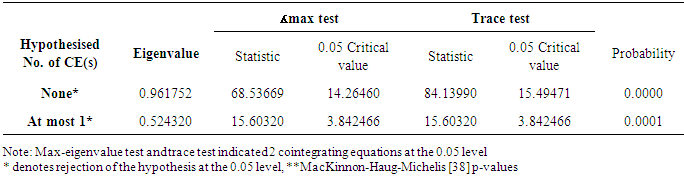
- Table 5 indicates that the result of the Johansen cointegration test rejects the null hypotheses of no cointegration between CNS and GDP, since the maximum eigenvalues (68.53669 and 15.60320) and trace statistics (84.13990 and 15.60320) are greater than the associate critical values (14.26460) and (15.49471) for the two hypotheses of none cointegration equation and at most 1 cointegration equation respectively at 5% significance level. This implies that the hull hypothesis is rejected in both cases. Since cointegration exists, then it could be inferred that there is a long–run equilibrium contemporaneous relationship between the variables and they have a common trend. With the establishment of cointegration, this also rules out the possibility of a spurious relationship between the variables, and also suggests that a causal relationship must exist in two directions. Thus, the values of likelihood ratios and trace statistic indicate two cointegrating equations at 5% significance level.
|
4.5. Result of Ordinary Least Square Regression Analysis
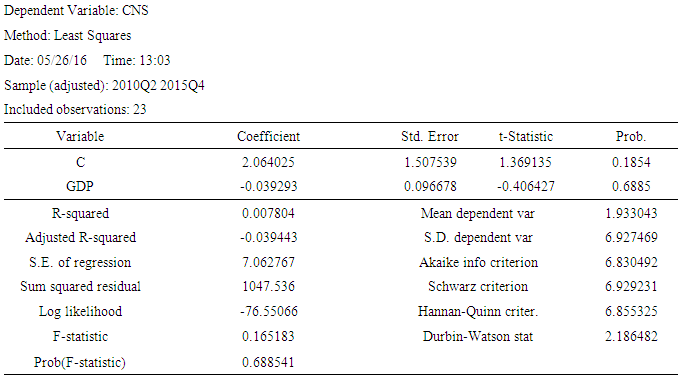
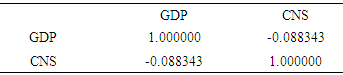
- The Ordinary Least Square regression result in table 6 shows that there is negative relationship between the construction growth (CNS) and the gross domestic product growth (GDP) in Nigeria. The coefficient value (-0.039293) of the construction growth with t-statistic value (-0.406427) and the corresponding P-value (0.6885>0.05) shows that the construction growth has a non-significant negative effect on the GDP growth. The R2 value (0.007804) indicates that about 0.78% of the proportion of variations in the GDP growth can be explained by the construction growth. This corresponds with the result of table7 which shows a very weak non-significant negative correlation (-0.088343) between the construction growth (CNS) and the gross domestic product growth (GDP) at 5% significance level. This result is in line with [8] who found that the construction industry is vastly affected by and also affects the economic growth trends and the fluctuations in these trends. This also affirms the trend nature of the construction sector in relation to that GDP. The implication of this result is that the performance of the construction sector in Nigeria can be predicted by the prevailing economic trends in the country. Meanwhile, the Durbin-Watson statistic value (1.607162) following the rule of the thumb indicates that there is no autocorrelation present in the model. From the above result, the relationship between the construction growth (CNS) and the GDP growth (GDP) can be represented in the model below.CNS = 2.064025 - 0.039293GDP
|
|
5. Conclusions
- As one of the major sectors of the economy, the construction sector is influenced by the economic trends and behaviours. The pattern of this influence has been a source of concern to many economic policy makers over the years in both developed and developing countries. Consequent upon this, this study has analysed the impact of economic fluctuations on the Nigeria construction sector growth and performance with a view to determining if the growth in the construction sector is majorly dependent on the patterns of economic performance. The study found that the growth rate of construction sector is more volatile compared to that of GDP as a whole. This implies that the flow of construction is influenced by other forces apart from economy. The result revealed the existence of counter cyclicality (negative relationship) between macroeconomic time series in relations to construction output and construction sector growth. Although, there is non-significant negative correlation between the construction growth and the GDP growth, there is bi-directional causal relationship between the two variable where each of them Granger cause each other. This relationship is further established through a regression model which implies that the gross domestic product growth can be predicted by the construction growth. Since the variables are from the common trend, the study found that there is a long–term equilibrium contemporaneous relationship between the variables in which two cointegration equations are formed from the model. Having established the non-significance correlation between the construction growth and the GDP growth, the study found that only very small proportion of variation in the GDP growth can be explained by the construction growth. This confirms the notion that the growth in construction sector is not commensurate with its contribution in the growth of the GDP as the sector still contributes very small proportion to the Nigeria aggregate GDP.As Nigeria is facing the possibility of slumping into economic recession, this study presents itself as a veritable tool in the hands of construction investors, government agencies, economic planners and policy makers because it has exposed the construction industry as a destination for investments where emphasis should be placed on growing the national economy. This result of the study is a guide for government agencies to know where interventions in the sector should be placed especially now the country is going through hard economic time. Furthermore, the study highlighted the need for construction professional to collaborate with the government in rescuing the nation’s economy through the construction sector. The result also formed the basis for construction professionals to advising the government on the position of construction sector in economic recovery. Since no known study has investigated the impact of economic cycles on the construction sector growth in Nigeria, the timeliness of this study is apt and informs its uniqueness and novelty. Thus, the study has added to the growing body of knowledge and would serve as a research tool and reference material for further research to the construction, business and economic researchers.The study then recommended close examination of the construction sector as it has the potentials for improving and growing the national economy and facilitating quick recovery from economic recession. More emphasis should be placed on this sector in terms of increased construction inputs, favourable policies and programmes, human capital development and capacity building. More so, increase collaboration between the foreign and indigenous firms in the areas of knowledge sharing and transfer should be encouraged so as to increase foreign direct investments in the sector.