Patience Kunda Banda, Simon Tembo
Department of Electrical and Electronic Engineering, School of Engineering, University of Zambia, Zambia
Correspondence to: Patience Kunda Banda, Department of Electrical and Electronic Engineering, School of Engineering, University of Zambia, Zambia.
| Email: |  |
Copyright © 2016 Scientific & Academic Publishing. All Rights Reserved.
This work is licensed under the Creative Commons Attribution International License (CC BY).
http://creativecommons.org/licenses/by/4.0/

Abstract
There are many ways of measuring mobile penetration rate. In Zambia, like many other countries, mobile penetration rate has been measured using the number of sim connections. This approach, as well as that which uses the number of phones to measure mobile penetration rate does not give an accurate view of the actual mobile penetration rate. Measurements that determine mobile penetration rate based on number of sim connections might give false information indicating that there is saturation in the mobile telecommunications sector when in fact not. Understanding how number of phones, number of sim connections and number of actual mobile subscribers relate becomes very important. In this study, we use Microsoft excel to analyze and determine actual mobile subscriber penetration rate in Zambia. Data used in this study is based on a survey done on 700 mobile customers in six districts, surveys with the three Mobile Network Operators (MNOs) present in Zambia and the Zambia ICT Agency (ZICTA). Extrapolations were made on the results of the survey, with strict correlation made to fluctuations in population growth as estimated by the Central Statistical Office (CSO) to estimate the approximate actual mobile subscriber penetration rate for the years 2010 up to the year 2030. The results show that multiple sim ownership by mobile subscribers has a large influence on the actual mobile subscriber penetration rate. As of the year 2015, on average, every mobile subscriber in Zambia owned about more than two sim connections. Using our Mobile Penetration Rate Projection (MPRP) method, the actual mobile subscriber penetration rate is projected to be at 58% at end of the year 2030.
Keywords:
Mobile Penetration Rate, Sim Connections, Actual Mobile Subscribers, Zambia
Cite this paper: Patience Kunda Banda, Simon Tembo, A Study on Mobile Penetration Rate in a Multi-Simming Environment: The Case of Zambia, Microeconomics and Macroeconomics, Vol. 4 No. 2, 2016, pp. 37-45. doi: 10.5923/j.m2economics.20160402.01.
1. Introduction
Mobile telephony is a fast growing industry all over the world. By the year 2012, the adoption of mobile telephone service was at 76.6% in developed countries, while the global mobile phone adoption stood at over 60% [1, 2].Most countries allow subscribers to own multiple sim connections with MNOs of their choice. Customers have multiple sim connections for many reasons, especially cutting down costs when making off-net calls [3]. Zambia in particular, allows mobile subscribers to own multiple sim connections. This is in order to ensure fair competition among the MNOs and as a measure towards consumer protection [4, 5, 6].As of December 2015, there were three MNOs on the Zambian Telecommunication market namely Airtel Zambia, MTN Zambia and Zambia Telecommunication Limited (ZAMTEL). ZAMTEL is a government owned mobile network operator while Airtel and MTN are owned by the private sector. Figure 1 shows the trend in market share for the three MNOs for the years 2010 up to 2015. Prior to the year 2010, Airtel dominated the mobile telecommunications sector with a market share a little over 70% in 2009 [7]. MTN later picked on market share and took the market lead just after the year 2013 as shown in Figure 1. ZAMTEL has seen a slight rise in market share, but not aggressive enough to surpass that of Airtel and MTN, which both dominate between 80 to 90 percent of the mobile telecommunication market.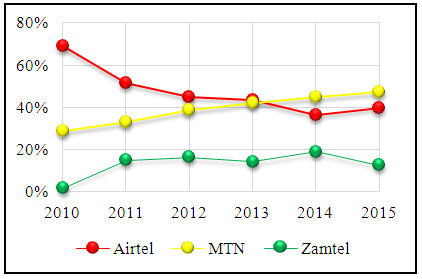 | Figure 1. Market Share for MNOs. Source [ZICTA, Interview] |
This paper has seven sections. Section 1 gives general information about the Zambian mobile telecommunication industry. It shows market share evolutions for the three MNOs present by end of year 2015. Section 2 discusses literature surrounding the concept of multi-simming and approaches taken in measuring mobile sim penetration rate. Section 3 discusses the MPRP model proposed to use in determining mobile penetration rate in cases where subscribers can own multiple sim connections. It also discusses some of the advantages that this model has, compared to the widely adopted model recommended by GSMA. Section 4 describes the methodology used in this study in detail, with the study approach, sampling technique and data analysis carried out outlined. The results are outlined and discussed in section 5. Section 5 also shows that subscribers do not own multiple sim connections only across but also within MNOs. Further, section 5 shows step by step calculations for the actual mobile penetration rate using the proposed MPRP model. Section 6 summarises the findings and gives a conclusion while section 7 points out some of the areas on which future works can be done for this study.
2. Literature Review
Today, there are many ways of measuring mobile penetration rate. Some approaches measure the number of mobile phones, others measure the number of sim connections that are active or mobile connections, while others measure the number of actual subscribers compared to the population in an area under consideration. Most of the reports that are common on the internet today measure mobile penetration by a count of mobile phones and sim connections. For example, in 2014, there was an estimated 7 billion mobile sim connections globally [2, 8], while the number of actual mobile subscribers was stated as 3.6 billion thereby placing the global average actual mobile subscriber penetration rate at 49.9% [1]. Doshi and Narwold [2] reported the global mobile cellular penetration rate to be at 96.2% in 2012 with 6.8 billion mobile subscriptions worldwide. The dimension taken in measuring mobile penetration matters a lot. This is because the three approaches give different indications and may be advantageous or not depending on how one intends to use the data. Gillet mentions that dividing the population by the total number of sim connections would not be so accurate. The case of countries such as China, where there are more sim connections than the total population qualifies this statement [1]. The recommendation by the Global System for Mobile Communications Agency (GSMA), is to measure Mobile Penetration Rate (MPR) as in Equation 1 [1].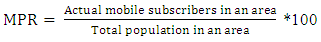 | (1) |
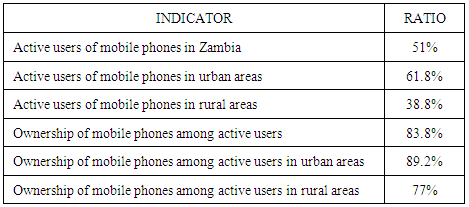
MNOs in Zambia and many other regions measure their mobile subscriber base by counting the actual sim connections on their network [7, 8]. A survey done by ZICTA, which regulates mobile services in Zambia, the Central CSO and the Ministry of Transport and Communications determined that about 51% of people above 10 years of age are active users of mobile phones while about 64.5% of households in the country have access to a mobile phone. Table 1. Ownership of Mobile Phones in Zambia. Source [9]
 |
| |
|
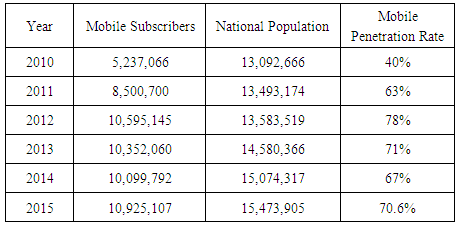
CSO estimated that there were about 10.1 million Zambian individuals above the age of 10 in 2015, who are subscribed to mobile services [9]. The 51% of individuals above the age of 10 translates into about 5.1 Million individuals with access to mobile phones. This report however, does not indicate the approximate number of mobile connections or actual mobile subscribers countrywide. An estimate of the available proportion of actual mobile subscribers was approximated to be at about 29% as of 2009 [10]. As in Table 2, ZICTA reported that as at the end of September 2015, there were 10.9 million mobile phone subscribers, representing a mobile penetration rate of about 70 percent countrywide [5, 10]. Table 2. Mobile Penetration Rate in Zambia. [5, 7]
 |
| |
|
According to ZICTA, the mobile penetration rate in Zambia has evolved as shown in Table 2. This study aims at determining the mobile penetration rate on the Zambian market for the years 2010 up to 2030 by comparing the number of actual mobile subscribers to the total national population.
3. Proposed MPRP Model
According to a research done by Doshi and Narwold [2], the International Telecommunication Union (ITU) reported that the mobile penetration rate in developed countries was 128% for the year 2012. This typical scenario shows how much mobile penetration rate estimates can be distorted when the number of sim connections is used instead of actual mobile subscribers in measuring mobile penetration rate. Another example which shows distortion is found in a report [11] which stated that developed markets are growing slowly because the market was approaching saturation. While we do not entirely dispute this fact, it would be much more accurate if the report [11] also acknowledged the fact that multi-simming was inflating figures, thus causing this saturation. Research [1, 8, 11] shows that there will soon be as many mobile connections as people on the planet, a great milestone in itself for the telecommunications industry. This however does not mean that every person will be subscribed to mobile services because it is possible for a subscriber to own more than one sim connection. Considering this fact becomes cardinal, not only to prospective investors, but also management in the telecommunications industry. Understanding proper determination of mobile penetration rates in environments where there is multiple sim connection ownership can help in determining the addressable market in a more accurate manner [4, 6, 9]. The GSMA method for measuring mobile penetration rate in Equation 1 [1], does not state explicitly how actual mobile subscribers in an area need to be determined in cases where individual customers can own multiple sim connections. This is inevitable because in most of the countries there are no regulations that ensure that mobile subscribers only have one sim connection [4, 6, 10]. Equation 1 becomes limited in cases where the number of sim connections becomes more than the total population. The result is that the mobile penetration rates will be over hundred percent, a highly impractical scenario. To prevent such situations, the MPRP model proposed in this paper ascertains the actual number of subscribers of Equation 1, by taking average number of sim connections individual subscribers own into consideration. The key parameters shown in Equation 2 segments the total population in an area according to the number of sim connections owned.  | (2) |
Where; a)  is the percent ratio of the total population of mobile subscribers that own i sim connections in a particular defined area.b)
  is the total population of mobile subscribers in a particular defined area.c)
  is the particular number of sim connections under consideration. d) M is the maximum possible number of sim connections that an individual mobile subscriber owns.The upper limit for Equation 2 has been set to a maximum possible number an individual mobile subscriber can own, M in that in a multi-simming environment such as Zambia, there is no regulation that limits the number of sim connections that an individual mobile subscriber can own [3, 7]. Hence, the upper limit considers this fact and can become useful in a case where an individual subscriber happens to own an enormous number of sim connections. It is key to note that the MPRP method proposed in Equation 2 represents the numerator of Equation 1. Equation 2 can be used to determine the actual number of mobile subscribers in an area by comparing the proportion of a population that is subscribed to mobile services to the proportion that owns a significant number of sim connections. To derive our MPRP model, we substitute Equation 2 into Equation 1. This yields Equation 3 as our MPRP model, with all parameters as defined under Equations 1 and 2.
 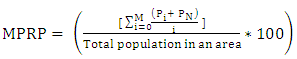 | (3) |
The proposed MPRP method of Equation 3 has the following advantages over that proposed in Equation 1;1) It is practical for usage in determining the actual mobile subscriber penetration rate in environments where mobile subscribers are allowed to have multiple sim connections.2) It brings the possibility of duplicating actual subscribers to the barest minimum. This is because it factors in the actual sim connections owned at age group level, and compares it to the mobile sim connections to make an estimation of the actual mobile subscribers.3) It gives a more accurate measure of Average Revenue Per User (ARPU) to mobile telecommunication business owners in determining as it considers the actual mobile subscribers and not sim connections.4) It is a better method to use when determining mobile market saturation levels in that it can give a truer measure of a possibly greenfield market for exploitation.The advantages of the model in Equation 3 are not limited to the ones mentioned in this paper, as it can be a better measure to use for making various strategic decisions.
4. Methodology
4.1. Research Approach and Design
Figure 2 presents a summary of the approach and design taken for this research. Data on multi-simming from three perspectives namely that of mobile subscribers, that of MNOs and that of ZICTA and government agencies such as CSO was collected. The sources of this data are mobile subscribers, the three MNOs and ZICTA through surveys and interviews. Additional data was obtained from reports done by CSO.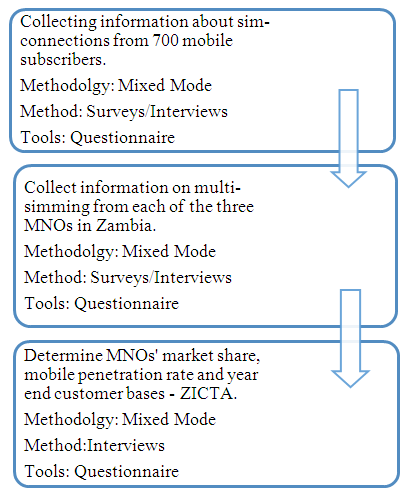 | Figure 2. Methodology, Methods and Tools used in this Study |
4.2. Sampling Procedure
Figure 3 summarizes the main types of sampling techniques and used in this study. In probability sampling, each sample has an equal chance of being selected to take part in the study. In non-probability or biased sampling, individual samples are not representative of a relevant population [12]. As Jonker and Pennink point out, a biased sample will therefore not be adequate in making logical conclusions about certain attributes of the entire population [12]. 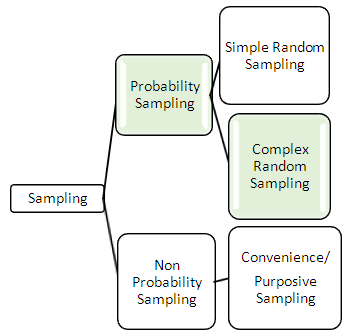 | Figure 3. Sampling Technique used for this Study |
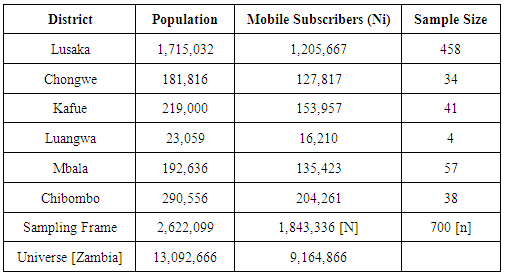
The population variations among the distinct districts of Zambia facilitated for the use of stratified sampling, which irons out such in-homogeneities so that samples within each sampling unit or strata have an equal opportunity of being represented [13]. As Table 3 shows, some of the districts had even just about 1% population in comparison to the others. The samples were drawn from 6 districts in 3 different provinces of Zambia. From Lusaka province samples were drawn from Lusaka, Kafue, Chongwe and Luangwa districts. Mbala district was sampled from Northern Province while Chibombo district was sampled from Central province. Figure 4 represents these 6 districts as strata from the sampling frame, which constitutes the entire population of individuals subscribed to mobile services in Zambia.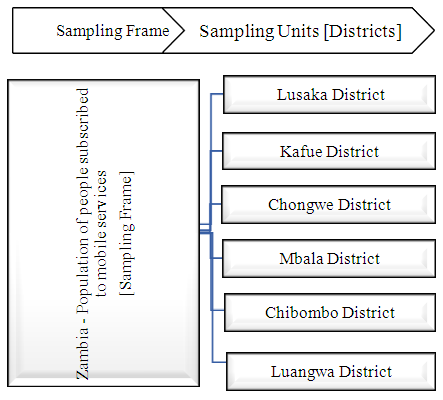 | Figure 4. Sampling Frame and Units/Strata used in this Study |
The sample size per stratum or district was determined using Equation 4 [14], which relates number of sampling units to the population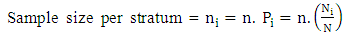 | (4) |
Where;a) n is the sample size or total number of samples to be drawn from the sample space.b)  is the number of samples to be drawn from the
  stratum. c) is the population per
  stratum, which in this case was calculated as 70% of the population per district as determined by ZICTA for the year 2015. The ZICTA office provided responses on a questionnaire provided to them.d) N is the total population in a sampling frame. The national population of Zambia was determined as 13092666 as shown in Table 2.e)
  is the ratio of the total number of samples in the
  stratum.Using Equation 4, the sample sizes shown in Table 3 were determined. N in Equation 4 was represented by the total population subscribed to mobile services in the sampling frame.
  was represented by the population subscribed to mobile services per district or strata. The total number of samples desired to be drawn, n, was 700.
Table 3. Sample Sizes per Strata/District
 |
| |
|
4.3. Data Analysis
The level of multi-simming per age groups and per district were determined by applying Equation 1 on the data collected from the surveys. The number of actual mobile subscribers was determined from the projections on actual populations done by CSO and a flat mobile connections penetration rate of 70% for all years as projected by ZICTA for the year 2015.For the years 2010 up to 2014, the average annual mobile penetration growth rate was at about of 3.8% [5, 7]. This figure was used to project the average sim connection and mobile penetration rates for the years 2015 to 2030.
5. Results and Discussion
5.1. Internal and External Multi-Simming
Results of this research indicate that it is possible for customers to have multiple sim connections with a particular MNO as well as belong to more than one MNO. In this paper, we refer to the earlier case as internal multi-simming and the later as external multi-simming respectively. Figure 5 illustrates internal multi-simming while Figure 6 shows external multi-simming.Figure 5 shows cardinal information in terms of internal multi-simming. Multi-simming does not only happen across MNOs but also within MNOs. This is so because as confirmed by ZICTA, there is no restriction on the number of mobile sim connections that an individual can own per MNO. Multiple device ownership by individuals also heightens multi-simming within and across MNOs. The results show that 17.4% of subscribers on Airtel have more than 1 sim connection each, with 15.8% and 1.6% of the subscribers having 2 and 3 sim connections respectively. MTN has 16.6% of subscribers with more than 1 sim connection, with 15.2% and 1.4% of the subscribers having 2 and 3 sim connections respectively. ZAMTEL has the least internal multi-simming, with 7.9% of the mobile subscribers having more than 1 sim connection while 6.6% and 1.3% having 2 and 3 sim connections respectively. 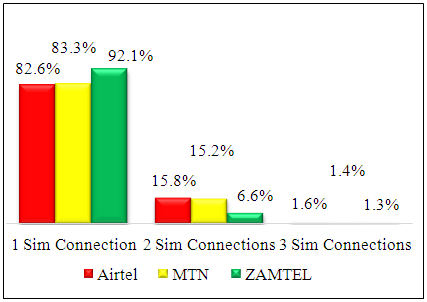 | Figure 5. Internal Multi-Simming |
The variations of Figure 5 can be explained in terms of the reasons that mobile subscribers indicated as prompting them to have multiple sim connections within MNOs. About 49% of the mobile subscribers indicated that they would use MTN for both voice and data services because it has better voice services quality, good network coverage and fast data browsing speeds. About 37% of subscribers indicated that they would use Airtel for both voice and data because it has good voice services quality, good network coverage, fast data browsing speeds as well as good and consistent promotions. About 14% of the population indicated that they would use ZAMTEL for both voice and data services because it is cheap, has fast data browsing speeds and good promotions. The 700 mobile subscribers interviewed in this study had 1,402 sim connections. Analyzing these sim connections as separate from their owners, MTN has the highest proportion in terms of sim connections, followed by airtel and lastly ZAMTEL with 1,172; 862 and 823 sim connections respectively. This result shows that subscribers may own multiple sim connections even within a particular MNO. The operators have many sim connections, but only 82.6%, 83.3% and 92.1% of the subscribers for Airtel, MTN and ZAMTEL respectively have only one sim connection.The results in Figure 6 show that for the 700 subscribers interviewed in this survey, 18% were exclusively subscribed to MTN, 16.1% were exclusively subscribed to Airtel and 3% were exclusively subscribed to ZAMTEL. The rest of the subscribers were subscribed to services for either two or all three MNOs. Figure 6 addresses external multiple sim ownership per individual subscriber across MNOs. This is in contrast to Figure 5, which analyses multiple sim ownership within MNOs. For example, if a particular subscriber owns 3 sim connections for MTN, 1 sim connection for Airtel and 2 sim connections. Under Figure 5, this subscriber will be part of the 1.4% that own 3 sim connections for MTN, part of the 82.6% of subscribers for Airtel that own 1 sim connection and part of the 6.6% of subscribers in ZAMTEL that own two sim connections. This however is a single subscriber, hence in Figure 6, this subscriber will be among the 15.6% of individuals that are subscribed to services for all three MNOs. 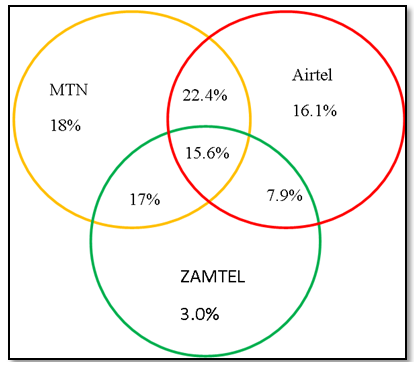 | Figure 6. External Multi-Simming |
This information becomes very useful when determining the approximate number of actual subscribers at MNO and national levels. Figure 7 amplifies the results of Figures 5 and 6 by presenting average number of sim connections certain age groups own regardless of whether it is internal or external multi-simming. The results show that most of the population aged between 36 and 55 have at least 2 sim connections each. Individuals below the age of 15 have an average of one sim connection each. 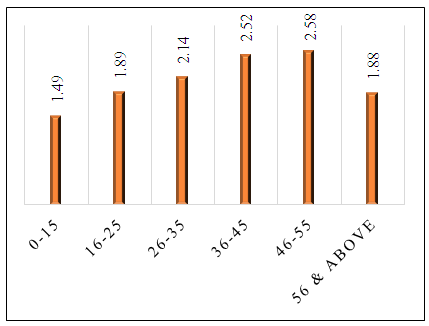 | Figure 7. Actual Sim Connections Owned per Subscriber by Age Group |
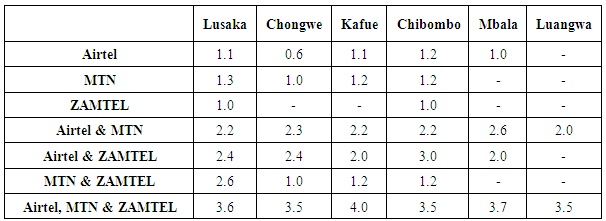
For the 700 samples done in the six districts with proportions as stated in Table 3, the average number of sim connections at district level was determined as shown in Table 4. In Luangwa district for example, all subscribed interviewed are multi-simming. The last row of Table 4 shows that in each district, there’s a proportion of subscribers with at least 3 sim connections each. Table 4. Average Number of Sim Connections at District Level
 |
| |
|
There were many reasons given as to why subscribers own two or more sim connections; about 41% of mobile customers stated that the cost of mobile services in Zambia is high, hence, they own multiple sim connections to cut down on costs such as off net calls. Poor customer service, promotion seeking, poor network quality and lack of operator’s products on the market followed with 31%, 29%, 9% and 5% of the population feeling that these factors prompted them to have multiple sim connections.The information of Figure 7 and Table 4 become very cardinal in determining the average actual mobile subscriber penetration rate in Zambia. Using projections on population growth at national level per age group or district, the predictions for approximate number of actual mobile subscribers can be made. This study uses approximated average annual population growth to extrapolate the average ratio of average actual mobile subscribers.
5.2. Mobile Penetration Rate Projections
5.2.1. Population Segmentation Using Average Number of Sim Connections Owned
To make the projections for mobile penetration rate up to the year 2030, there are four sets of data used for this exercise;i) The proportion of the population subscribed to mobile services per age group determined from results of the survey done on 700 subscribers as shown in Figure 8.ii) The average number of sim connections per age group determined during the survey as shown in Figure 7.iii) Projections of the national population by age group as projected by CSO.iv) Total number of mobile connections (or sim connections) as reported by ZICTA and the mobile network operators via surveys and publications as shown in Table 2.Using Equation 2, the average number of actual mobile subscribers were determined as in section 5.2.3. The approximated actual mobile subscribers in the country are based on assumptions that the population growth is as of the 2010 census data in terms of proportion by age. The data used was done at age level by approximating the population that would subscribe to mobile services in each age group as presented in Figure 8. 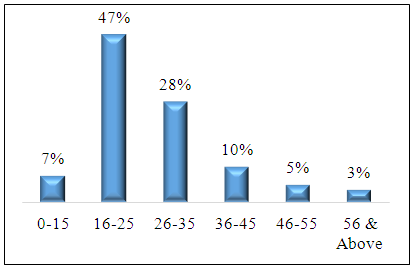 | Figure 8. Proportion of the Population Subscribed to Mobile Services |
The results of the survey were summed up and analyzed in terms of the average sim connections owned as shown in Figure 7. Section 5.2.2 shows as an example, how the total mobile sim connections were determined for the year 2015.
5.2.2. Determining Total Mobile Sim Connections
Mobile sim connections were determined using the method that ZICTA uses as in Equation 5, which is also called the ZICTA method in this paper [5]. | (5) |
Using National mobile sim connections penetration rate and National population from Table 2 for the year 2015;Total mobile sim connections =70.6% * 15,473,905Total mobile sim connections = 10,925,107.
5.2.3. Determining the Actual Number of Mobile Subscribers for Zambia
Using Equation 2 and data presented in Figure 7, the actual mobile subscribers were determined as demonstrated in the example below;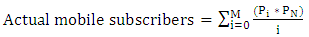
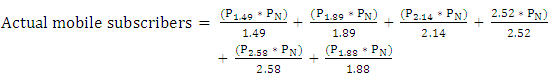 Using proportions of age as presented in Figure 8, Total national population as presented in Table 2 and the Total Mobile sim connections determined in 5.2.2, the number of actual mobile subscribers was determined as follows;
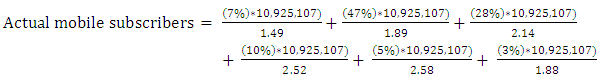

5.2.4. Determining the Actual Mobile Subscriber Penetration Rate for the Years 2010 to 2030
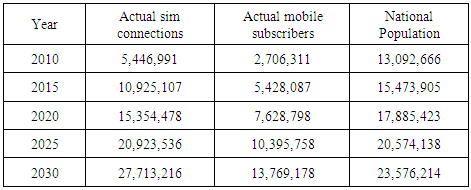
Using the actual mobile subscribers determined in 5.2.3, the national population shown in Table 2 and Equation 3, the actual mobile subscriber penetration rate in Zambia was determined as described below; Actual mobile subscriber penetration rate = 35% for the year 2015.Using the methods outlined in sections 5.2.1 up to 5.2.3, the actual mobile subscribers for the years 2010, 2015, 2020, 2025 and 2030 were determined as presented in Table 5.
Table 5. Actual Mobile Subscribers and Population Projections [15]
 |
| |
|
The data presented in Table 5 was then used in Equation 1 to determine the mobile penetration rate as presented in Figure 9.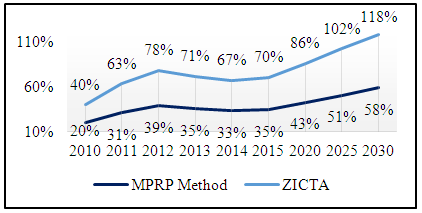 | Figure 9. Projections of the Zambian Actual Mobile Subscriber Penetration Growth |
The ZICTA sim connections penetration rates of 40%, 70.6%, 86%, 102% and 118% were used for the years 2010, 2015, 2020, 2025 and 2030 to determine actual sim connections of 5,237,066; 10,925,107; 15,354,478; 20,923,536 and 27,713,216 for these years respectively. ZICTA reports that in 2010, the mobile sim connection rate stood at 40% for Zambia. Results of the MPRP method have shown that the actual mobile subscriber penetration rate stood at 20%. Compared to 2012, the years 2013 and 2014 saw a drop in mobile penetration rate for both the MPRP and ZICTA methods. This was due to the sim registration exercise, which the MNOs embarked on as required by the regulator.
6. Conclusions
The MPRP method used in this study shows that the actual mobile subscriber penetration rate for the year 2010 was about 20% in Zambia. This rate has been determined using information on projected population growth from CSO and the approximate number of sim connections that subscribers have for different age groups.From the findings of the study, on average, every mobile subscriber owns more than two sim connections. The age groups of 0 to 35 and above 56 years of age own two sim connections each, while the ages ranging from 36 to 55 own about three sim connections each. This implies that the actual mobile penetration rate would be about half or less of the mobile connections rate in a population. The result of the MPRP method contrasts the projections made by ZICTA as shown in Figure 9, but makes sense analytically considering the fact that mobile subscribers on the Zambian mobile telecommunication market own about 2 sim connections each on average. The MPRP method uses actual mobile subscribers instead of sim connections as used by ZICTA.The approximated number of actual subscribers is 5,428,087 as of the year 2015. Although the two leading mobile operators reported their mobile subscriber base around 5,200,000 and 5,400,000, about 43.7% of mobile subscribers use services for two MNOs while about 15.6% use services for all there MNOs. This implies that only 40.7% of the population subscribed to mobile service use one MNO exclusively. Hence, at national level, the actual mobile subscriber base would be lower than the average subscribers that the individual MNOs would be reporting.The results presented in Figure 9 show that the actual subscriber mobile penetration rates are 20%, 35%, 43%, 51% and 58% for the years 2010, 2015, 2020, 2025 and 2030 respectively while the mobile sim connection rates determined and projected by ZICTA are 40%, 70.6%, 86%, 102% and 118% for the same years. The actual mobile subscriber penetration rates are expected to fluctuate in rhythm with changes in the national population projections done by CSO and changes in the mobile sim connections penetration rate as projected by ZICTA.
7. Limitations and Recommendations
This study estimates the mobile penetration rate with no regard to factors in the external environment. The assumption is that the mobile penetration rate only fluctuates in resonance with the population growth or decline of Zambia and few demographic parameters related to projections done by CSO up to the year 2030. The factors considered in this study do not address all factors that may have an impact on growth or decline of the mobile penetration rate. As Doshi and Narwold [2] show, mobile penetration rate fluctuates in rhythm with dynamics surrounding other demographic, economic, social and political factors in almost every region [2]. An extensive study, that considers how other social and economic parameters affect mobile penetration rate would be highly useful for mobile operators, current and prospective investors in the Zambian mobile telecommunications sectors, as well as ZICTA. The results in Figure 9 have two assumptions for the years from 2010 up to 2030; the first is that the ratio of mobile subscribers having two and three or more sim connections remains constant as presented in Figure 8. A study that factors in how variances in population growth would alter the patterns established in Figures 7 and 8 would add a lot of value.
ACKNOWLEDGEMENTS
I wish to render my gratitude to my supervisor, Dr. Simon Tembo. This research took shape and allowed me to work on it tirelessly because of his great encouragements and support. Many thanks to the three mobile network operators in Zambia namely Airtel, MTN, ZAMTEL and the regulator, ZICTA. I wish to thank my family and all respondents to the surveys done, for the selflessness and support they accorded me. Your names cannot fit in a paragraph, but your contributions, in word and deed, have great magnitude and significance to the success of this research.
References
| [1] | GSMA, "The Mobile Economy," GSMA Intelligence, 2014. |
| [2] | K. P. Doshi and A. Narwold, "Determinants of Mobile Phone Penetration Rates in Asia and Africa: A Panel Data Analysis," in Proceedings of 9th International Business and Social Science Research Conference, Dubai, 2014. |
| [3] | K. Andersson, D. Gollerz and B. Hansen, Mobile telephony in emerging markets: the importance of multi-simming customers, Norway, 2015. |
| [4] | "17th Report - Annual Report and Analysis of Competitive Market Conditions With Respect to Mobile Wireless, Including Commercial Mobile Services," Federal Communications Commission, Washington DC, 2014. |
| [5] | "ICT Investiment Profile," Zambia ICT Agency (ZICTA) & Zambia Development Agency (ZDA), Lusaka, 2015. |
| [6] | "Belgian Institute of Postal Services and Telecommunications (BIPT)," Belgium, 2014. |
| [7] | S. Habeenzu, "Zambia ICT Sector Performance Review," Zambia Information Communication and Telecommunications Agency (ZICTA), Lusaka, 2010. |
| [8] | J. Gillet, "Measuring mobile penetration - Untangling subscribers, mobile phone owners and users," GSMA Intelligence, 2014. |
| [9] | "ICT Survey Report - Households and Individuals," ZICTA, CSO, Republic of Zambia Ministry of Transport and Communications, Lusaka, 2015. |
| [10] | J. Munsaka, "ICTD4 - Challenges and Opportunities in Zambia," JSM Business Consultants, Lusaka, 2009. |
| [11] | GSMA, "The Mobile Economy," GSMA Intelligence, 2015. |
| [12] | J. Jonker and B. Pennink, The Essence of Research Methodology: A concise guide for Master and PhD students in Management Science, New York: Springer Heldelberg, 2010. |
| [13] | C. R. Khotari, Research Methodology Methods and Techniques, 2 ed., New Dehli: New Age International Publishers, 2004. |
| [14] | S. Rajasekar, Research Methodology, Tamilnadu, India: School of Physics, Bharathidasan University, 2014. |
| [15] | Government of the Republic of Zambia, "2010 Census of Population and Housing - Volume 11: National Descriptive Tables," Central Statistical Office, Lusaka, 2012. |
| [16] | J. Aker and I. Mbiti, "Mobile Phones and Economic Development in Africa.," Journal of Economic Perspectives, vol. 24, no. 3, pp. 207-232, 2010. |
| [17] | "Achievements of the Ministry of Communication and Information Technology in 2010," Ministry of Communication and Information Technology, Afghanistan, 2011. |

 Abstract
 Reference
 Full-Text PDF
 Full-text HTML