-
Paper Information
- Previous Paper
- Paper Submission
-
Journal Information
- About This Journal
- Editorial Board
- Current Issue
- Archive
- Author Guidelines
- Contact Us
Microeconomics and Macroeconomics
p-ISSN: 2168-457X e-ISSN: 2168-4588
2016; 4(1): 17-27
doi:10.5923/j.m2economics.20160401.02

Factors Influencing Mobile Telecom Service Access and Usage in Cape Coast, Ghana
 Abstract
 Reference
 Full-Text PDF
 Full-text HTML
Christian Kyeremeh 1, James Dickson Fiagborlo 2
1School of Business and Management Studies, Sunyani Polytechnic, Sunyani, Ghana
2Department of Liberal and General Studies, Ho Polytechnic, Ho, Ghana
Correspondence to: Christian Kyeremeh , School of Business and Management Studies, Sunyani Polytechnic, Sunyani, Ghana.
| Email: |  |
Copyright © 2016 Scientific & Academic Publishing. All Rights Reserved.
This work is licensed under the Creative Commons Attribution International License (CC BY).
http://creativecommons.org/licenses/by/4.0/

The study sought to investigate the factors influencing mobile telecom services access and usage in Cape Coast metropolis in the Central Region of Ghana by addressing the following question: What are the main factors that influence the access and usage of mobile telephone services? Primary data were collected from 200 subscribers and non-subscribers of mobile telecom services. The logit model was employed to identify the factors influencing mobile telecommunication services access. The results of the study showed that the probability that an individual will subscribe to a mobile telecom is dependent on income, price of mobile service, employment and education. It is recommended that a mobile number portability system should be introduced in the mobile telecom industry to reduce the lock-in effect currently prevailing in the industry. Also, efforts should be made to provide employment opportunities to individuals to enable them use more mobile telecom services.
Keywords: Mobile telecom service, Access, Usage, Cape Coast
Cite this paper: Christian Kyeremeh , James Dickson Fiagborlo , Factors Influencing Mobile Telecom Service Access and Usage in Cape Coast, Ghana, Microeconomics and Macroeconomics, Vol. 4 No. 1, 2016, pp. 17-27. doi: 10.5923/j.m2economics.20160401.02.
Article Outline
1. Introduction
- Access to information and communication technology is considered important to a sustainable agenda of poverty reduction because it increases the efficiency and competitiveness of a country in the global economy, enables better delivery of health and education services and creates new sources of income and employment (World Bank, 2006). It has also been emphasized that mobile telecommunication is one of the most convenient means of communicating and transacting business. An effective mobile telecommunication system, in one way or the other, enhances development as it also boosts investor confidence and promotes business transactions (Gyimah-Brempong & Karikari, 2007). In Ghana, reforms in the telecommunication sector carried out in the 1990s and 2000s contributed immensely towards the transformation of telecommunication services. The reforms were designed to introduce privatization, liberalization and competition into the telecommunication industry. They were also aimed at accelerating the modernization and the expansion of the industry as well as improve customer satisfaction through improvement in the quality of service and efficiency of the sub-sector (ISSER, 2001). As a result, mobile telecommunication network companies entered the telecommunication industry providing mobile telecommunication services. The number of mobile telephone service subscribers has increased in recent times. From as low as 2,392,000 subscribers in 2005, mobile subscribers reached 15,108,916 in 2009 (National Communication Authority, 2010). Despite the increasing number of subscribers, the use of mobile telephone services in the country is still limited. Also, the phenomenon of multiple subscriptions whereby some people own more than one mobile line is common in Ghana. Whereas the above analysis enriches our knowledge concerning subscription trend, studies into the demand for mobile telecommunication services in Ghana are scarce. Moreover, issues concerning subscription behaviour and consumers’ expenditure on mobile telecom services have not been given much attention. This paper seeks to bridge this gap by addressing the following question: What are the main factors that influence the access and usage of mobile telephone services? The study will be useful to both the service providers and the regulatory authorities. It will help service providers to come to grips with the key factors that affect the demand for their services and therefore enabling them to tailor their services appropriately in order to increase their subscriber base as well as profits. The regulatory authorities will also be abreast with consumers’ behaviour and perception towards mobile telecommunication services. This will enable them to come out with policies that promote the welfare of consumers and also ensure efficient and reliable telecommunication services delivery in the country. The paper is organized as follows: Section 2 presents a review of related literature for the study. Section 3 discusses the methodology. In this section, we outline the main analytical framework and the empirical model, estimation procedure and the data collection. Section 4 outlines and discusses the results from the statistical analysis. Section 5 concludes the paper and provides recommendations.
2. Literature Review
- Individuals access mobile telecom service for personal communication and other uses. Usually, before mobile telecom service can be used, an individual has to subscribe to a telephone network. According to Verkasalo (2008), subscription to a mobile telecom network requires decision making on the part of the individual who decides whether or not to use mobile telecom service. The subscription decision is usually based on the perceived benefits and costs associated with subscription. It is assumed that when the perceived benefits associated with subscription are greater than the costs of subscription, individuals will subscribe and use mobile telecom service. However, if cost of subscription is more than the perceived benefits, individuals will not subscribe and use mobile telecom service. Verkasalo (2008) also indicated that the consideration to access mobile telecom service is based on how the service meets the needs of individuals. According to him, needs are inborn in individuals and they tend to direct their behaviour. One way of fulfilling these needs is to purchase a good or service and use it and in the case of mobile telecom services become subscribers and use the service. According to Loebbecke (1995), cost of using mobile service is critical factor that influences the use of mobile service. Costs of using mobile service include cost of acquiring the line, price of the mobile phone, and cost of usage per minute. Cost of mobile usage can also be viewed in terms of the price for calls within the same network and calls to other networks. A number of studies have looked at the demand for access to telecommunication services, however much of these studies have focused on developed countries. One of the first studies on telephone demand was by Bell Canada (1986). The study examined household telephone demand using data collected by Statistics Canada. A set of economic, demographic and regional variables were included in the model estimated in the study. The main economic variables included in the model were price and income. The other variables considered in the study were age, education, employment and marital status. The results of the study showed that the likelihood of telephone subscription increases with individuals’ income, age, education and self-employment. In another study in Canada, Bodnar, Dilworth and Iacono (1988) analyzed telephone service subscription using household level data. They employed the logit model to examine the relationship between telephone service subscription and socio-economic and demographic variables. The results from their study showed that the probability of subscribing to telephone services was related to a number of socio-economic and demographic factors. Access price, income, education and occupation were significant in explaining demand for access to telephone service. The findings from this study confirmed the results of similar studies by Duffy-Deno (2001), Sung and Cho (2001), Rodriguez-Andres and Perez-Amaral (1998), and Salvason and Bondnar (1995). They found that income and education positively influenced household’s telephone service subscription. The impact of access price on telephone service was negative. They argued that when access rates charged by telephone service companies are reduced more people get connected to telephone services. In the same vein, households with higher incomes were more likely to subscribe to telephone service than those with relatively lower income. They advocated that lower income earners should be given subsidies as a way to achieve universal telephone service. In United Kingdom, Gassner (1998) estimated demand for access to telephone services based on household data. She modeled household telephone subscription decision in a discrete choice framework in which the telephone service decision was related to cost of connection, income and a host of other socio-demographic factors. The binary logistic regression approach was used. The study found that cost of connection, income, education and employment status significantly determined telephone subscription. In Korea, Ahn (2001) investigated demand for subscribing to mobile network based on a survey data. The study analyzed the characteristics of mobile subscribers and how these characteristics influenced their mobile subscription decisions and intentions. He found that age, gender and education had significant impact on mobile telephone services subscription behaviour. Income was used as a control variable and for that matter its impact on mobile telephone service was not directly looked at in the study. The results for age and gender were in contrast to the findings of Narayana (2005) who found insignificant results for age and gender.In a similar study, Rodini et al. (2003) examined the impact of individual household demographic profile on the demand for mobile telephone service in a discrete choice framework based on household survey data. Household mobile telephone service subscription was modeled using logistic regression. They found income, age, gender of the household head and size of household as important determinants of mobile telephone services subscription. For levels of income, individuals in the highest-income group had subscription rate of almost 40 percent higher than individuals in the lowest-income group. Also, women were 9 percent more likely to subscribe to mobile telephone services than men. They discovered that subscription probability among oldest households was 20 percent lower than for the youngest households. Ida and Koruna (2005) studied demand for mobile telecommunication services in Japan using cross-sectional survey data. The study analysed consumer’s revealed preferences regarding mobile telephone subscriptions with emphasis on the differences between two types of mobile telecom services: Second generation (2G) services and third generation (3G) services. Using discrete choice model (mixed logit model), the study discovered that demand substitutability among alternatives was stronger within the provider nest category than within the standard nest category. In addition, substituting one service with another was more common within the same provider than another provider. They observed that many mobile telephone subscribers were less willing to change their current providers simply because of switching costs, which acted as a barrier to regular change of mobile network. In Nigeria, Olatokun and Bodunwa (2005) analysed mobile telecommunication demand by examining usage of Global System for Mobile Communication (GSM), emphasizing the factors that promote or hinder its use, usage benefits and quality of services provided by operators. Using a sample of 456 staff and students of University of Ibadan, the study found that social activities (e.g. contacting friends and relations) accounted hugely for the use of mobile telecommunication services. Mobile telecom services were less used in research and academic activities. The study identified that limited network coverage and poor quality of service (i.e. unstable network and difficulty in making and receiving calls) inhibited effective use of mobile telecom services. The study concluded that mobile telecom networks that provided quality service to customers stand a better position to acquire more subscribers. Another study by Huang (2007a) investigated demand for mobile telecommunication services under non-linear pricing in Taiwan. Using cross-sectional expenditure survey data, the impact of nonlinear price schedule on consumer behaviour was analyzed with preference-based structural model. The study found that consumers differed vertically in the utility of using cellular services even after controlling for income variations. Demand for mobile telecommunication services was found to be positively related to income. Moreover, Barrantes (2008) examined mobile telecommunication services use, subscription and call patterns among the urban poor in three selected cities in Peru: Lima, Trujillo (north) and Puno (southern highlands). An individual utility maximization model was adopted to econometrically test reasons for mobile telecommunication services subscription and usage. The results showed that the probability that an individual will access and use mobile telephone service was explained by individual characteristics such as age, education, occupation and type of employment; characteristics of household and use (or non-use) of other communication technologies. In India, Narayana (2009) studied determinants of demand for telecom services using household survey data. Demand for telecom services was estimated using binary logit model with socioeconomic and demographic data. For all the variables included in the model, education, occupation, size of total income and location of friends and relatives were found to be the important determinants of demand for telecom services. The literature has shown that demand for access to mobile telecommunication network is influenced by cost of mobile telephone services and individual socio-demographic characteristics.
3. Methodology
3.1. Analytical Framework and Empirical Model
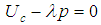
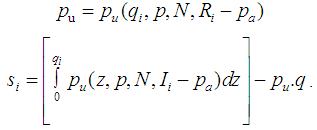
- The analytical framework for the analysis of mobile telecom service access and usage follows that of Taylor (2002). The framework is based on the consumer-choice problem and takes into account an externality that is associated with telecom service. Assuming a population is made up of M individuals, each having the utility function described by equation (1).
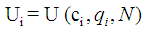 | (1) |
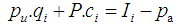
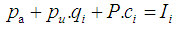 | (2) |
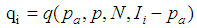
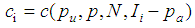
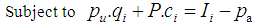 Forming the Lagrange function and applying differentiation, we obtain the following first order conditions:
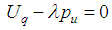 | (3) |
 | (4) |
 | (5) |
 | (6) |
 | (7) |
 | (8) |
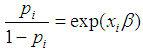
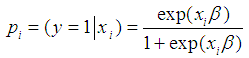 | (9) |
 From equation (9), the probability of not subscribing to mobile telecom service is expressed as:
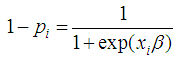 | (10) |
 | (11) |
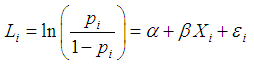 | (12) |
 | (13) |
|
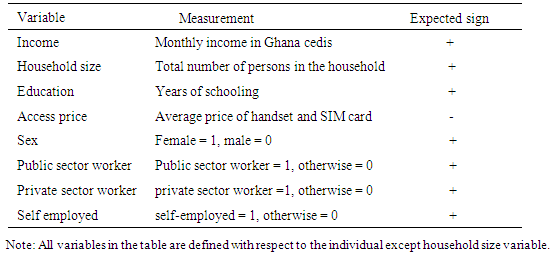
3.1.1. Justification of the Variables
- Individuals’ access to and usage of mobile telecom service are assumed to be influenced by a number of factors including income, household size, education, occupation, gender and price of access to mobile telecom network. We discuss below the justification of the main variables included in the regression model.Income is measured as the monthly income of respondents. It indicates the individual’s capacity to subscribe to and use mobile telecom services. Jha and Majumda (1999) argued that a greater income signify a greater affordability and so lead to an increased demand for mobile telecommunication service. The role of income in the demand for telecom service is well noted in the literature. Studies that find income to influence the demand for telecom services are Trotter (1996), Agiakoglou and Yannelis (2006), Lurdes and Martins (2003), Madden et al (2004), Garin-Munoz and Perez-Amaral (1998), Huang (2007b), Das and Srinivasan, (1999) also Iimi (2007) also argued that as income increases more people could afford telecommunication services. The coefficient of the income variable is expected to be positive. Theoretically, price variable should be one of the principal determinants of demand for a consumer good or service such as mobile telecommunication service. Mobile telecommunication service use requires subscription to telephone network. Handset is an important factor in the access to mobile telecommunication network. For this reason, price of handset together with cost of SIM card is taken to be the cost of subscription to the mobile telecommunication services. Economists assume a relationship between price and demand for a good or service. As a result, we expect a negative relationship between price variable and mobile telecom service subscription. The household size is the number of persons in a household. Household size is included in the model to examine the possible interactions among members of the household that facilitate or increase the need for communication. We assume that larger households would have a greater need for communication which could be satisfied through the use of mobile telecommunication services. Thus, the demand for mobile telecommunication service will be higher, the larger the household size. Huang (2007b), Narayana (2009), and Hausman (2002) are among the studies that included household size in their models for mobile telecom service use. Education of respondents is measured as years of schooling. The education variable is included in the model to examine whether educated individuals are more inclined to use mobile telecommunication services than less educated ones.Education enlightens an individual and influences his or her consumption as well. It plays a vital role in dispelling a negative perception about a product or service thereby enhancing its adoption and use. In addition, most of the time, people get a lot of friends and other contacts in school and the need for communication become imperative. It has also been recognized that the higher the level of one’s education the less likely he or she will be digitally poor. Therefore, we expect an education to impact positively on the adoption and use of mobile telecommunication services. Sex is included as an explanatory variable to examine the effect of sex on the demand for mobile telecommunication service. Studies have found that men and women adopt and use technology differently. Men’s decisions to use technology are more strongly influenced by their perception of usefulness, while women’s decisions are based more on perceptions of the technology’s ease of use (Venkatesh & Morris, 2000). It is a dummy variable taking on the value of 1 if the respondent is a female and 0 if the respondent is a male. Ahn and Lee (1999) and Huang (2007a) are among the studies that included sex as a variable in the mobile telephone subscription model. An employment type is included to examine the effect of one’s work on the need to subscribe for mobile telecommunication services. The Ghana Statistical Service in its Ghana Living Standard Survey (GLSS) classifies an employment type as follows: public sector employee, private sector employee, self employed and unemployed. Three employment type categories: Self-employed, public-sector and private-sector workers, were used in the study to ascertain the category of workers that has the greatest likelihood of subscribing to mobile telecom services. Barrantes (2008) and Huang (2007b) are among the studies that used an employment as a variable in their models for telecommunication service subscription.
3.2. Estimation Procedure
- The commonly used technique for estimating models with a binary dependent variable such as logit is the Maximum Likelihood Estimation (MLE). This technique was employed to estimate the parameters in the logistic regression model. The method of the maximum likelihood consists of estimating the unknown parameters in such a manner that the probability of observing the dependent variable is as high as possible (Gujarati, 2006). It is possible to show that unique maximum exist for the binary logit model. Pindyck and Rubinfield (1991) argued that a Maximum Likelihood Estimation yields consistent parameter estimators. Thus, the MLE would produce the most likely value to the parameters given our sample data. The marginal effects of the explanatory variables on the dependent variable were determined after the estimation of the parameters. These effects enabled us to identify the variables that had the greatest influence on mobile telecommunication subscription at the margin.
3.3. Data Collection
- The data used for the study were mainly primary data collected from individuals randomly selected from Cape Coast Metropolis. The main instrument used for data collection was questionnaire. The questionnaire was structured with open and closed-ended questions to ensure that sufficient responses were collected from respondents. The instrument was chosen because it is less expensive to administer and could be self-administered or presented in an interview format to offer respondents the opportunity to respond to the questions at their own convenient time. It could also be used to generate both qualitative and quantitative data and assures respondents of anonymity. The instrument was pretested on 10 individuals and the responses led to the revision of some of the questions in the instrument.In all, 210 questionnaires were sent out but 200 were completed and retrieved from the field given a response rate of 95%. The high response rate achieved was due to frequent visits to the field. Information was collected on income, employment type, education and other socio-economic variables, cost of subscription and monthly expenditure on mobile telecom service. The data were collected using four weeks from the second week in June, 2009 to the middle of July, 2009. The Statistical Product and Service Solution (SPSS) version 16.0 and Stata version 10 were used to organize and analysed the data.
4. Results and Discussion
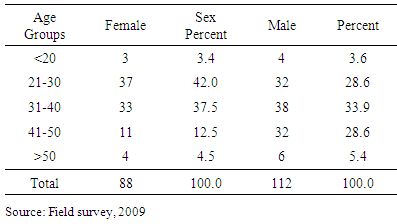
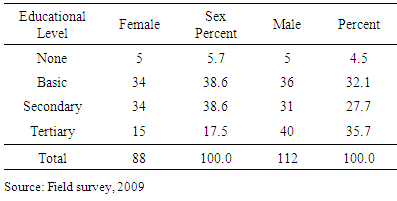
- This study used primary data collected from individual subscribers and non-subscribers of mobile telecom services in Cape Coast Metropolis. Information on individual characteristics including age, sex, educational level, type of employment, levels of income, among others were collected and analyzed in the study. The results in Table 2 show that males (112) were more than females (88). From Table 2, about 42% of the respondents in the age group 21-30 were females while the males in the same age group constituted 28.6%. The age group less than 20 had the lowest number for both males (3.6%) and females (3.4%). Generally, majority of the respondents fall into the young adult and an economically active age group from 21 to 40 representing 73.5%. The age groups 21-30 and 3l-40 had the highest number for females (42%) and males (33.9%) respectively. The mean age for a male respondent was 34 while that for a female respondent was 32.
|
|
|
|
|
|
|
|
|
5. Conclusions and Recommendations
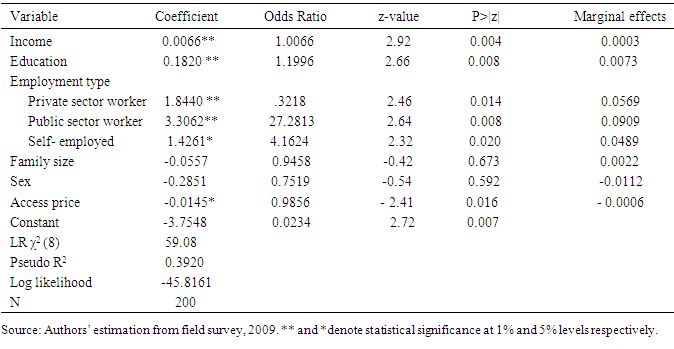
- The focus of this research was to identify the factors influencing mobile telecommunication service access and usage. The findings from the study showed that mobile telecommunication service use is explained by individual socio-economic and demographic characteristics. It was realized, consistent with literature, that demand for mobile telecom service was dependent on income, employment, education and access price. We found mobile telecom service use to be positively related to income, education, and employment type and negatively related to access price. The amount individual spent on mobile telecom serves was determined by their levels of income. Individuals used mobile telecom services to maintain relationship by contacting friends, family and partners and also used for business purpose and accessing internet. However, the use of mobile services for internet purpose was very limited and a few people used their phones to access internet. On the basis of the findings from the study, the following recommendations are made to relevant stakeholders in the telecommunication industry. Firstly, there is the need for the Ministry of Communications to reduce switching cost in the mobile telecom industry by introducing mobile number portability system. This will go a long way to reduce the lock-in effect prevailing in the mobile telecom industry that does not allow consumers to easily switch to other networks. The introduction of the mobile number portability system will also make mobile service providers to improve their service delivery to customers. Also, efforts should be made by mobile telecom service subscribers to form strong customer unions to protect their interests in the telecom industry. The formation of such unions will inure to their benefit since they can demand better services from mobile service providers. In addition, efforts should be directed at creating employment opportunities for individuals to enable them use mobile telecom service.