-
Paper Information
- Next Paper
- Paper Submission
-
Journal Information
- About This Journal
- Editorial Board
- Current Issue
- Archive
- Author Guidelines
- Contact Us
Microeconomics and Macroeconomics
p-ISSN: 2168-457X e-ISSN: 2168-4588
2016; 4(1): 1-16
doi:10.5923/j.m2economics.20160401.01

An Investigation of Current Account Sustainability in Five Asean Countries
 Abstract
 Reference
 Full-Text PDF
 Full-text HTML
Yaya Sissoko , James J. Jozefowicz
Department of Economics, Indiana University of Pennsylvania, Indiana, USA
Correspondence to: Yaya Sissoko , Department of Economics, Indiana University of Pennsylvania, Indiana, USA.
| Email: |  |
Copyright © 2016 Scientific & Academic Publishing. All Rights Reserved.
This work is licensed under the Creative Commons Attribution International License (CC BY).
http://creativecommons.org/licenses/by/4.0/

This paper examines the current account sustainability of five countries in the Association of Southeast Asian Nations (ASEAN): Indonesia, Malaysia, the Philippines, Singapore and Thailand. The ASEAN was established in 1967 to speed up economic growth and to bring about cultural growth and progress, stability and regional peace among its member countries. Greater integration makes the issue of long-term current account sustainability of these countries critical to each other’s prosperity. The paper uses the intertemporal solvency framework of Hakkio and Rush (1991) and Husted (1992) and cointegration methodology to test for a relation between exports and imports of the current account. Furthermore, we estimate this long-run relationship using dynamic OLS. The results show that Malaysia and Thailand have sustainable current account positions. Among the other countries, Singapore has a statistically significant positive relation between exports and imports, but its weakness means that Singapore continues to have a vulnerable current account position. Indonesia and the Philippines have unsustainable current account deficits. Exchange rate adjustments and macroeconomic policy reforms may be necessary to reduce vulnerabilities in external positions for these countries.
Keywords: Cointegration, Current account sustainability, ASEAN, Intertemporal solvency
Cite this paper: Yaya Sissoko , James J. Jozefowicz , An Investigation of Current Account Sustainability in Five Asean Countries, Microeconomics and Macroeconomics, Vol. 4 No. 1, 2016, pp. 1-16. doi: 10.5923/j.m2economics.20160401.01.
Article Outline
1. Introduction
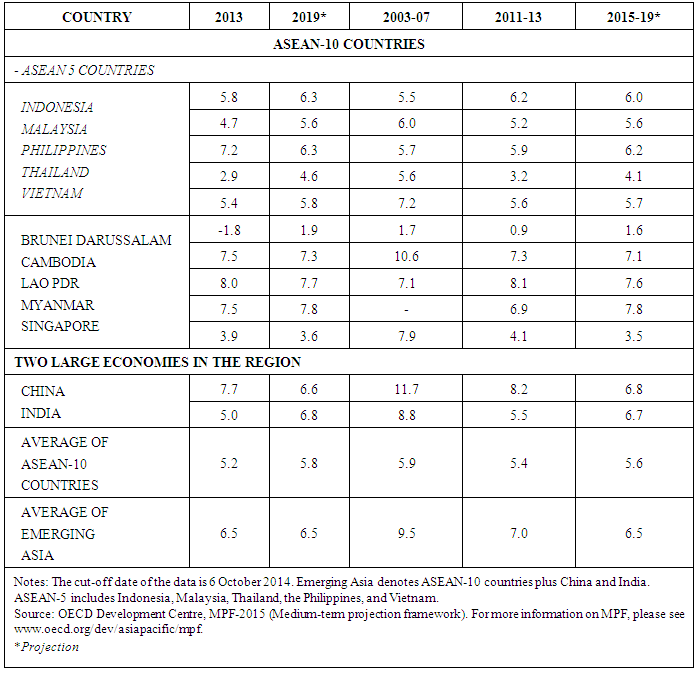
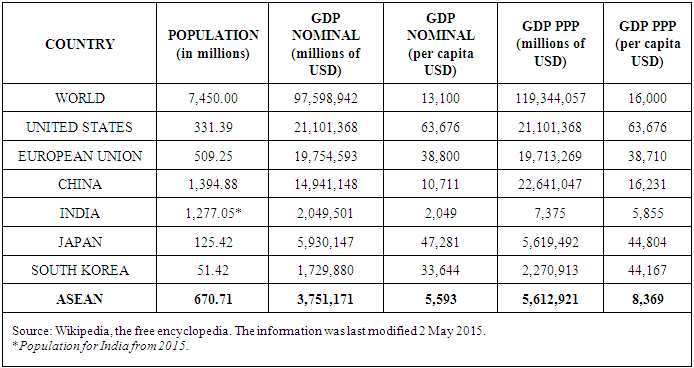
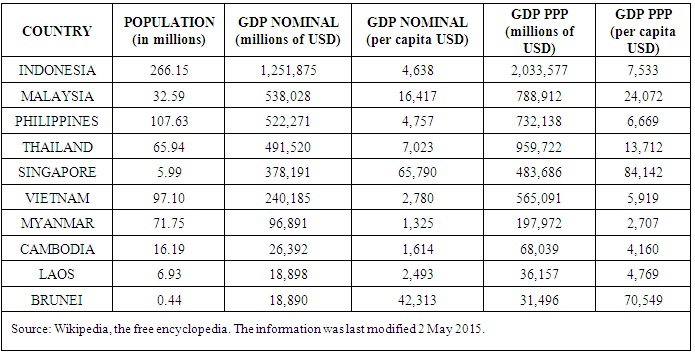
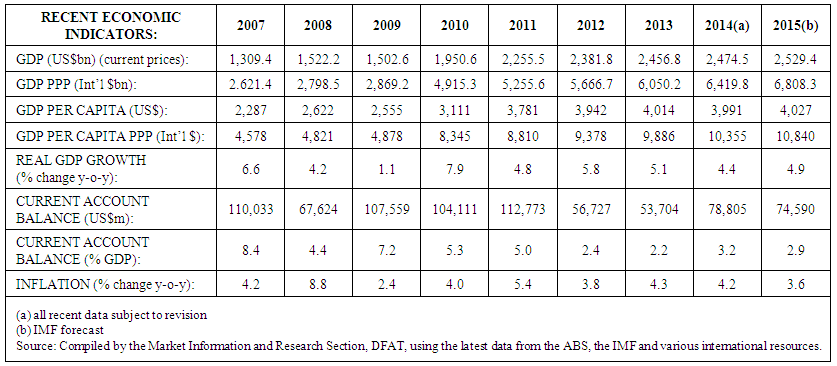
- The ASEAN (Association of Southeast Asian Nations) is comprised of 10 countries, namely Brunei Darussalam, Cambodia, Indonesia, Lao PDR, Malaysia, Myanmar, the Philippines, Singapore, Thailand, and Vietnam. The emblem of the ASEAN represents unity, friendship, and solidarity, which the founding fathers envisioned when the ASEAN was first created in 1967. Its goals were to speed up economic growth and to bring about cultural growth and progress, stability, and regional peace among the ASEAN nations. Greater integration makes the issue of long-term current account sustainability of these countries critical to each other’s prosperity. The population of the ASEAN is 670.71 million, and it accounted for approximately 9 percent of the total world population in 2014, with a nominal GDP per capita of $5,593. The ASEAN countries with the highest GDP per capita are Singapore with $65,790 followed by Brunei Darussalam with $42,313. Half of the ASEAN countries have positive current account balances as a percent of GDP. These countries include: Brunei Darussalam, Malaysia, the Philippines, Singapore, and Vietnam. In 2013, all of the ASEAN countries, except Brunei Darussalam, experienced growth. According to the projections for 2019 in Table 1, all countries are expected to display growth of some sort. Overall, the 10 ASEAN countries show positive average GDP growth, which is increased significantly when the Chinese and Indian economies are included.
|
2. Literature Review
- Current account deficits and their sustainability have been extensively studied. Holman (2001) conducted an analysis of the sustainability of the United States current account deficit and found that deficits were sustainable in the near term and unlikely to cause any disruption of the economy. Mann (2002) cautioned, however, that continuing current account deficits in the United States would result in increasingly negative net international investment. However, long-term adjustment to smaller trade deficits would be possible with the implementation of appropriate policy measures. Looking abroad, Apergis, Katrakilidis, and Tabakis (2000) revealed the presence of possible regime changes in an investigation of the current account deficit in Greece from 1960 to 1994. Their results favored the current account deficit sustainability hypothesis. Kónya (2009) empirically analyzed the current account imbalances of central European nations (e.g., Czech Republic, Hungary, and Slovenia) during the 1990-2005 timeframe and determined that the Czech Republic and Slovenia had sustainable trade imbalances. Similarly, Sissoko and Sohrabji (2010) used 1960-2006 World Bank data to examine the current account sustainability of countries in the Eastern African Community, Economic Community of Central African States, and South African Development Community. Sissoko and Sohrabji (2010) identified a sustainable current account position for Botswana, but statistically significant weak relationships between exports and imports for Uganda, Central African Republic, Congo, Rwanda, Lesotho, and Zambia. Analyzing the current account sustainability of three of the ASEAN nations from 1975 to 1995, Sathirathai (1997) determined that Malaysia, Thailand, and Indonesia had unsustainable deficits and noted that the deterioration in current account balances was underpinned by imports of capital goods rather than consumption goods. Guest and McDonald (1999) studied 1976-1997 data for Thailand, Singapore, Malaysia, Indonesia, and the Philippines. Their results indicated that Malaysia, the Philippines, and Thailand had sub-optimal current account ratios to GDP, while Singapore and Indonesia’s ratios were above-optimal due to over-saving. Baharumshah, Lau, and Fountas (2003) tested the sustainability of current account imbalances among Indonesia, Malaysia, the Philippines, and Thailand (i.e., ASEAN-4). Using 1961-1999 data, they found that all of the sample ASEAN countries, except Malaysia, had current account deficits that were not in long-run steady state in the pre-crisis (1961-1997) era. Thus, Baharumshah et al. (2003) concluded that a persistent current account deficit might serve as a leading indicator of financial crises.In summary, the existing literature includes largely dated analyses of current account sustainability for a mix of developing and developed countries around the world. The findings suggest sustainable current accounts in the United States, as well as, many European and African nations. However, the varying and outdated results for ASEAN countries, coupled with ongoing concerns over global economic prosperity due to contagion effects of the U.S. U.S. Great Recession, establish the relevance and importance of this study.
3. Background of the ASEAN
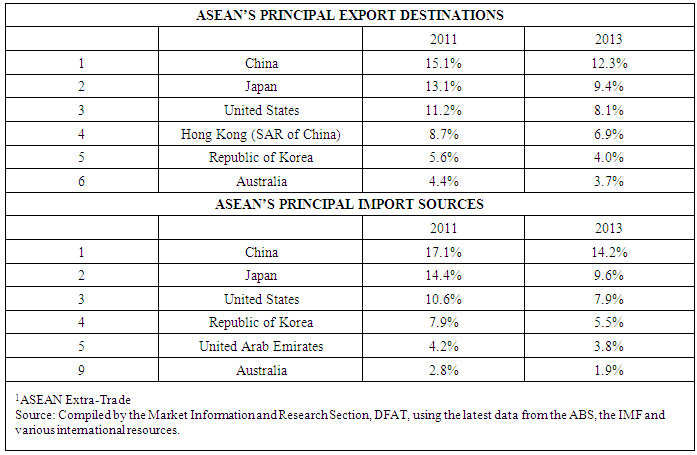
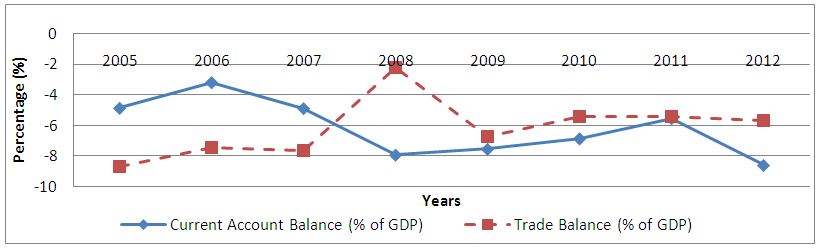
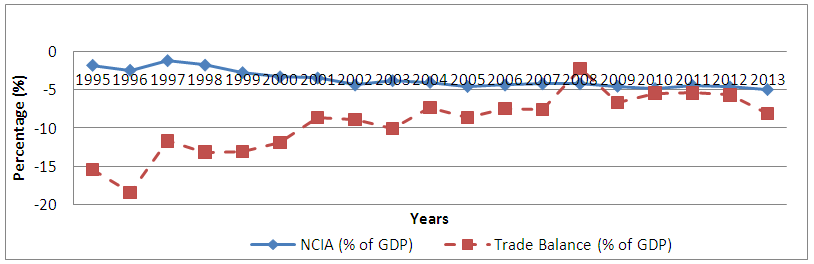
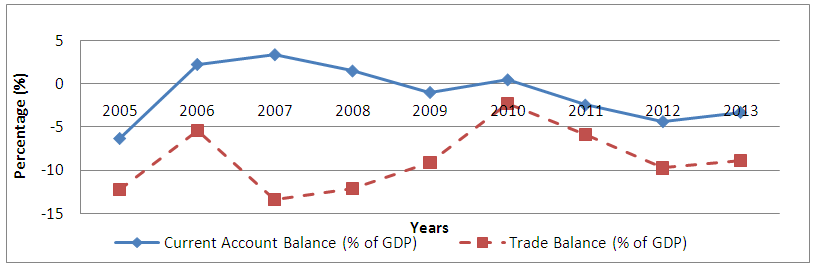
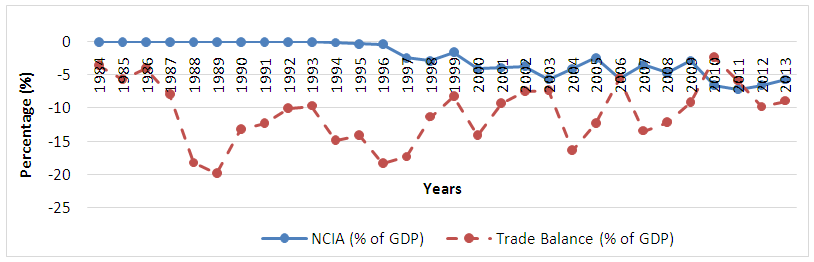
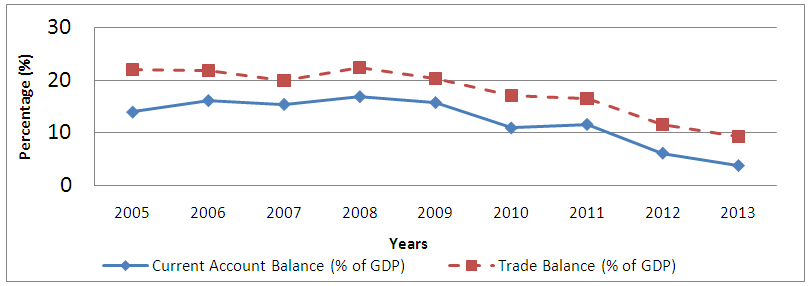
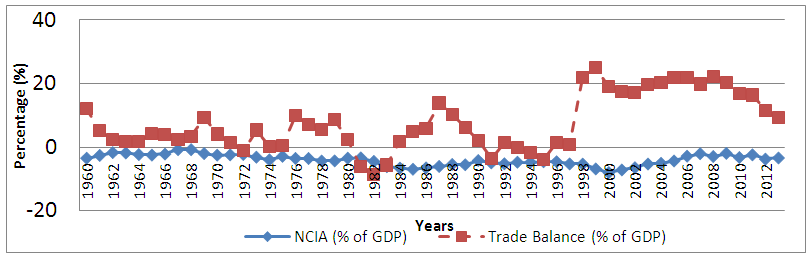
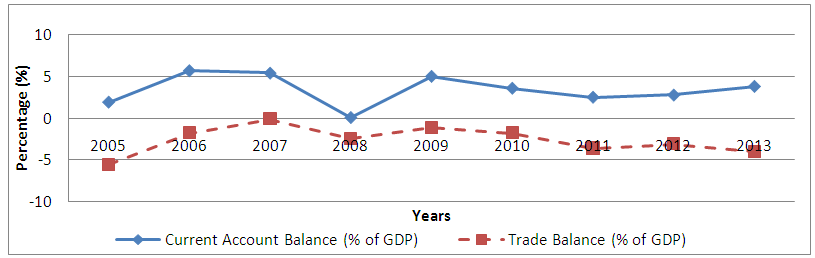
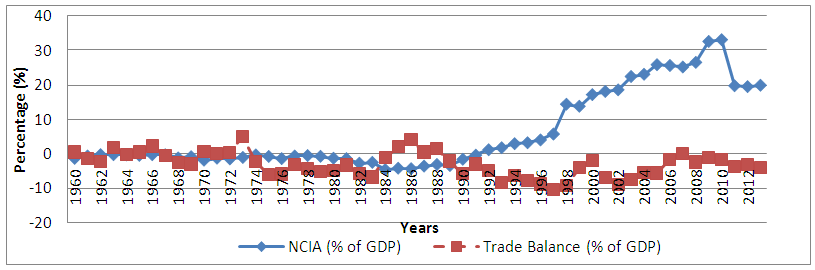
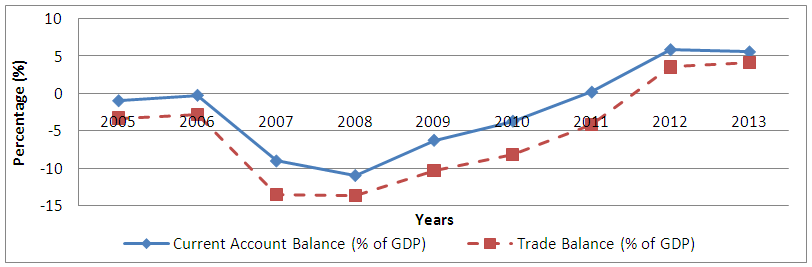
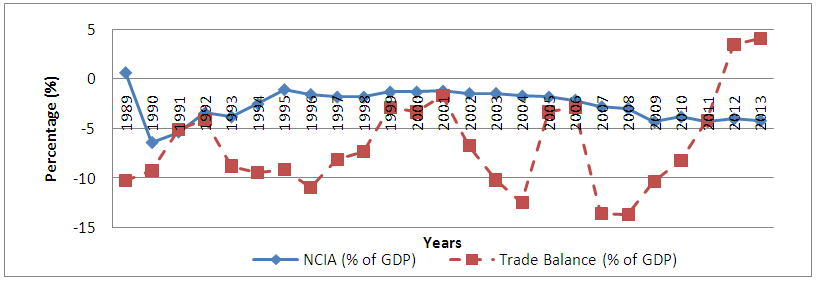
- The ASEAN-10 is the largest regional cooperative in Asia including ten countries2, with more than 630 million people and a combined GDP of more than $3.5 trillion in 2014. The external debt of the South Asian countries was $94.5 billion in 2010 according to the World Bank Report (2012). The ASEAN’s top three principal export destinations in 2013 were China, Japan, and the United States and accounted for 12.3%, 9.4%, and 8.1%, respectively. While these three nations were also the ASEAN’s principal export destinations in 2011, the shares were slightly higher. Similarly, the ASEAN’s principal import sources in 2013 were China, Japan, and the United States, with shares of 14.2%, 9.6%, and 7.9%, respectively. Again, these three countries also were the ASEAN’s principal import sources in 2011, but the percentages were a bit larger. As a percentage of GDP, the ASEAN-10’s current account balance ranged from 2.2% in 2013 to 8.4% in 2007. The average of roughly 4.5% over the 2007-2015 period falls below the threshold of sustainability of 5% of GDP as identified by Milesi-Ferretti and Razin (1996). During 2014 and 2015, Indonesia’s current account deficit was 3%, while the remainder of the ASEAN-5 nations had current account surpluses.The debt for the ASEAN countries is calculated as a sum of the debt service of four principal years: 2000, 2005, 2010 and 2014. The percent change is also given for the same years. The total debt for the Philippines is $21,167 million U.S. dollars with percent changes of 42% between 2000 and 2005, 45% for the 2005-2010 period, and -64% from 2010 to 2014. The total debt for Thailand is $45,923 million U.S. dollars for the period. The percent change was 84% between 2000 and 2005, -42% from 2005 to 2010, and 19% for the period 2010-2014. The total debt in Malaysia is $28,167 million for the 2000-2014 period with percent changes of 73%, -50%, and 272% for the respective three periods. Indonesia has a total debt of $71,024 million and percent changes of approximately 70%, 52%, and -8% for the three periods. Vietnam amasses a total debt of $6,267.2 million U.S. dollars and percent changes of approximately -49%, 118%, and 263% for the 2000-2005, 2005-2010, and 2010-2013 periods, respectively.According to Table 5, over the course of the 2007-2015 time period, the ASEAN-10 experienced real GDP growth rates ranging from a low of 1.1% in 2009 to a high of 7.9% in 2010. The average real GDP growth rate was about 5% over that timeframe. Looking ahead, the real GDP growth rate for the ASEAN-10 is projected to be 5.8% in 2019 after experiencing growth rates of 5.9% and 5.4% over the 2003-2007 and 2011-2013 periods, respectively. In comparison, China and India had growth rates of 11.7% and 8.8%, respectively, in the 2003-2007 timeframe followed by 8.2% and 5.5% real GDP growth, respectively, from 2011 through 2013. China and India are projected to experience real GDP growth rates of 6.6% and 6.8%, respectively, in 2019. In Figure 1(a), Cambodia’s trade balance skyrocketed from -7.5% to -2% in 2008 from the U.S. Great Recession, while the current account balance decreased from -3% to -8%. After the U.S. Great Recession, Cambodia’s current account balance increased again until 2012, when it decreased. Its trade deficit increased from 2009 to 2010, and then stayed relatively constant. In Figure 1(b), Cambodia’s trade deficit increased overall, but had a sharp increase in 2008 from the U.S. Great Recession. Its NCIA gradually decreased from 1995 to 2013, but it remained relatively constant from 2005 to 2013.In Figure 2(a), Indonesia experienced a decrease in trade balance from 5.5% to 1% in 2008 due to the U.S. Great Recession, and it continually decreased after 2009 to -2% in 2013. Its current account balance mimics the trade balance and had similar outcomes throughout the period, reaching 0% in 2005, 2008, and 2011 during the periods of recession. In Figure 2(b), Indonesia’s trade balance was high in 1979 because of a recession caused by an oil shock. There was another spike in its trade balance in 1997 from the Asian Financial Crisis. Indonesia’s NCIA was lowest in 1991 due to a collapse in the Soviet Union, and it decreased again in 2001 after the September 11, 2001 terrorist attack. In Figure 3(a), Lao PDR’s trade balance was lower in 2008 from the U.S. Great Recession and rose in 2010 to its highest point of -2%. Lao PDR’s current account was highest in 2006 and decreased because of the U.S. Great Recession in 2009. In Figure 3(b), Lao PDR’s trade balance spiked in 1997 due to the Asian Financial Crisis and plummeted in 2008 when the U.S. Great Recession hit. After the recession, the trade deficit decreased to -2%. Lao PDR’s NCIA gradually became negative after the Asian Financial Crisis, and it slowly recovered in 2010-2012. In Figure 4(a), Malaysia’s trade balance gradually decreased after the U.S. Great Recession, and its NCIA mimics the same trend from 2005 until 2013. In Figure 4(b), Malaysia’s trade balance was lowest in 1983 due to a recession, and it skyrocketed in 1997 from the Asian Financial Crisis. The NCIA was relatively constant throughout the timeline. In Figure 5(a), the Philippines’ trade balance rose in 2007, just before the U.S. Great Recession, and then slowly decreased from 2009 to 2013. The Philippines’ current account reached its lowest point in 2008 because of the U.S. Great Recession. In Figure 5(b), the trade balance in the Philippines was highest in 1977 due to an economic crisis and hit its low point in 1997 from the Asian Financial Crisis. The NCIA was relatively low until the Asian Financial Crisis in 1997 and then decreased again after the U.S. Great Recession in 2008. In Figure 6(a), Singapore’s trade balance decreased from 30% to 22% in 2007-2008 from the U.S. Great Recession, and recovered in 2010. Its current account balance decreased from 25% to 15% for the same reasons. In Figure 6(b), Singapore’s trade balance gradually increased throughout the period with a high point in 2007 just before the U.S. U.S. Great Recession. The NCIA was relatively constant, but it was negative in 2004 from a domestic recession.In Figure 7(a), Thailand’s trade balance hit a peak in 2007 and again in 2009 when its trade balance was 11% (recovery from the U.S. Great Recession). The current account balance had the same structure, with high points in 2007 and 2009 and a low point in 2008. In Figure 7(b), Thailand’s trade balance hit a peak in 1987 after a recession and spiked in 1997 from the Asian Financial Crisis. In 2008, the trade balance was 10% due to the U.S. Great Recession. Its NCIA was relatively constant throughout the graph. In Figure 8(a), Vietnam’s trade balance was lowest in 2008 due to the U.S. Great Recession and subsequently has been recovering. The current account balance was lowest in 2008 for the same reason and has been increasing since 2008. In Figure 8(b), Vietnam’s trade balance was low in 1997 from the Asian Financial Crisis. The trade balance hit another low point in 2003 after the September 11, 2001 terrorist attack and again in 2008 because of the U.S. Great Recession. Vietnam’s NCIA was relatively constant from 1997 until 2008 when the U.S. Great Recession hit and then decreased slightly. In 1990, the NCIA decreased quite a bit from a recession.
4. Analyzing Current Account Sustainability
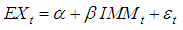
- The theoretical model for examining current account sustainability is based on Hakkio and Rush (1991) and Husted (1992). The theoretical model assumes that the amount that a small open economy borrows or lends in international markets equals the present value of the future trade surpluses. For intertemporal solvency, deficits incurred in the present period will be repaid by future surpluses. The expectation is that imports and other debits on the current account lead to increased exports, thus making current account deficits sustainable in the long run. Hence, the econometric equation to be estimated is given as
 | (1) |
 and
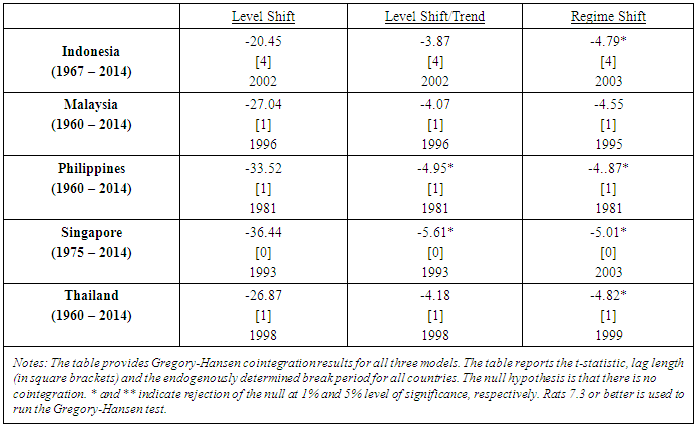
and  are cointegrated, then the long-run relationship between exports and imports can be estimated. This relationship sheds light on current account sustainability. Cointegration requires testing for stationarity. We employ several tests including Augmented Dickey-Fuller (ADF), Phillips-Perron (PP), and Kwiatkowski, Phillips, Schmid, and Shin (KPSS). If the series are integrated of order one, we can test for cointegration. Two methods for testing cointegration are used. The standard Johansen test, which employs a trace and an eigenvalue test, is first used to test for cointegration. This test assumes that the cointegrating relationship is unchanged throughout the sample period. However, it is possible that the relationship between exports and imports changes over time. To allow for that, we follow Baharumshah et al. (2003), Cook (2004), Sohrabji (2009), and Oğuş Binatlı and Sohrabji (2012) and employ the Gregory and Hansen (1996) cointegration procedure for the countries in our sample. This procedure has the advantage of endogenously determining the break point in the cointegrating relation. Gregory and Hansen (1996) consider three models with structural breaks in the cointegrating relation that we use as well. These three models are denoted as a level shift, a level shift and trend, and a regime shift. They are given as,Model with level shift
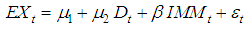 | (2) |
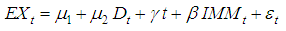 | (3) |
 | (4) |
 and
and  is the structural break point. If there is cointegration between exports and imports, the long-run relationship between them can be estimated using Stock and Watson’s (1993) dynamic OLS (DOLS) technique. DOLS incorporates the information regarding the structural break from the Gregory and Hansen (1996) procedure (referred to as the Gregory-Hansen test/procedure for the rest of the paper). In addition, DOLS includes lags and leads of the first difference of the regressors. Thus the estimated DOLS equation is given as
 | (5) |
 is imports + at the structural break point,
  is the first difference of imports+, and
  captures lags and leads of the first difference of the regressors. The relationship between exports and imports+ which is captured by
  sheds light on the sustainability of the current account. If the relationship between exports and imports is not statistically significant, then the current account deficit is unsustainable. If there is a statistically significant and strong relationship between exports and imports, then the current account position is sustainable. Between these two extremes, there is also the possibility of a statistically significant but weak relationship between exports and imports. If this is the case, we can conclude that while exports are growing in relation to imports, this growth may be insufficient to pay off accumulated debt. Thus, the current account position continues to be vulnerable. We present and analyze the empirical work on five sample ASEAN countries in the following section.
 5. Data and Results
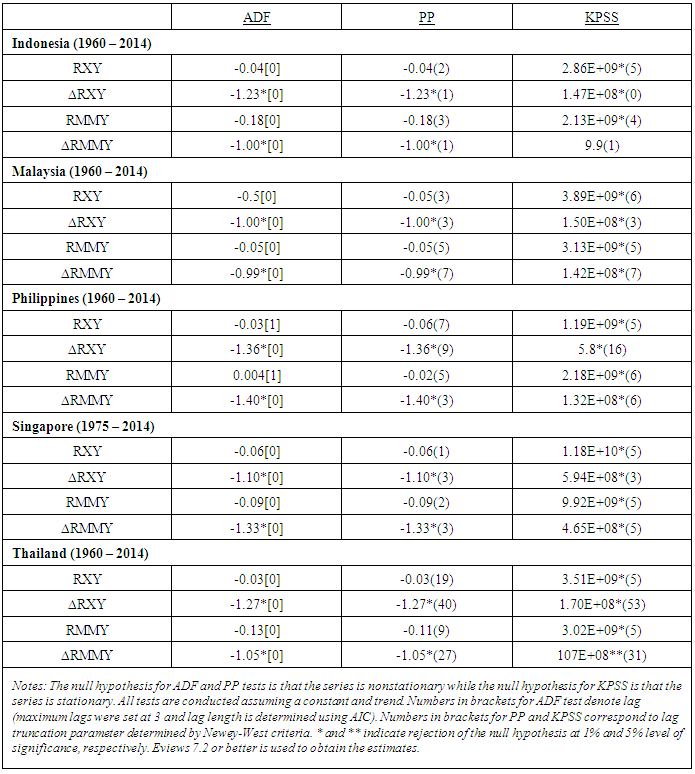
- The purpose of this paper is to analyze current account sustainability in the ASEAN countries. Due to an insufficient number of observations for other nations, we focus on five ASEAN countries including Indonesia, Malaysia, the Philippines, Singapore, and Thailand. We use annual data between the 1960s and 2014. The sample period varies depending on data availability (carefully noted in tables with results). The relation between exports and imports+ is estimated using the methodology previously discussed. The exports series includes export of goods and services, and imports + includes import of goods and services net of unilateral transfer payments and net investment income payments. Following the literature, this paper uses real exports and real imports + as a percentage of real GDP (base year of 2000) referred to as RXY and RMMY for the remainder of the paper. All data is available from the World Bank.The first step is to test for nonstationarity of the two series. Results of the three unit root tests are presented in Table 7. In general, we find that the series are integrated of order one in levels and are stationary in first differences for all countries in the sample in keeping with the results of Baharumshah et al. (2003). Nelson and Plosser (1982) aver that most macroeconomic time series are difference stationary processes. Thus, we can test for cointegration between exports and imports. As noted earlier, we use two cointegration tests, the Johansen test and the Gregory-Hansen test.
|
|
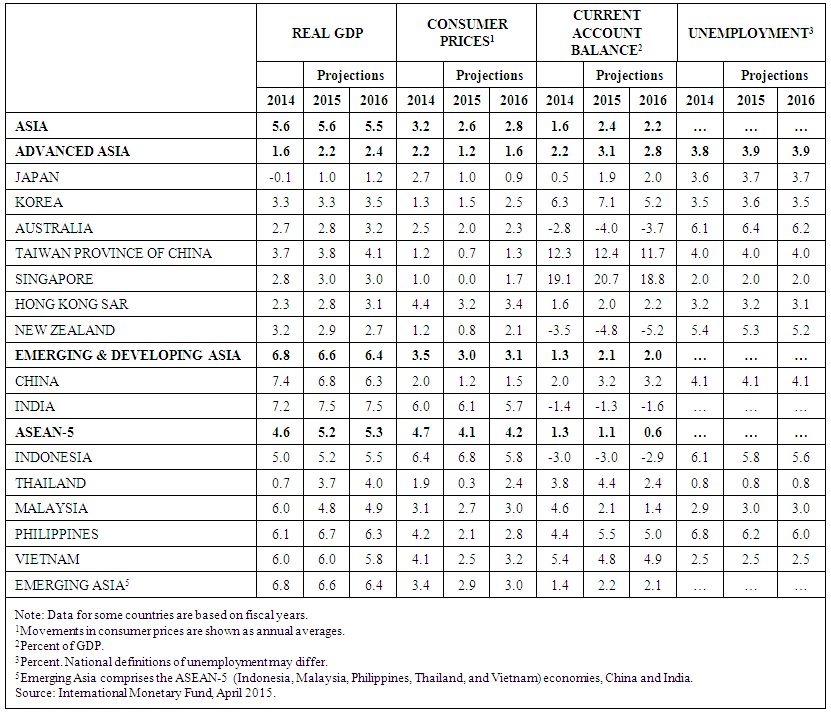 | Table 4. Asian and Pacific Economies: Real GDP, Consumer Prices, Current Account Balance, and Unemployment (Annual percent change, unless noted otherwise) |
 | Table 5. Recent ASEAN-10 Economic Indicators |
|
|
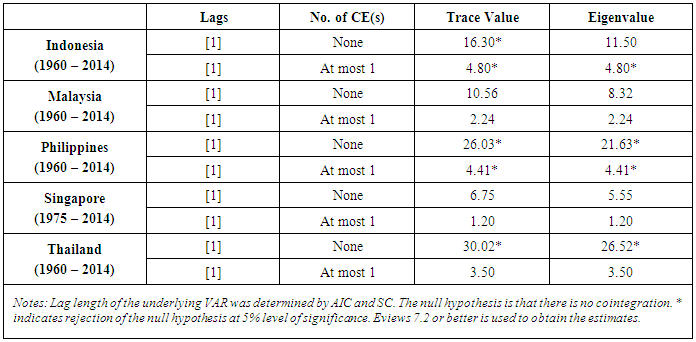
 where T is the sample size, p is the number of variables, and k is the number of lags. The adjusted results of the trace and eigenvalue tests are presented in Table 8. The Johansen cointegration test results indicate cointegration for Indonesia, the Philippines, and Thailand, but not for Malaysia and Singapore. Baharumshah et al. (2003) obtained similar findings for Indonesia, Thailand, and Malaysia.
|
|
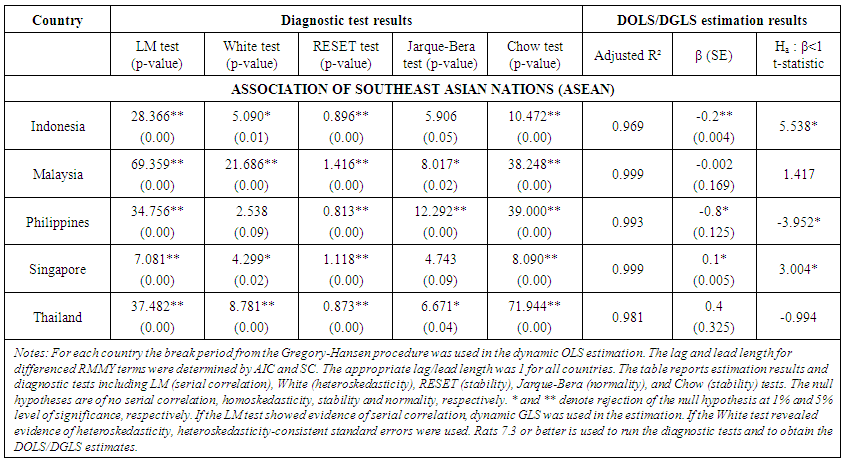 | Table 10. Dynamic OLS Results |
 in favor of the alternative
  (Table 10) for Singapore, which indicates that its current account position is unsustainable over the sample period. Thus, while debits are not a drain on the economy in Singapore, import growth outpaces export growth, making it difficult for Singapore to close its trade gap. As a result, Singapore may be in jeopardy in the future unless necessary adjustments are made.There is a negative statistically significant relationship between exports and imports + for Indonesia and the Philippines. We reject the null of
  in favor of the alternative
  (Table 10) for Indonesia and the Philippines, which suggests that their current accounts are not sustainable over the sample period. Therefore, Indonesia and the Philippines are importing without adding sufficiently to their export bases. In contrast, Malaysia and Thailand have negative and positive relations between exports and imports+, respectively, but their coefficients are statistically insignificant. Furthermore, we do not reject the null of
  in favor of the alternative
  , which indicates that Malaysia and Thailand’s current account positions are sustainable over the sample period. Overall, three of the sample countries suffer from weak current account positions. While the current account position for Singapore is problematic, it is less of a concern than for Indonesia and the Philippines. Based on our model, we thus conclude that Indonesia, the Philippines, and Singapore have current account positions that are unsustainable over the sample period. Thus, import growth has outpaced exports, and it has been an uphill battle for these three countries to close their trade gaps. Our results suggest a need for reform in order to improve current account positions in Indonesia, the Philippines, and Singapore. In the following section, we draw lessons for reforms based on a comparative analysis of the experiences of our sample countries.
6. Conclusions
- This paper analyzes the current account sustainability of five ASEAN countries including Indonesia, Malaysia, the Philippines, Singapore, and Thailand. We examine the relationship between exports and imports including net interest and transfer payments (imports+) for these countries using the intertemporal solvency framework, cointegration methodology, and dynamic OLS estimation. We find evidence of cointegration between exports and imports+ for all countries except Malaysia. In the case of Singapore, we only find cointegration when we allow for a structural break indicating a positive shift in the trade positions of this nation.Our estimation of the relation between exports and imports+ shows a statistically significant positive relation for Singapore. Guest and McDonald (1999) note that Singapore had over-saved in the 1976-1997 timeframe more than the other ASEAN countries in our sample. However, only Malaysia and Thailand have sustainable current account positions. Guest and McDonald (1999) found that Malaysia and Thailand ran below-optimal current account balances due to over-investing in the 1976-1997 period. Ostry and Robinson (1997) caution that reducing current account deficits over time will minimize the associated risks even in the face of sustainable external positions. While Singapore continues to exhibit vulnerability in the current account due to a weak relation between exports and imports+, the concerns for Indonesia and the Philippines are much more acute. We find the relation between exports and imports+ is negative and statistically significant for these countries, which indicates unsustainable current account positions. Guest and McDonald (1999) revealed that the Philippines had been under-saving while Indonesia had over-saved in the 1976-1997 period.Long-run current account deficits are indicative of macroeconomic imbalances, such as excessive spending by the government or private sector, inefficient investment, or overvaluation of the currency, which portend serious problems for a nation. If these current account deficits are large and ongoing, domestic interest rates may rise relative to foreign interest rates and thereby saddle future generations with higher debt service payments and reduced standards of living. Furthermore, Kaminsky, Lizondo, and Reinhart (1998), Yan (1999), Edwards (2001), and Baharumshah et al. (2003) point out that significant current account imbalances may propagate currency crises. Baharumshah et al. (2003) assert that a failure to address such external imbalances could ultimately result in an exchange rate collapse, because foreign investors will be reluctant to finance these deficits in the long run. Milesi-Ferretti and Razin (1996) and Yan (1999) note ability-to-pay and willingness-to-lend constraints under these circumstances. These observations are particularly salient for the ASEAN nations following the Asian Financial Crisis in mid-1997. Given the integrated global nature of modern-day financial markets, countries with large current account deficits may fall victim to exogenous market sentiment shocks. Yan (1999) cites evidence that nations may suffer due to the plights of nearby countries. The ongoing worldwide concern over the recent slowdown in China’s economic activity and its potential impact on the vitality of other economies is indicative of the gravity of these contagion effects. Thus, the unsustainable current account positions suggested by this analysis for Indonesia and the Philippines, and to a lesser extent Singapore, may merit policy responses, such as exchange rate regime shifts and/or tighter macroeconomic policies, to avoid a crisis. In that vein, Yan (1999) argues that the International Monetary Fund and other international organizations play a pivotal role in achieving recovery from currency crises.
ACKNOWLEDGEMENTS
- We appreciate helpful comments and useful feedback from Stephanie Brewer Jozefowicz and an anonymous reviewer. We gratefully acknowledge Debbie Bacco for her superb editorial assistance. The usual caveat applies.
Notes
- 1. Due to a lack of available data, graphs are provided for only eight of the ASEAN countries. Specifically, Brunei Darussalam and Myanmar are omitted.2. The ASEAN-5 countries include Indonesia, Thailand, Malaysia, the Philippines, and Vietnam.
Appendix
 | Figure 1(a). Trade and Current Account as a Percentage of GDP for Cambodia |
 | Figure 1(b). Trade and NCIA as a Percentage of GDP for Cambodia |
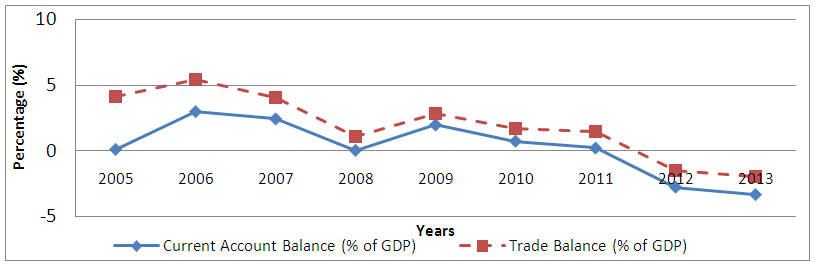 | Figure 2(a). Trade and Current Account as a Percentage of GDP for Indonesia |
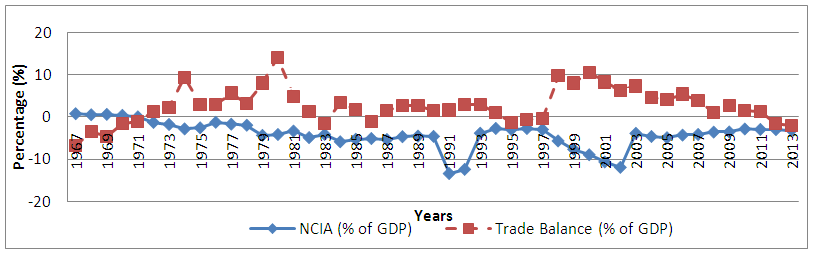 | Figure 2(b). Trade and NCIA as a Percentage of GDP for Indonesia |
 | Figure 3(a). Trade and Current Account as a Percentage of GDP for Lao PDR |
 | Figure 3(b). Trade and NCIA as a Percentage of GDP for Lao PDR |
 | Figure 4(a). Trade and Current Account as a Percentage of GDP for Malaysia |
 | Figure 4(b). Trade and NCIA as a Percentage of GDP for Malaysia |
 | Figure 5(a). Trade Balance and Current Account as a Percentage of GDP for Philippines |
 | Figure 5(b). Trade Balance and NCIA as a Percentage of GDP for Philippines |
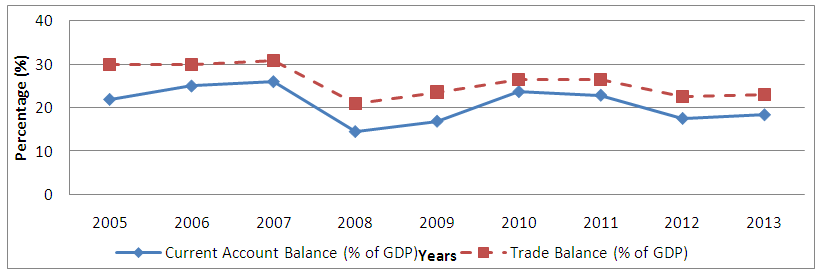 | Figure 6(a). Trade and Current Account as a Percentage of GDP for Singapore |
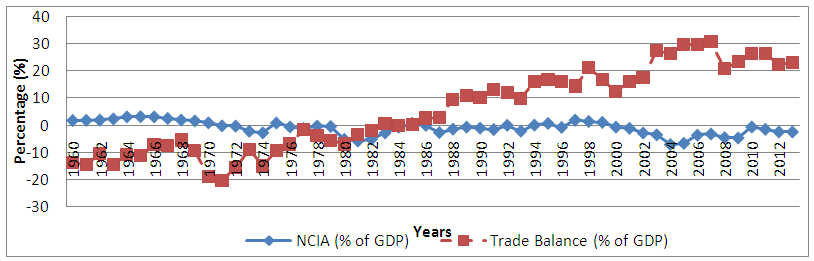 | Figure 6(b). Trade and NCIA as a Percentage of GDP for Singapore |
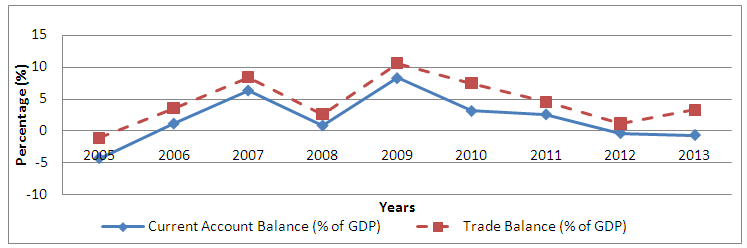 | Figure 7(a). Trade and Current Account as a Percentage of GDP for Thailand |
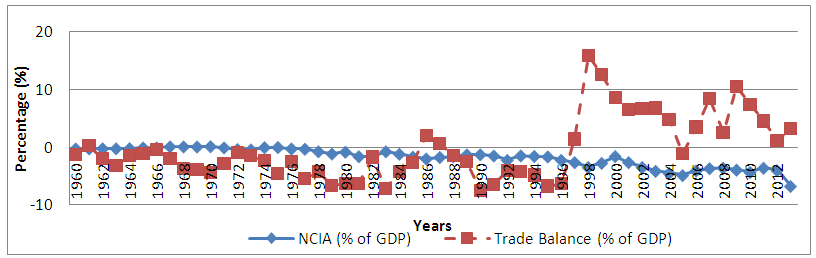 | Figure 7(b). Trade and NCIA as a Percentage of GDP for Thailand |
 | Figure 8(a). Trade and Current Account as a Percentage of GDP for Vietnam |
 | Figure 8(b). Trade and NCIA as a Percentage of GDP for Vietnam |