-
Paper Information
- Paper Submission
-
Journal Information
- About This Journal
- Editorial Board
- Current Issue
- Archive
- Author Guidelines
- Contact Us
Microeconomics and Macroeconomics
p-ISSN: 2168-457X e-ISSN: 2168-4588
2015; 3(3): 47-57
doi:10.5923/j.m2economics.20150303.01
Analysis of Factors Affecting Willingness to Pay and Affordability to Pay to the Household Consumers (PDAM Tirta Riau Islands - Tanjungpinang)
 Abstract
 Reference
 Full-Text PDF
 Full-text HTML
T. Munzir1, Umar Burhan2, Ghozali Maskie2, Ahmad Erani Yustika2
1Doctoral Program of Economics Science, Faculty of Economics and Business, University of Brawijaya, Indonesia
2Faculty of Economics and Business, University of Brawijaya, Indonesia
Copyright © 2015 Scientific & Academic Publishing. All Rights Reserved.
Regional Water Company is required to improve its performance so that the quality of water produced in accordance with customer expectations. In fact shows that customer satisfaction at PDAM Tirta Riau Islands as the object of this research has not been achieved, as shown by the presence of 3,000 of the 17,000 household customers in arrears group rates. This condition raises the question of what caused this to happen while most people were able to buy water privately owned at a price 20 times higher than the rate current taps. Their arrears taps rates is of course closely related to the willingness to pay and the affordability to pay household consumer groups, so it needs to be carried out research on the factors that influence it.The purpose of this study is to analyze and describe: factors affecting willingness to pay and affordability to pay household consumers in terms of factors (1) welfare, (2) education, (3) K-3, (4) social economy, (5) performance, and (6) tariffs applied by PDAM household consumers group. Data collection techniques used questionnaires addressed to household customers as many as 200 respondents in the sample. Analysis of the data used to test the hypothesis is Partial Least Square (PLS) using software Smart PLS.These results indicate that the influence willingness to pay directly and significant is the welfare factor, K-3, socio-economic, performance, price, and affordability to pay, while education factor did not significantly affect the willingness to pay in person. The study also showed that factors welfare, education, socio-economic and rates significant effect on the affordability to pay.
Keywords: Willingness to pay, Affordability to pay, and consumer households
Cite this paper: T. Munzir, Umar Burhan, Ghozali Maskie, Ahmad Erani Yustika, Analysis of Factors Affecting Willingness to Pay and Affordability to Pay to the Household Consumers (PDAM Tirta Riau Islands - Tanjungpinang), Microeconomics and Macroeconomics, Vol. 3 No. 3, 2015, pp. 47-57. doi: 10.5923/j.m2economics.20150303.01.
1. Introduction
- Law Number 7 of 2004 on Water Resources of Article 5 mentioned that the state guarantees the right of every person to obtain water for minimum basic needs of daily life in order to meet a healthy, clean, and productive. In article 18 also stated that the central government delegate authority to local governments, and the local government subsequently formed a Local Company through legislation known as the PDAM (Regional Water Company). PDAM is a company that monopolizes the mass production of clean water, although some city like Jakarta and Batam, clean water produced by private companies / foreign investment, meaning that business in the provision of clean water can enter into a private company competitors taps that had been hogging. Therefore, PDAM is highly demanded to have to constantly improve the service that taps output in the form of clean water in accordance with the expectations of all consumers.If the production of water taps meet customer expectations, then it certainly will improve customer satisfaction. Conversely, if the company failed to deliver customer satisfaction, it is likely customers will also respond to, one with no water taps are willing to pay the bill so that in the end the company will lose money because a lot of customers who are in arrears to pay the bills. The main cause or the root of the problem is due to not achieving full cost recovery due to the still high class customer arrears households account for about 3,000 of the 17,000 customers. Meanwhile that there is a unique phenomenon where some customers were able to buy water from private parties at a price of Rp. 125.000, - / tank (or Rp. 25.000, - / m3) to cover the shortage of water taps are acceptable to the customer, even some are able to buy a gallon of water that cost much higher than the price of tap water is only Rp. 1.200, - / m3.The arrearing of water bills payment, allegedly influenced by the WTP (willingness to pay) and the factor of ability to pay (affordability to pay) customers PDAM Tirta Riau class households. Some theories and the results of previous research discusses the factors that influence the willingness to pay (WTP) and ability to pay (ATP) customers, among others stated that; (1). Welfare rate potential factors affecting WTP, (2). Formal education is also a factor closely related to education WTP. The purpose of education was very broad because it involves improvements attitudes and behavior, (3). Factor K-3 (Quality, Quantity and Continuity) is believed to also influence WTP, (4). Socio-economic factors. Central Bureau of Statistics Indonesia (2012) explains that in order to see the level of household welfare one indicator is the condition of the house and owned facilities. (5). Rates factor, according to Mays, et al (1996) the establishment of a high water tariffs, resulting in only a few people are able to consume water because it does not have the ability to pay / buy water, otherwise the water rates that are too low will cause company earnings to be small or even suffered losses., (6). Performance Factor. According Tika (2006), that the company's performance is a function of the work / activities in companies that are affected by factors internal and external to the organization in achieving the goals set during a specific time period and (7). Affordability factor to pay (ATP). ATP is a person's ability to pay for services received based on income that is considered ideal.The main problem is not achieving the taps full cost recovery caused by low rate so that the company suffered losses of Rp. 292.25, - / m3 water production and the amount of arrears mainly household customer group. This condition is exacerbated by the increasingly high of operating costs. With the uncollected arrears of this, the losses become increasingly bloated. The delay is due to the customer's bill by a factor of people's desire to pay (wilingness to pay) is low and or because of the ability of customers to pay the prescribed rate (Affordability to pay) which does not exist or may be a combination of both. The fact that happened in the community stated otherwise condition in which some of them are even willing and able to buy water from private parties (tanker) with an average price is much higher at Rp. 25.000, - per m3 or about 20 times the PDAM rate this mainly occurs in the dry season or during a disturbance in the water distribution taps. This interesting phenomenon requires research to find out about the factors that affect the willingness to pay and the affordability to pay. Whether caused by water is an essential requirement / principal so that any public offering price of purchased fixed or a signal manifestation of cumulation of public disappointment with the service taps so customers do reaction with arrears to pay the fare or the presence of other factors are hidden and not revealed which need to be explored deeper. The problem is not the achievement of full cost recovery alone is not monopolized by PDAM Tirta Riau Islands but almost all the taps in Iindonesia.If the company makes a profit it will be used for improvements in the field of Technical, Management and Finance, if profit can only be obtained with a tariff adjustment, then the problem is whether to raise tariffs as a necessity, consumers will be willing and able to pay, would not occur otherwise precisely the greater the amount of arrears and the dwindling number of customers (unsubscribe). Therefore it is necessary to dig deeper causes of unwillingness of consumers to pay PDAM rates by estimating the factors that might influence it. Based on the data of PDAM Tirta Riau in 2010 the largest group of customers is customer household reaching 13.120 from customers 17 095 or 76.75% of the total subscribers.On the basis of these considerations, the household consumer group PDAM Tirta Riau chosen as the object of a more comprehensive study to determine the factors that influence the willingness to pay and the affordability to pay, especially for household customers groups. Therefore, the basic framework is based on theory and the results of previous studies can be synthesized that factors suspected to affect the willingness of people to pay and the affordability to pay is a factor (1) welfare, (2) education, (3) K-3, (4), socio-economic (5). performance (6) rates, and (7) ATP.
2. Research Methods
- This study was conducted in the city of Tanjung Pinang and as a research location is on the Technical Implementation Unit Water at PDAM Tirta Riau Islands with the target communities as clean water customer households class. The study population was mostly customer PDAM Tirta Riau Islands, Tanjung Pinang. Population sampling in this study were all customers of PDAM Tirta Riau in Tanjungpinang while the target population is household customers. The sample in this study was determined using the accidential sampling, the sampling technique based coincidence that anyone who by chance met with the researchers can be used as a sample if that person is deemed suitable as a data source (Sugiono, 2001), while the sampling is based on the consideration that the number of population in this study is very difficult to know for sure that the number of population is not limited or not known so that the number of samples taken in this study tailored to the opinion of Hair et al., in Ferdinand, (2005) stated that the number of samples at least as much 5 to 10 of the number of indicators used in the study. In this study a sample of 200 respondents, while the number of indicators in the research study 19, so that the number of samples already qualified sufficiency (5 x number of indicators = 5 x 19 = 95 or smaller than 200).This study uses analysis tools Partial Least Square (PLS). Selection of this method. Because it is powerful that analytical methods can be applied to all scales of the data does not require a lot of Assumptions and do not necessarily large sample size. There are two kinds of indicators in the PLS approach, the first indicator is an indicator reflective. Reflective Indicator is an indicator that is considered to be affected by latent constructs, or indicators that reflect / present the latent constructs. The second indicator is an indicator formative. Formative indicator is considered an indicator that affects the latent variables. Formative indicator observing the causes of latent variables.Designing a Structural Model (Inner Model) in the study. Inner model is a structural model that links between latent variables which in this study can be seen in figure 1.
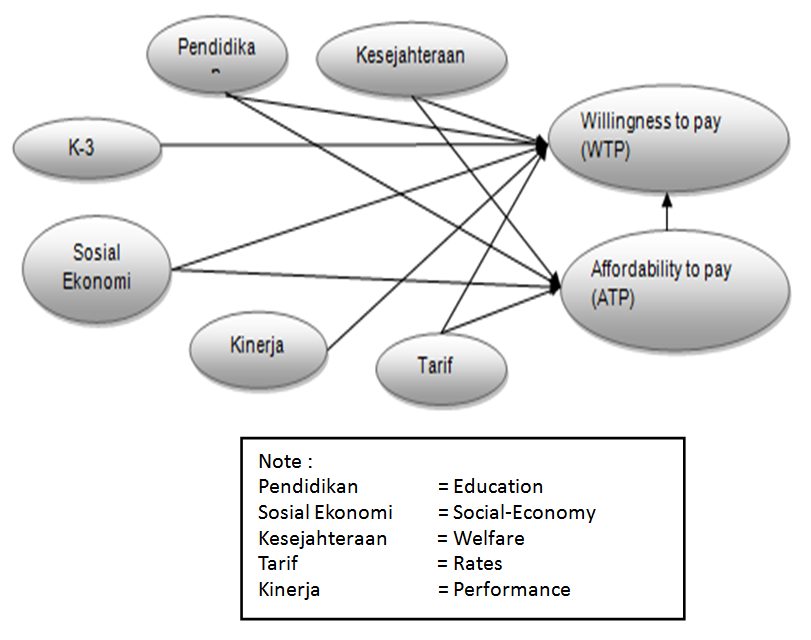 | Figure 1. Inner Model |
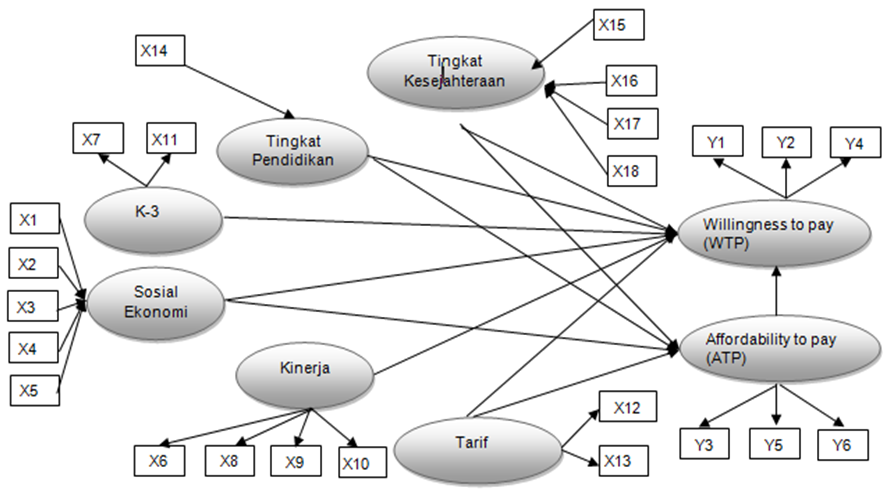 | Figure 2. Outer Model |
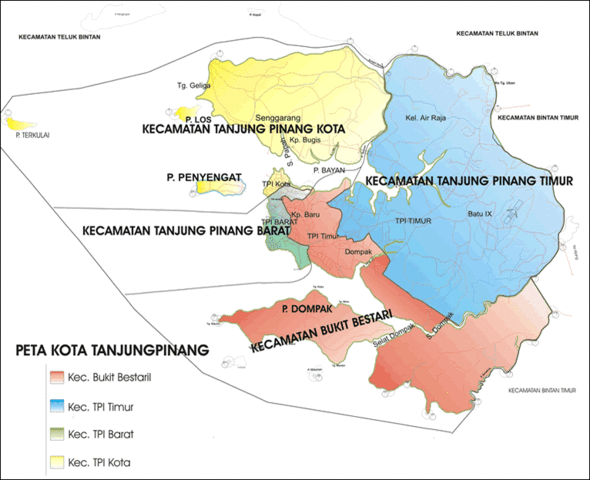 | Figure 3. Research Location Map |
3. Empirical Result
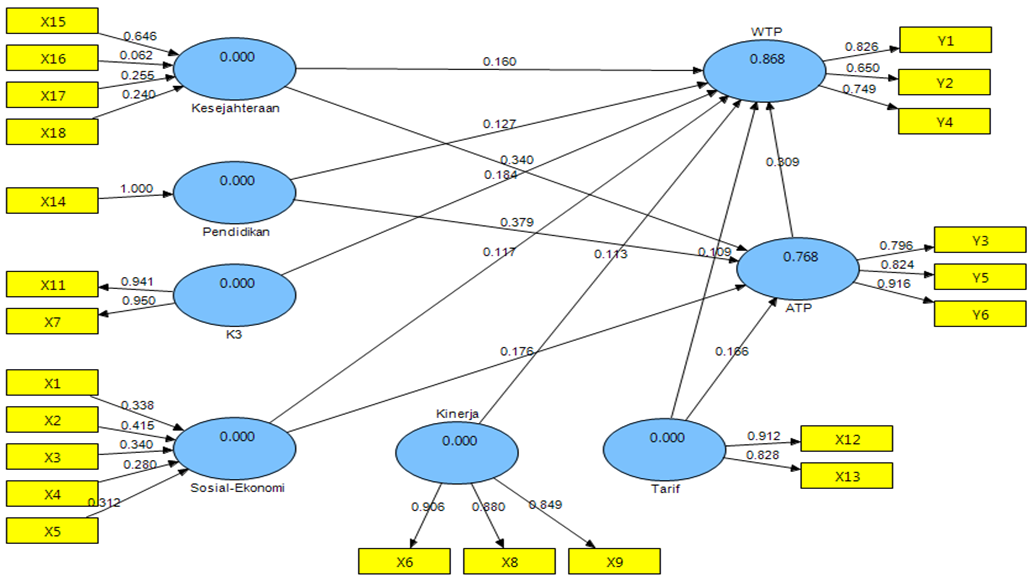
- 1. Data AnalysisResults of analysis using the PLS method, described by Figure 4 below.Outer model testing conducted to determine the validity of the indicators of the latent variable. At variables arranged in a reflexive, the indicator is considered valid if it has a value of outer loading> 0.7 and T-statistic values above 1.96. However, loading of 0.5 to 0.6 is considered sufficient for the initial phase of development scale (Solimun 2006). While on variables that formed formative, convergent validity testing is done by testing the outer weight. Jika T-statistic Obtained above 1.96, then formative convergent construct validity have been fulfilled (Jogiyanto and Abdillah, 2009).
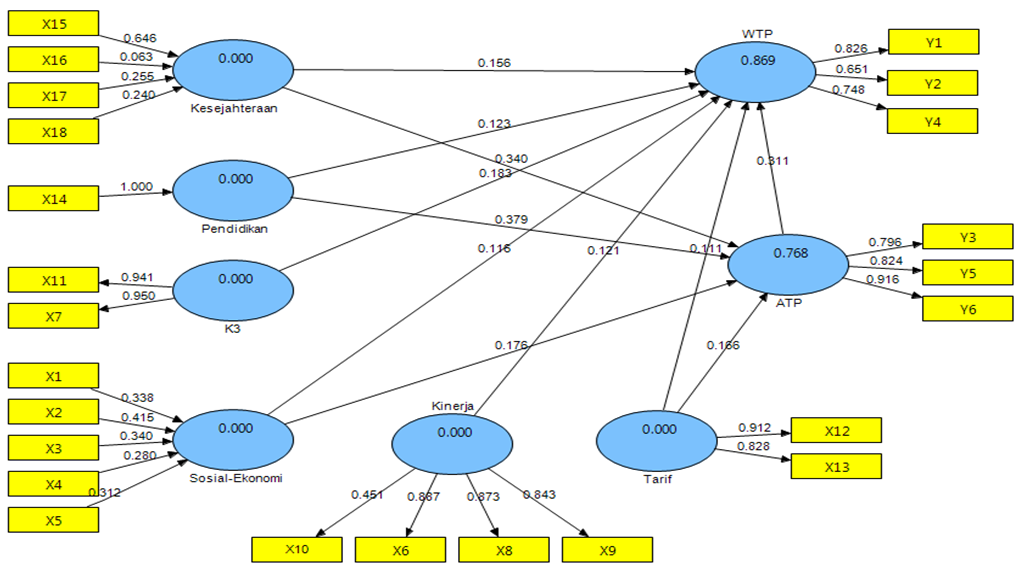 | Figure 4. Testing Structural Model |
 | Figure 5. Testing Structural Models without Indicator X10 |
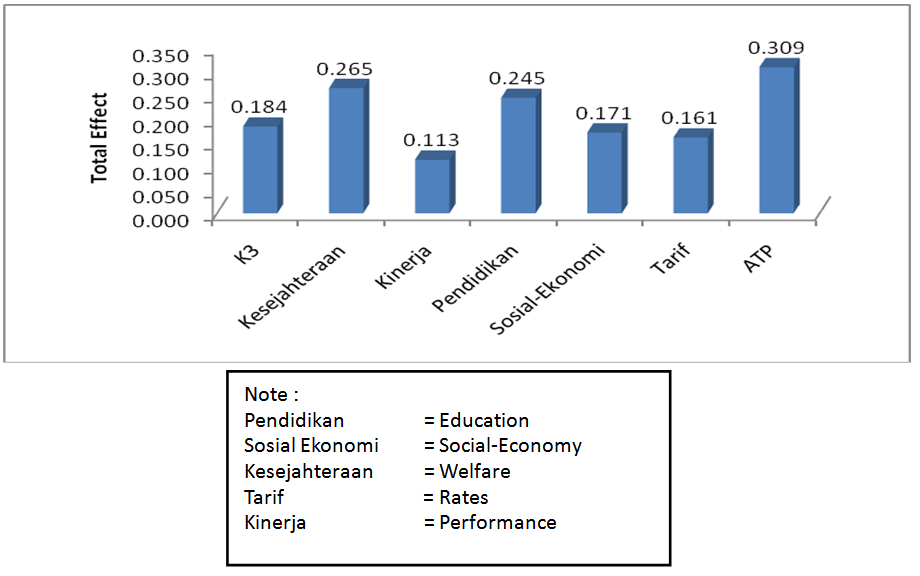 | Figure 6. Total Effect against Exogenous variables WTP |
|
4. Conclusions
- This study describes the effect of welfare, education, K-3, socio-economic, and rates that affect the willingness to pay (WTP) and affordability to pay (ATP), then can be given suggestions of this study as follows:1. Management companies need to make improvements PDAM Tirta Riau services to consumers in the sense of doing the increase mainly to the quality, quantity and continuity of running water in the consumer household on whole.2. Although K-3 water taps is currently perceived by the consumer households are still less than expected, but the current price of Rp. 1.200, - / m3 for household consumer groups are still allowed to be raised again in order to achieve full cost taps records recovery with make improvements to the K-3 (quality, quantity and continuity) of water.3. To achieve the Full Cost Recovery which forced the company to subsidize Rp. 292.25/ m3 water production, can also be achieved by not doing the current water rates adjustment but by pressing the digit percentage rate of water loss. Cause of water loss include: water meter inaccurate and/or no parent meters, leakage of pipelines, theft/ illegal connection, meter read errors/human error, and the contractor does not meet the technical specifications. The rate of water loss last recorded (2009) amounted to 53.59% from year to year shows that the percentage will continue to rise.4. The policy of progressive rates on PDAM Tirta Riau Islands Tanjungpinang for this by classifying the level of consumption in the four user group level, which is between (0-10) m3, (11-20) m3, (21-30) m3 and >30 m3. Discriminatory tariff policy on Tanjungpinang PDAM Tirta Riau Islands by applying the highest rates in specific activities (port), and then successively on industrial activities, commercial, government, households and social. Water tariff policy in PDAM Tirta Riau Islands is also common practice in other taps in Indonesia.5. The problem of customer arrears for 3000 of 13.120 consumer willingness to pay more due to the low (WTP), not because of the absence of the afordability to pay (ATP). Consumers are disappointed with K-3 and the performance of companies in general so stoked to pay delinquent water bills.6. Management also still has room to raise rates even higher to Rp. 2.175,26/m3 (according to WTP) on the condition that K-3 enhanced; water quality is better, still flowing with sufficient volume and no rotation/water rationing. These findings also indicate that the subsidy is still needed by PDAM Tirta Riau Islands. Government equity participation can be allocated to improve the management issues, technical issues and financial problems are low. If government participation is used to reduce the number of water loss program, then the company's financial income would increase even more.