-
Paper Information
- Paper Submission
-
Journal Information
- About This Journal
- Editorial Board
- Current Issue
- Archive
- Author Guidelines
- Contact Us
Microeconomics and Macroeconomics
p-ISSN: 2168-457X e-ISSN: 2168-4588
2015; 3(1): 7-14
doi:10.5923/j.m2economics.20150301.02
Analysis of Demand for Dairy Product in Central American Countries under the CAFTA
 Abstract
 Reference
 Full-Text PDF
 Full-text HTML
Wen-Chi Huang 1, Ángel Amed Durón-Benítez 2
1Graduate Institute of Agribusiness Management, National Pingtung University of Science and Technology, Taiwan
2Department of Tropical Agriculture and International Cooperation, National Pingtung University of Science and Technology, Taiwan
Correspondence to: Ángel Amed Durón-Benítez , Department of Tropical Agriculture and International Cooperation, National Pingtung University of Science and Technology, Taiwan.
| Email: |  |
Copyright © 2015 Scientific & Academic Publishing. All Rights Reserved.
A double-log model was estimated on demand for cheese and fluid milk and for the aggregation of imported cheese, fluid milk, and powdered milk in Costa Rica, El Salvador, Guatemala, Honduras, and Nicaragua using time series data 1994-2012. Cheese and fluid milk were price and income inelastic in all countries, except for income in El Salvador. On the other hand, import prices for cheese and fluid milk were often found elastic, but that of powdered milk was inelastic. An increase in incomes augmented imports of fluid milk and cheese, compared to powdered milk. Overall, the substitution effect suggested that increment in imports prices of cheese and fluid milk increased the purchase of powdered milk.
Keywords: Dairy products, Central America, Demand elasticity, Import demand
Cite this paper: Wen-Chi Huang , Ángel Amed Durón-Benítez , Analysis of Demand for Dairy Product in Central American Countries under the CAFTA, Microeconomics and Macroeconomics, Vol. 3 No. 1, 2015, pp. 7-14. doi: 10.5923/j.m2economics.20150301.02.
Article Outline
1. Introduction
- The Central America (CA) market demand of dairy products might be affected by the Free Trade Agreements with two major exporters: the United States (Central America Free Trade Agreement, CAFTA), implemented in 2006 (for most countries) and the European Union, implemented in 2013. For example, tariffs decline to zero for imported dairy products after twenty years of the CAFTA’s implementation with the United States. This might lead to increasing their supply at regional markets, impacting demand, supply, and price, thus adjusting to a new equilibrium. A study on demand elasticity of domestic market and import of main dairy products would reveal trend and size of changes at CA.Dairy demand of Central Americans exceeds supply. As a result, imports have traditionally complemented consumption (41% of total quantity), which is unlikely to change for the coming years. For instance, the import dependency ratio ranges from 9.5% in Costa Rica to 75.3% in Guatemala. Since 1994, the annual growth of the CA Dairy import was 6.6%, in which fluid milks (13%), cheeses (17%), and yogurts (21%) showed the greater increase. The major suppliers to the region are countries from the CA (52% share of total 214.1 thousand tons in 2011), Mexico (15%), United States (12%), Oceania (8%), European Union-27 (6%), and other countries (7%).Fresh and aged cheese, butter, and fluid milk are the most consumed dairy products. They are processed from locally produced milk by artisans (58% of total amount) and industrialized processors (42%). Consumers at densely populated cities may purchase the produce from industrialized processors, whereas those at sparsely populated towns may buy the goods from artisans. Dairy products are main items in the food baskets, constituting the second largest expenditure of Costa Rica (17%) and El Salvador (18%) and the third one at Nicaragua (19%) (Survey of Income and Expenditure for Household of each country 2006). As for consumption, it equals the world average per capita: 105 kg in milk equivalent in 2011 [1, 2].Given the supply insufficiency of dairy products and the removal of their import tariffs under CAFTA, values on consumption change may have practical applications about market opportunity for regional producers, processors, exporters as well as for trade partners and throughout the world. This study estimated price and income elasticities for demand of cheese and fluid milk and for the aggregation of imported cheese, fluid milk, and powdered milk in Costa Rica, El Salvador, Guatemala, Honduras, and Nicaragua. The paper is organized as follows: overview of dairy consumption, review of previous studies, materials and methods, results and discussion, and conclusions.
2. Overview of Dairy Consumption in Central America
- Despite the proximity, cultural similarity, and common taste of consumers’ in the CA region, each country has developed its own amount of consumption. In 2011, per capita consumption of dairy products (milk equivalent) was less than the world average (105.6 kg) in Guatemala (27 kg), El Salvador (80 kg), and Honduras (81 kg), but it was higher than the world average in Nicaragua (132 kg) and Costa Rica (203 kg) [1, 2].Cheese is a very important food in the daily diet of the Central American household. It is consumed as a topping or as a main dish. Different cheeses, fresh and aged, are widely consumed, however, consumers’ tastes and preferences may be influenced by income levels, where fresh cheese may be consumed at lower-income levels and aged cheese may be consumed more at middle and high income levels. In 2009, 60% of the total cheese consumption in the region was imported; El Salvador had the highest import rate of 54% among Central American countries, followed by Honduras (24%), Guatemala (18%), Costa Rica (4%), and Nicaragua (1%). Overall, cheese was the second main imported product in the region, sharing 27% of total imports (152.5 thousand tons) of dairy products in that year. Similarly, milk is among the top ten items in the list of the food basket. Its consumption is made up of fluid milk and powdered milks. In 2009, milk shared 56% of total dairy product imports, where the main item was powdered milks (33% of total imports), which may be due to ease of storage and transport, and affordable prices. Guatemala imported the highest volume of powdered milks (38%), followed by El Salvador (26%), Honduras (18%), Costa Rica (14%), and Nicaragua (4%).Furthermore, consumption of fluid milk has been in the form of fresh milk (unpacked fluid milk). In recent years, however, fluid milk produced with technologies such as pasteurization or UHT (packed fluid milk) became widely available and mainly consumed in urban areas. Total consumption of fluid milk is complemented with import, which constituted 23% of total volume in 2009. Guatemala was the highest importer (66%) of fluid milk volume (23% = 100%), followed by El Salvador (21%), Honduras (10%), Nicaragua (3%), and Costa Rica (2%).In this study, we estimated price and income elasticities of cheese, powdered milk, and fluid milk. Moreover, an analysis of their import demands was conducted; since imports comprise an important part of consumption and it was included to provide a complete assessment of the dairy market in CA.
3. Review of Previous Studies
- In the literature, only one empirical study of dairy products demand in Honduras was reported. We extended the review to include Mexico for its similarities of the overall dairy sector and for its experience in the NAFTA (North America Free Trade Agreement). In addition, we discuss the results from other Latin American countries. Studies of the other Latin countries were from South America; the own-price elasticity for demand of aggregated dairy products was reported -0.09 in Argentina, -0.12 in Bolivia, and -0.13 in Paraguay [3]. The income elasticities were also inelastic, ranging from 0.15 to 0.29, in the three countries. Also on demand of aggregated dairy products, Melo and Cortéz [4] estimated the expenditure elasticity (0.92, compensated elasticity) using the almost ideal demand system (AIDS) with household data from 1997 in one Province of Chile. Sabates and Gould [5] provided estimates of income elasticity for demand of milk (0.30) and other dairy products (0.66) using data on household survey from 1996 to 1997 in Argentina. Also in Argentina, estimations on price and expenditure elasticities for demand of nine dairy product were conducted by Guiguet et al. [6] in two Provinces, while estimations on price and income elasticities for demand of cheese (hard, semi hard, and fresh) were given by Lema et al. [7] at capital city and its suburb.On the other hand, two studies in Mexico, motivated by the NAFTA, focused on the import demand of selected dairy products. Ramirez and Wolf [8], for instance, employed a source-differentiated AIDS to estimate the import demand elasticity for cheese, milk powder, and other dairy products. The sources of origin of dairy products imported into Mexico were categorized as United States, European Union, Oceania, and other countries. When compared to demand for cheese, milk powder, and other dairy products, all own price elasticities were negative, and at least unit elastic, except for the demand of milk powder from the United States and European Union, which were inelastic but non-significant. All of the expenditure elasticity estimates were positive and mostly elastic.The demand for cheese import were analyzed by Ramirez et al. [9], using the nonlinear AIDS on annual data from 1990 to 2001. Cheese import by source was viewed as a good in the system where the complete system is the Mexican cheese import. Three equations were estimated in the demand system, including the United States, European Union, Oceania, and others. The estimates of compensated own-price elasticity for cheese was elastic (-1.832) only for the category other.One study more comparable to the present analysis was conducted by [9]. Using double-log linear model on time series data from 1975 to 1992, Tanyeri-Abur and Rosson [10] estimated price and income elasticities for four dairy products in Mexico. The own price elasticity of the demand for fluid milk was -0.68, nonfat dry milk (NFDM) was -0.14, butter -0.47, and -0.44 cheese; the income elasticity for fluid milk was 0.44, NFDM was 0.99, butter 0.95, and 1.1 cheese. Tanyeri-Abur and Rosson [10] also provided estimates of the import demand elasticity respect to price and income for the four products using a double-log linear equation. Elasticities for import demand of the above dairy products were all inelastic, except fluid milk that was elastic (-1.35); however, income elasticities were all elastic (more than 1).The study in Honduras by Garcias-Oliva [11] estimated the price elasticity and income for 13 dairy products using cross-sectional data. The findings from the cross-sectional analysis showed that own price elasticity for all 13 dairy products were inelastic, except for yogurt. For instance, the own price elasticity for the most consumed dairy products were -0.95 for fluid milk, -0.10 powdered milk, -0.50 fresh cheese, -0.31 matured cheese, and cream -0.29. The income elasticities for all of the 13 dairy products were inelastic (less than 1).
4. Materials and Methods
4.1. Model
- Based on previous studies [10, 12-14], the demand for each dairy product was modelled in double logarithmic form. Estimating the demand function as double logarithmic form benefits from ease of estimation and interpretation, since coefficient estimates are directly interpreted to be elasticities. Two types of demand functions were specified in this study: domestic demand and import demand. The variables for the domestic demand functions were dictated by economics theory (own price, price of related products, and income) using the equation:
 | (1) |
 is per capita consumption of product
  at time period
  ;
;  is the real price of product
  at time period
  in dollar of U.S. per unit;
  is per capita GDP at time
  in dollar of U.S.;
  is the real cross-price of product
  at time period
  ; and
; and  is the error term.Import demands for three dairy products were estimated: cheeses (4006), powdered milks (4002), and fluid milks (4001), as classified by the Central American Tariff System (SAC, for its acronym in Spanish), which are the main imported dairy products accounting for 83 % of total import volume in 2009. Choice of variables and functional forms of the import demand were based on previous studies [10, 12, 14]. The import demands were assumed to be of the general form:
 | (2) |
 is import of product
  at time
  in metric ton;
  is real import price of product
  in dollar of U.S. per metric ton;
  is real GDP at time
  in dollar of U.S.;
  is real import cross-price of products
  in dollar of U.S. per metric ton; and
  is as specified in equation (1). This functional form has been widely used for import demand systems.Demand functions were specified as double-log-linear and were estimated using the generalized least square (GLS) in SAS, version 9.1. The GLS AUTOREG procedure in SAS was preferred because it uses the Yule-Walker algorithm for correction of autocorrelation.The unit root test was tested to determine whether the time series variables were non-stationary. The augmented Dickey-Fuller test was applied to all continuous variables in equations 1 and 2 using the %DFTEST command in SAS. For all the time series, the null hypothesis of non-stationary could not be rejected at P = 0.05. Based on this result, all variables were differenced once to make them stationary. Since the first difference of the logarithm of the retail price of cheese in Guatemala and Honduras and that of fluid milk in Honduras and Nicaragua were found to be non-stationary, these variables were differenced twice. Per capita consumption of cheese in Honduras and Nicaragua, imported cheese in Guatemala, Honduras, and Nicaragua, and imported fluid milk in Costa Rica, El Salvador, and Guatemala were differenced twice.
4.2. Data
- Period data analyzed was taken from 1994 to 2012. Annual records on production of fluid milk for Nicaragua were obtained from the National Institute of Development Information website [15] and the Central Bank for Honduras website [16]. Per capita consumption of cheese for the five countries was taken from FAO agricultural statistics website [1]. Annual data from import milk and milk products for the five countries were obtained from Central American Integration System website [2] (Secretaría de Integración Centro Americana, SIECA). Price data for fluid milk and cheese in Costa Rica were taken from National Institute of Statistics website [17], Ministry of Agriculture and Husbandry in El Salvador [18], National Institute of Statistic in Guatemala [19], Central Bank for Honduras [16], and Ministry of Agriculture and Forestry for Nicaragua [20]. Income values were obtained from their Central Banks [16, 21-24]. Per capita GDP was used for domestic demand estimation and aggregate GDP was used for import demand. Data on prices and incomes were in local currencies and US dollar; however, in this study US dollar values were preferred as a common currency. Hence, prices and incomes that were in local currencies were converted into US dollars. All prices and incomes were deflated by the respective consumer price index of each country. Food price index or dairy price index was not available for deflating price figures.
5. Results and Discussion
- The results of the demand for cheese and fluid milk are first presented, followed by the import demands for the aggregation of cheese, fluid milk, and powdered milk. For each product, we discussed the estimated own-price elasticity, income, and cross-price.
5.1. Cheese Demand
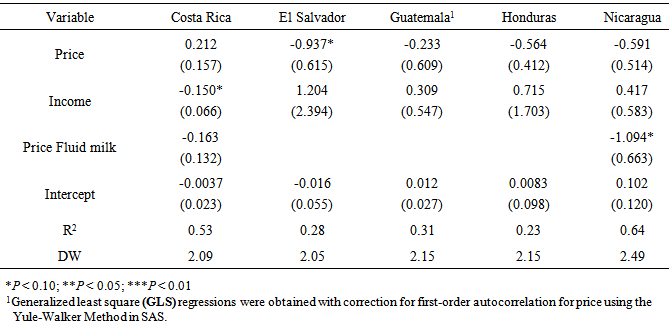
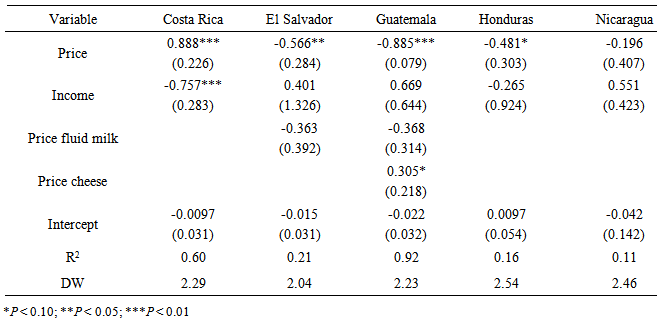
- Table 1 presents the estimated coefficients of the demand equations for cheese. The fluid milk price was included in the analysis of all countries, except for El Salvador because such data was unavailable; the variable was presented in the final model when it showed significant difference or improved the overall statistical properties of the model. Prices demonstrated the expected negative sign in most countries. The values lower than one in all countries revealed own-price inelastic, ranging from -0.23 in Guatemala to -0.94 in El Salvador. The very inelastic coefficient in Guatemala indicated that a 1% rise in the price would cause a decrease in the consumption by 0.23%. The positive sign in Costa Rica suggested that consumption of cheese would continue increasing regardless of its price. However, only El Salvador found significant own-price elasticity. Cheese may constitute one of the largest expenditures in the food basket budget, yet, consumers showed persistent buying, which could indicate that this product may be considered as a necessity.The positive sign and greater than zero of income confirmed that cheese was a normal good in Guatemala (0.31), Nicaragua (0.42), and Honduras (0.72), and a luxury in El Salvador (1.20). The high elastic value in El Salvador meant that a 1% increase in the per capita income would cause rise in the quantity demanded of a 1.2%. The negative sign in Costa Rica suggested that cheese was an inferior good.The negative sign revealed complement of the fluid milk price, cross elasticity, regarding the cheese demand in Nicaragua (-1.09) and Costa Rica (-0.16). The high complementary effect in Nicaragua indicated that a 1% decline in the fluid milk price would cause increase in the cheese consumption of a 1.09%. The results may evidence the strategy of industrialized processors of increasing produce of cheese when the fluid milk prices fall, which could be motivated by a higher profit.
5.2. Fluid Milk Demand
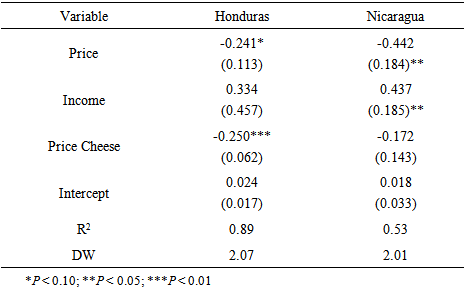
- Quantity data on fluid milk were available only for Honduras and Nicaragua; their estimated equations for fluid milk demand are presented in Table 2. Consumers in these two countries also showed persistent to buy when prices rose. The own price elasticities of demand were significantly inelastic in Honduras (-0.24) and Nicaragua (-0.44).Similar to the results of cheese demand, fluid milk also performed a normal good in these two countries. The income elasticities of demand were positive and inelastic. Given the increase of the quantity demanded produced by the incomes, an additional increment of fluid milk may occur from its availability throughout the country, since it is currently consumed in the most populated cities.The negative sign and greater than zero values demonstrated a moderate complement of the cheese prices, compared to the fluid milk demand in Honduras (-0.25) and Nicaragua (-0.17). The low and non-significant inelastic value in Nicaragua, compared with the result obtained from the cheese demand, showed that cheese was less complementary for fluid milk than fluid milk was for cheese (-1.09, P < 0.10; Table 1).
|
|
5.3. Import Demand for Cheese
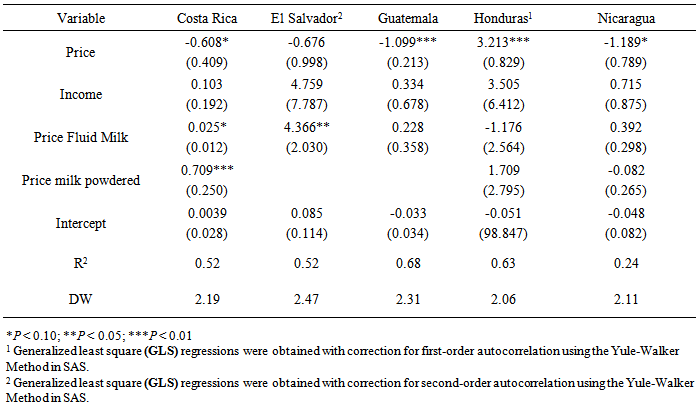
- The import models included the import prices of the other two products being analyzed, and they were presented in the final model only when they demonstrated significant or improved the overall property of the model. Import demands for aggregated cheese and fluid milk were more responsive to changes in price and income than the domestic ones. The final model included independent variables that lagged two periods in El Salvador’s data, and lagged one period in Honduras. As showed in Table 3, the import price elasticities of demand were elastic in Guatemala (-1.09), Nicaragua (-1.19), and Honduras (3.21). As for Guatemala, a 1% rise in the import price of cheese would cause a decrease in the quantity demanded by 1.09%. All price elasticities were significant, except for El Salvador. The positive sign of import prices in Honduras suggested an increase of import quantity regardless the value. The elastic results in these three countries were similar with those of previous studies in Mexico [8-10].Imported cheese demonstrated to be a luxury good in El Salvador (4.76) and Honduras (3.51) and a normal good in the other CA countries. The more elastic coefficient in El Salvador indicated that a 1% increase in the real GDP would rise a 4.76% in the import quantity of cheese. Contrary to the fair complementarity effect between cheese and fluid milk obtained from the domestic demand, a strong substitution between these two products was found from the import demand. Cheese demand was significantly affected by the import price of fluid milk in El Salvador (4.37) and by that of powdered milk in Costa Rica (0.71). Given that El Salvador may import fluid milk to be reprocessed into cheese, the substitution result is not surprising since it may be more profitable to directly buy the final product when price rises. The high elastic of the substitute and income showed a strong attachment for cheeses in El Salvador, which is also the major importer of this good in the CA region.
5.4. Import Demand for Fluid Milk
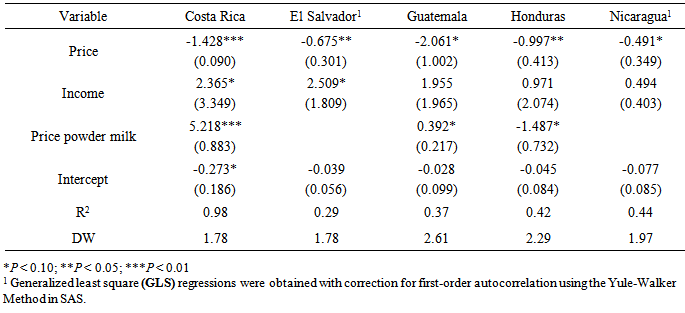
- Table 4 summarizes the estimated coefficients of imported fluid milk. The independent variables were lagged one period of data for El Salvador and Nicaragua; conversely, only price for Honduras.Similar with the result of the imported cheese demands, those of fluid milk were more responsive to price and income. Prices were significant in all countries and elastic in Guatemala (-2.06), Costa Rica (-1.43), and unit elastic in Honduras (-0.99), indicating that a 1% increase in the price would decrease the import quantity in a 2.06% in Guatemala, 1.43% in Costa Rica, and 0.99% in Honduras. The significance of lagged price for fluid milk in El Salvador, Nicaragua, and Honduras indicated its importance in the past period.
|
|
|
5.5. Demand for Imported Powdered Milk
- In contrast to the import demands of cheese and fluid milk, all countries demonstrated persistence to buy with a rise in powdered milk price. As shows in Table 5, import prices were inelastic in all countries and ranged from -0.19 in Nicaragua to -0.89 in Guatemala. The inelastic results were significant in all countries, except for Nicaragua. Overall, persistence of obtaining this product may be attributed to its low prices, income levels in the region, and its alternative uses as substitute or complement for other dairy products. Moreover, import quantity for this product was still the largest in the last decade.Import of powdered milk performed as a normal good in Guatemala (0.67), Nicaragua (0.55), and El Salvador (0.40), and an inferior good in the other CA countries. The low response of the demand to incomes, compared with those of fluid milk and cheese, could indicate that powdered milk may be less preferred as incomes rise. Tanyeri-Abur and Rosson [10] found a similar response of the powdered milk demand to the income in Mexico, compared to cheese and fluid milk.The cross price were important only in El Salvador and Guatemala. The import prices of fluid milk showed a moderately complement in El Salvador and Guatemala, whereas that of cheese exhibited substitution in Guatemala. These findings confirmed the larger number of alternative uses of this product.Overall, values of the products and income levels were proved important determinants of the import demands. Local flavors may be another determinant, particularly for cheeses that might have formed a taste preference in CA’s consumers. These determinants may well explain the partners on dairy product of the region: the same CA countries (52%), Mexico (15%), United States (12%), Oceania (8%), and European Union-27 (6%). The domestically produced would continue being preferred given their low prices, taste preferences, and the income levels of CA countries.US products may gain some trade advantages over the other suppliers after tariff removal. Presently, even with tariff (35% average), price of US cheese per pound ($1.77) is already lower than the regional retail average ($2.40). The average import price (2009-2013) of cheese from the other suppliers was $1.53 per pound from the Central American countries, $0.96 from Mexico, $3.50 from EU, and overall $1.45. Given that imported dairy products from US are marketed through supermarkets, the trade liberalization may bring competition to the regional industrialized and semi industrialized processor.
6. Conclusions
- The Free Trade Agreements with the United States and European Union might produce some changes in the Central America dairy market. The double-log function was modeled on demands for dairy products in Costa Rica, El Salvador, Guatemala, Honduras, and Nicaragua. The methodology used to estimate retail and import demands complement to provide a more complete analysis of the current situation in the CA dairy market. While the single equation approach of the double-log function may be more suited for providing assessment of the overall demand for dairy products, it has the limitation that it does not account for the interaction among products, which is solved by using a system equation.The results showed consumers’ persistence to buy as prices increased for cheese and fluid milk. Their demands were price and income inelastic, except for cheese in El Salvador. The cross-price elasticity of fluid milk and cheese demand revealed complements in Costa Rica and Nicaragua, implying that as the fluid milk price dropped, dairy processors would produce more cheese.Imports of dairy products are essential to satisfying the region’s consumption. Import demands of cheese were elastic regarding price in Guatemala, Honduras, and Nicaragua; those of fluid milk also demonstrated price elastic in Costa Rica, Guatemala, and Honduras; and powdered milk revealed price inelastic in all countries. As for incomes (GDP), the import demands for fluid milk and cheese were elastic, except for cheese in Costa Rica, Guatemala, and Nicaragua. Powdered milk demonstrated income inelastic in all countries. This suggested that as income grew in these countries, there was more import of fluid milk and cheese than powdered milk.From the cross-price elasticity, import of powdered milk demonstrated substitutions with the import demand of cheese in Costa Rica and Honduras and with that of fluid milk in Costa Rica and Guatemala. This indicated that as the import price of cheese and fluid milk increased, they bought more powdered milk.
ACKNOWLEDGEMENTS
- We thank to Edgardo Reyes Calderon and Wen-I Chang for their careful review and suggestions on several versions of this manuscript and to Albert Linton Charles for his English editing.
Note
- 1. In Costa Rica it was implemented in 2009