-
Paper Information
- Paper Submission
-
Journal Information
- About This Journal
- Editorial Board
- Current Issue
- Archive
- Author Guidelines
- Contact Us
Microeconomics and Macroeconomics
p-ISSN: 2168-457X e-ISSN: 2168-4588
2014; 2(1): 1-5
doi:10.5923/j.m2economics.20140201.01
Comparative Analysis on R&D Resource Allocation Efficiency by DEA of Beijing’s Industrial Enterprises above Designated Size
 Abstract
 Reference
 Full-Text PDF
 Full-text HTML
Yige Mu, Bin Hu
School of Management, Shanghai University of Engineering Science, Shanghai, 201620, P.R.China
Correspondence to: Yige Mu, School of Management, Shanghai University of Engineering Science, Shanghai, 201620, P.R.China.
| Email: |  |
Copyright © 2012 Scientific & Academic Publishing. All Rights Reserved.
The efficiency of R&D activities has important influence on the development of social science and technology, technological innovation capability and sustainability of economic development. This paper has built C2R model and C2GS2 model based on the data of Beijing’s industrial enterprise science and technology activity to compare the resource allocation efficiency of each industry and give some suggestions based on the analysis.
Keywords: R&D, DEA model, C2R model, C2GS2 model
Cite this paper: Yige Mu, Bin Hu, Comparative Analysis on R&D Resource Allocation Efficiency by DEA of Beijing’s Industrial Enterprises above Designated Size, Microeconomics and Macroeconomics, Vol. 2 No. 1, 2014, pp. 1-5. doi: 10.5923/j.m2economics.20140201.01.
Article Outline
1. Introduction
- The 21st century is the era of knowledge economy, as the economic development is increasingly dependent on the improvement of science and technology. Research and development (R&D) activities are the core of science and technology activities, and the basis for the development of science and technology. In recent years, with the continuous improvement of R&D expenditure, R&D efficiency problems have attracted widespread concern. In 2011, the total R&D budget in China reached $134.5 billion, R&D intensity (R&D/GDP) was 1.84%. While compared with developed countries, total R&D inputs and R&D intensity were both insufficient (such as, in 2011 the United States R&D budge reached $401.6 billion, R&D intensity 2.9%, Japan $178.8 billion, 3.26%[1]). The insufficient R&D spending has been pressuring enterprises to allocate their resources efficiency, so it is worthy to investigate and evaluate R&D efficiency scientifically, reasonably and systematically.Recently, several domestic scholars complete overall researches on the situation of the R&D efficiency by using a variety of qualitative and quantitative methods; however, these themes are not aiming to make comparison between different industries. In the paper, we analyse the R&D efficiency of Beijing’s industrial enterprise above designated size from different industries, and try to find: What is performance of R&D efficiency for each industry,Why R&D efficiency is different among industries,And what the improvement strategies should be.
2. The Construction of DEA Models
- Data Envelopment Analysis (hereinafter referred to as the DEA method) was first proposed by famous American operational research experts Charnes, Cooper and Rhodes[2]. It is a kind of brand-new efficiency evaluation method developed based on the concept of relative efficiency. Its advantages consist of: ① the optimization of each decision unit; ② the more objective evaluation procedure; ③ suitable for calculating the relative efficiency of multiple inputs and multiple outputs; ④ no extra analysis on the relevant evaluation indexes needed; ⑤ able to figure out the measureable directions and values to adjust the ineffective inputs and outputs. C2R model and C2GS2 model are the basic models.
2.1. C2R Model
- C2R model is used to measure the aggregate efficiency of decision-making units.
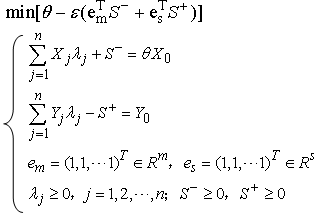 In this model, ε is the non-Archimedean infinitesimal(in actual use, constant ε=10-6); em=(1,1,…,1)T∈Rm, es=(1,1,…,1)T∈Rs; S-,S+ respectively are inputs and outputs slack variables; θ is the effective value of the evaluated decision-making units.In C2R model, T has the convexity, cone, ineffectivity, minimality. The role of the “cone” can help us to extrapolate the most effective DMU through effective scale value. It can also identify the non-feasibility of scale which may reflect from the integral level. But the “cone” is established not at any time[3].
2.2. C2GS2 Model
- C2GS2 model is used to measure the technical efficiency of decision-making units.
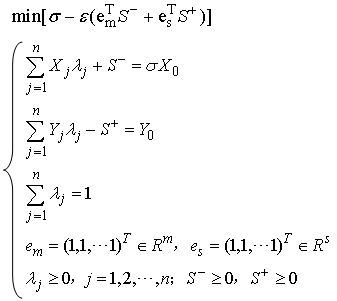 The C2GS2 model limits the scope of λ, variable returns to scale can be changed and can be used to measure the technical efficiency of DMU0. When σ*=1 and S-*=S+*=0, the technical efficiency of DMU0 is the best. When σ*≠1, DMU0 is technical inefficiency[4]. The technical efficiency score of DMU0 is σ*, we can measure the scale efficiency score, η*=θ*/σ*. When η*=1 and constant returns to scale, it is scale efficiency, and DMU0 reach to the maximum outputs scale[5].
3. The Selection of Indexes and Data Collection
- The inputs and outputs index system of R&D activities should be aggregate and systematic, besides this, the feasibility of data collection should be considered and the absolute index and relative index should not be mixed. Based on these, we select the indicators as followed,Inputs indicators: R&D staff (people), R&D appropriation expenditure (ten million Yuan);Outputs indicators: outputs value of new products (one hundred million Yuan), the number of patents (piece) and total profit (one hundred million Yuan)[6].This paper chooses 26 industries such as coal mining and dressing industry of industrial enterprises above designated size as decision-making units based on the effectiveness of sample selection and comparability to find the differences and the reasons of R&D resource allocation efficiency.All data derived from the Beijing statistics yearbook (2012)[7], and went through the related calculation.
4. The Analysis of R&D Resource Allocation Efficiency
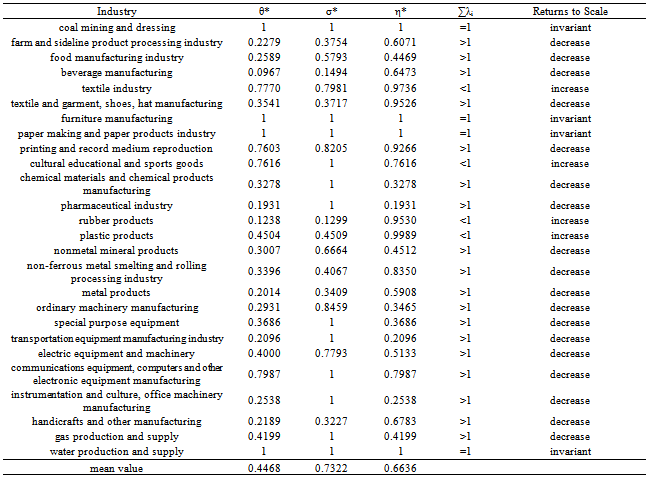
- After plugging all data into C2R model and C2GS2 model, we can obtain the aggregate efficiency θ*, the technical efficiency σ*, the scale efficiency η* and the stage of returns to scale of Beijing’s industrial enterprises’ R&D resource allocation efficiency by using WINQSB software, as shown in table 1.
|
4.1. The Analysis of Aggregate Efficiency
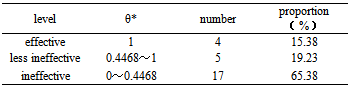
- According to the results in table 1, maximum value is 1 and minimum value is 0.0967, mean value is 0.4468. The gap between each industry is very large. We classify these industries into three grades as table 2, effective (θ*=1), less ineffective (0.4468≤θ*<1), ineffective (θ*<0.4468).
|
4.2. The Analysis of Effective Industry
- Coal mining and dressing, furniture manufacturing, paper making and paper products industry and water production and supply are aggregate effective industries based on the results of table 1. It is unable to increase the existing R&D outputs unless input extra human or capital resources at the same time. These industries are also constant returns to scale which reflect the optimality of R&D efficiency.
4.3. The Analysis of Ineffective Industry
4.3.1. The Analysis of Less Ineffective Industry
- The efficiency values of textile industry; printing and record medium reproduction; cultural educational and sports goods; plastic products and communications equipment, computers and other electronic equipment manufacturing are above mean value. Combined with technical efficiency and scale efficiency, these 5 industries’ technical efficiency values are all 1 which shows that the R&D resources collocation is reasonable management level is high. While the scale efficiency values are below 1 which results in the aggregate ineffective.
4.3.2. The Analysis of Ineffective Industry
- There are 17 industries’ aggregate efficiency values which below mean value. Combined with technical efficiency and scale efficiency, we can classify them into 2 groups as followed.① Technical efficiency and scale inefficiency: chemical materials and chemical products manufacturing, pharmaceutical industry, special purpose equipment, transportation equipment manufacturing industry, instrumentation and culture, office machinery manufacturing and gas production and supply.② Technical inefficiency and scale inefficiency: farm and sideline product processing industry, food manufacturing industry, beverage manufacturing, textile and garment, shoes, hat manufacturing, rubber products, nonmetal mineral products, non-ferrous metal smelting and rolling processing industry, metal products, ordinary machinery manufacturing, electric equipment and machinery and handicrafts and other manufacturing.
4.3.3. The Analysis on Returns to Scale of Ineffective Industry
- In 22 ineffective industries, textile industry, cultural educational and sports goods, rubber products and plastic products are increasing return to scale, while the other 18 industries are decreasing return to scale. Theoretically, it shows that the size of its R&D activities has outstripped the best size if one industry is decreasing return to scale. Therefore, it is better to reduce R&D inputs to reduce the scale of R&D activities to the extent that improve the efficiency of scale, and vice versa[8].
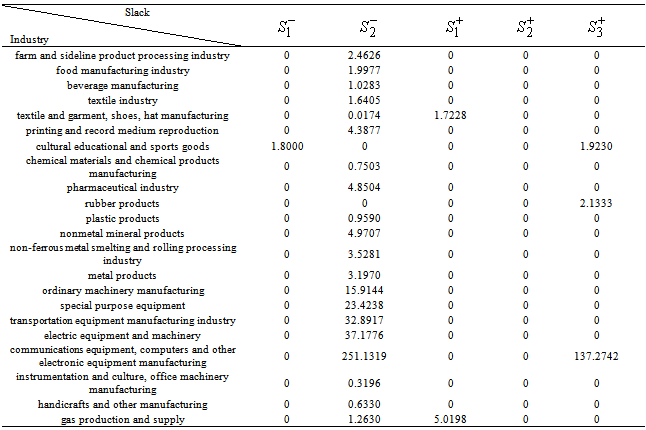
4.3.4. The Analysis on Slack Indicators of Ineffective Industry
- To the ineffective industry, there are one or more slack indicators. Slack indicators of inputs indexes mean redundancy while slack indicators of outputs indexes mean insufficient.In the inputs indexes, slack indicators of R&D appropriation expenditure exist in 20 industries which show that R&D investment structure has some unreasonable problems. Reducing R&D appropriation expenditure will make investment structure rationalization.In the outputs indexes, outputs values of new products and total profit have some slack indicators which show that there has a big gap in enhancing the R&D economic benefits.
|
5. Conclusions and Countermeasures
- By using the DEA models (C2R model and C2GS2 model), we do comparative analysis on R&D efficiency of Beijing’s industrial enterprises above designated size and we can reach the following main conclusions and put forward the corresponding countermeasures.1. The efficiency of Beijing’s industrial enterprises above designated size is low, the gap between each industry is large and the proportion of the R&D effective industry is too small. The aggregate efficiency mean value is just only 0.4468, and there are only 4 DEA effective industries in 26 industries. From these, improving the R&D efficiency is greatly needed.2. Ineffectiveness mainly results from low scale efficiency. Technical efficiency mean value is significantly higher than the aggregate efficiency mean value and scale efficiency mean value that illustrates fixed assets are too many and utilize ineffective. Thus, improving the utilization rate of R&D resources is in preference to increasing the R&D resources inputs. In the next step, controlling the R&D scale of human and capital resources scientifically, allocating these limited resources rationally, avoiding purchasing equipment blindly and transferring capital resources to the software construction appropriately are needed[9]. And attracting top talents and enhancing core competitiveness of the R&D human are also the imperative actions.3. The reasonable inputs and outputs structure is the key to the effectiveness of decision-making units so that it is important to form a moderate industry scale. Only by proper R&D human and capital resources and reasonable structure, can industries make full use of various resources and achieve the highest efficiency of outputs and reach DEA effectiveness.4. To reflect the status of R&D activity, it is especially important and necessary to establish a scientific and effective evaluation index system for R&D efficiency. It can reflect the utilization rate of R&D resources and industrial R&D efficiency timely. Besides these, it can also provide a reference to the relevant departments to make corresponding decisions exactly[10].