-
Paper Information
- Paper Submission
-
Journal Information
- About This Journal
- Editorial Board
- Current Issue
- Archive
- Author Guidelines
- Contact Us
Journal of Logistics Management
2025; 13(1): 13-19
doi:10.5923/j.logistics.20251301.02
Received: Feb. 22, 2025; Accepted: Mar. 15, 2025; Published: Mar. 21, 2025

Analyzing the China-Africa Maritime Cargo Shipping Network
 Abstract
 Reference
 Full-Text PDF
 Full-text HTML
Chensiqi1, Eden Adelaine Mareya1, Stewart Munyoro2, Liberty Artwell Mareya3
1School of Modern Posts, Chongqing University of Posts and Telecommunications (CQUPT), China
2School of Cybersecurity and Information Law Chongqing University of Posts and Telecommunications (CQUPT), China
3College of Computer Science & Technology, China Jiliang University, China
Correspondence to: Eden Adelaine Mareya, School of Modern Posts, Chongqing University of Posts and Telecommunications (CQUPT), China.
| Email: |  |
Copyright © 2025 The Author(s). Published by Scientific & Academic Publishing.
This work is licensed under the Creative Commons Attribution International License (CC BY).
http://creativecommons.org/licenses/by/4.0/

This study analyses the China-Africa maritime shipping network using Automatic Identification System (AIS) data, focusing on the key variables of port of origin and port of destination. Through Social Network Analysis (SNA), specifically the measure of degree centrality, the study quantifies port connectivity and identifies key players in the network. The analysis further explores how degree centrality correlates with key economic factors, including Gross Domestic Product (Deflator), Gross National Savings, Foreign Direct Investment (FDI), import and export volumes, and inflation, using multiple linear regression. The results reveal that FDI and export volume are the most significant drivers of port centrality, suggesting their crucial role in shaping trade flows between China and Africa. The Belt and Road Initiative (BRI) is considered within the context of its potential to enhance port connectivity and facilitate trade. This research provides valuable insights into the factors influencing port centrality in the China-Africa maritime network, offering implications for trade policy, infrastructure development, and global trade dynamics.
Keywords: Cargo Shipping Network, China-Africa Maritime, Connections, China-Africa
Cite this paper: Chensiqi, Eden Adelaine Mareya, Stewart Munyoro, Liberty Artwell Mareya, Analyzing the China-Africa Maritime Cargo Shipping Network, Journal of Logistics Management, Vol. 13 No. 1, 2025, pp. 13-19. doi: 10.5923/j.logistics.20251301.02.
Article Outline
1. Introduction
- The China-Africa maritime cargo shipping network has gained prominence in recent years, driven by the surge in bilateral trade, which reached $282 billion in 2021, an 11% increase from the previous year [1]. China's role as Africa's largest trading partner has become increasingly pivotal, supported by the Belt and Road Initiative (BRI) and its Maritime Silk Road component [2]. These initiatives have reshaped the maritime cargo network, with significant investments in deep water ports facilitating the expansion of trade routes. However, the network is not without challenges due to the effects of the pandemic such as global logistics issues and rising freight costs. It is typical to note that, the nature of the China-Africa maritime network presents new opportunities for both regions for instance developments are expected to bolster intra-African trade and improve African markets' access to Chinese investments, paving the way for a more interconnected and resilient economic landscape. It is essential to take into consideration especially the advent of the African Continental Free Trade Area (AfCFTA), which aims to enhance economic integration and resilience.
2. Relevant Literature
- Maritime transport began around 3,200 BCE with the use of sail ships in ancient Egypt, indicating its longstanding importance in trade and transportation. By 1,200 BCE, Egyptian vessels were already trading far-reaching distances, highlighting early inter regional connectivity [3]. Throughout the centuries, trade routes expanded, involving different civilizations including the Chinese and other traders in the 10th century, establishing significant maritime links between regions. Several studies have examined the broader evolution of maritime shipping networks, emphasizing the trans formative role of globalization and technological advancements. Research has shown that maritime transport accounts for over 80% of the global trade volume, with global supply chains relying heavily on efficient shipping routes observing that the number of active ports has nearly doubled between 1890 and 2000, indicating a substantial expansion of the maritime network driven by increasing trade demands [4].Furthermore, recent studies indicate that the network's growth is not merely a reflection of trade volume, but also of strategic geopolitical interests of logistical frameworks. Chinese firms have rapidly developed Africa's ports, transforming them into key nodes in the continuous flow of goods and services. This shift has enhanced trade connectivity and secure access to critical resources between China and Africa [5]. Moreover, based on ship Automatic Identification System (AIS) data, the study found that, from 2016 to 2019, the scope of China’s international liner shipping network was expanded. The number of nodes increased from 468 to 622, and the efficiency of the network has increased by 7.8% [6].More so, regression models serve as vital tools in transport network analysing the evolution of shipping networks as it clarifies the mechanisms behind shifts in cargo traffic and shipping networks over time [7]. Regression models contribute significantly to the understanding of maritime dynamics by Quantifying Relationships [8]. They provide empirical evidence on the strength and character of the relationships within the maritime shipping network, facilitating data-driven decision-making [9]. These models enhance forecasting accuracy for trade routes [10]. By leveraging these models, researchers enhanced knowledge of shipping networks and their expanding roles in the international trade landscape which can be essential in the maritime cargo shipping network [11]. The China-Africa Maritime Cargo Shipping Network can also be impacted by the Red Sea Conflicts as it has always been a critical transit point in global shipping. Major companies have indefinitely halted Red Sea operations, redirecting vessels around the longer route of the Cape of Good Hope, which adds significant transit time and costs [12]. This rerouting affects delivery schedules between China and African ports, potentially leading to supply chain disruptions [13]. The Red Sea crisis significantly impacts the dynamic of the China-Africa maritime cargo shipping network by altering shipping routes, increasing freight costs, contributing to port congestion, and prompting a re-evaluation of trade strategies. As trade relations continue to expand, understanding these implications is essential for maintaining a resilient and effective maritime logistics framework [14].While research on global maritime shipping networks is extensive, few studies focus specifically on the China-Africa maritime cargo shipping network. Existing literature outlines how geographical factors, technological advancements, and evolving trade practices influence maritime dynamics, but they often isolate the unique interactions between China and Africa [15]. For instance, analysis of technological transformations highlights innovations such as autonomous ships and AI-driven logistics, yet they fail to connect these advancements directly to the shipping activities between China and Africa. More so, many studies acknowledge the strategic motivations behind Chinese investments in Africa, the field lacks robust empirical analysis of how these investments are operational in the maritime sector in practice. Research indicating that China is reshaping the shipping landscape to enhance its economic security and access to resources does not sufficiently examine the operational mechanisms through which these goals are realized in the China-Africa maritime context [16]. There is a significant regression gap and the red sea conflicts with respect to comprehensive longitudinal analyses and overarching policy impacts. Therefore, it should be noted that the evolution of maritime networks has been extensively studied, specific investigations focusing on the China-Africa maritime cargo shipping network are limited. Addressing these research gaps could provide critical insights into how this evolving network functions.
3. Research Methodology
- As shown above, other studies have only mentioned the regression model, however they did not delve into detail in relation to China-Africa Maritime Cargo Shipping Network. The research is quantitative in nature and seeks to establish relationships between the maritime cargo flow between China and Africa and set of Independent-variables (Gross Domestic Product (Deflator), Gross National Savings, Foreign Direct In-vestment (FDI), goods and services imported and exported, and mean consumer price inflation). The study focuses on identifying the key factors influencing the maritime cargo shipping between China and Africa. Regression is the primary method used for analysing the data and to quantify the effect of these variables on cargo network volumes over time. The main data source for this study comes from Maritime AIS (Automatic Identification System) https://www.kpler.com/product/maritime/data-services#ais-maritime-data which tracks the movement of ships between Chinese and African ports. These datasets span several years, providing a historical overview of trade flows, which is essential for analysing the China-Africa Maritime Cargo Shipping Network between the two regions using two variables current port and destination port. Social Network Analysis (SNA) is a methodological approach used to study and analyse relationships, interactions and patterns of connections within a network.Regression is chosen for its simplicity and effectiveness in modeling linear relationships. In this study, regression will estimate the impact of independent variables on the dependent variable. This method helps in determining the most significant factors that influence the maritime cargo between China and Africa over time. Multi-Linear regression assumes that the relationships between the variables are linear and that errors (residuals) are normally distributed with a mean of zero. It is suitable when the goal is to model a dependent variable as a function of one or more independent variables, as is the case in this research.The Multi-Linear regression model can be expressed as
 Y = Dependable Variable (Degree Centrality)
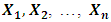 Independent Variables (Gross Domestic Product (Deflator), Gross National Savings, Foreign Direct In-vestment (FDI), goods and services imported and exported, and mean consumer price inflation)
 Is the intercept of the regression equation
 are the coefficients that represents the impact of each independent variable on the dependent variable
 is the error term or residual, representing the deviation between the actual and predicted values.Quantifying the relationship between key variables, this model provides insights into the evolving nature of the shipping network over time. Validation through residual analysis and statistical tests ensures the robustness and reliability of the model. This methodology offers a systematic approach to understanding the drivers of maritime trade between China and Africa, laying the groundwork for further policy and operational insights.
4. Data Analysis
4.1. Data Presentation
 | Graph 4.1. Port Connectivity (2018) |
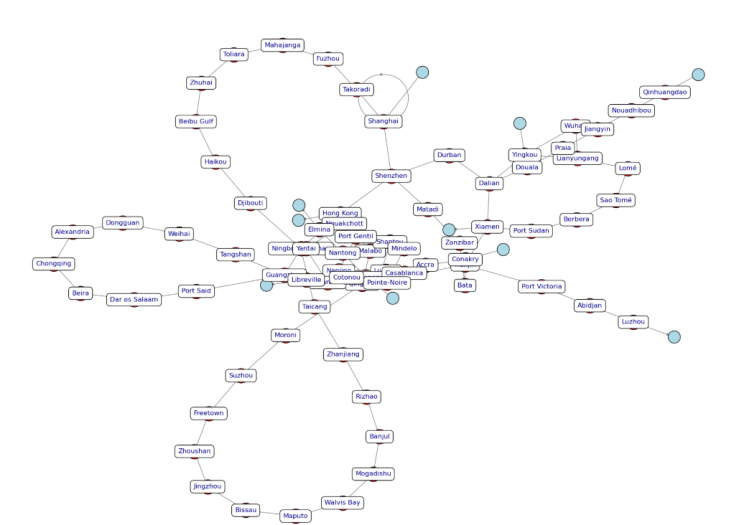
 | Graph 4.2. Port Connectivity (2020) |
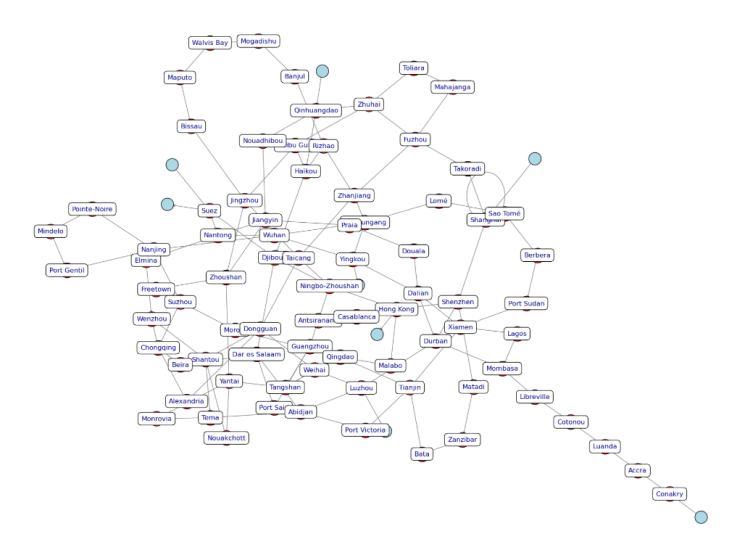
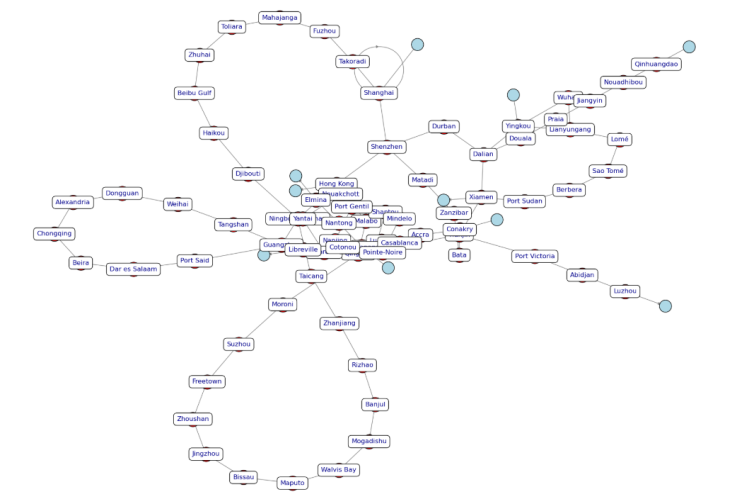 | Graph 4.3. Port Connectivity (2023) |
|
|
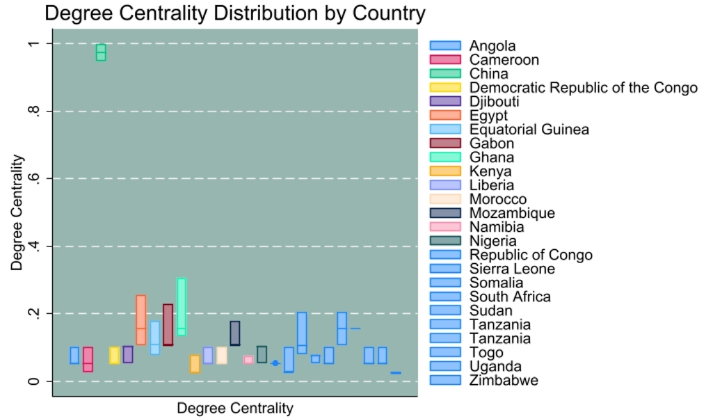 | Graph 4.4. Degree Centrality Distribution by Country |
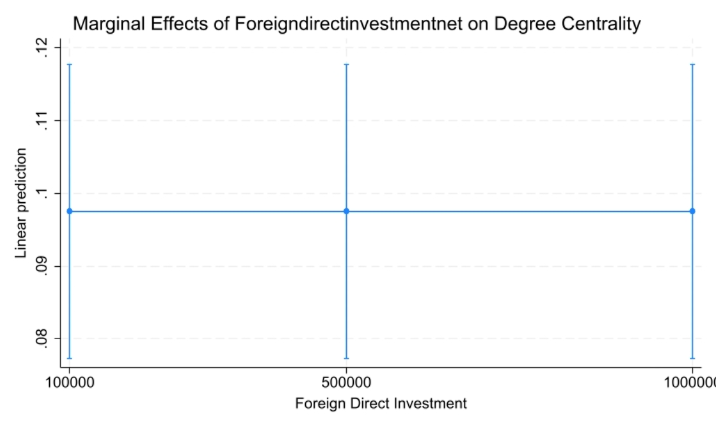 | Graph 4.5. Marginal effects of foreign direct investment on degree centrality |
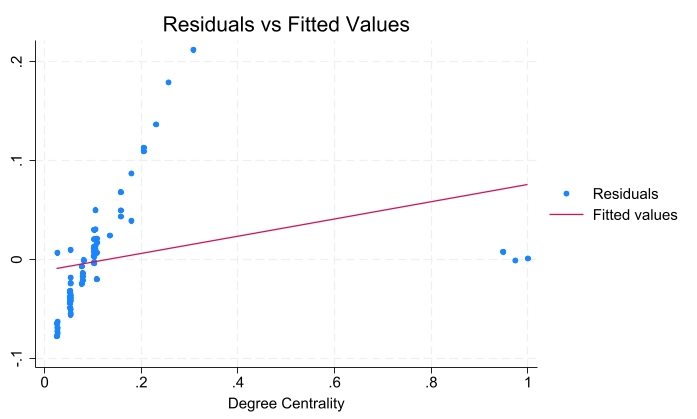 | Graph 4.6. Residuals vs Fitted Values |
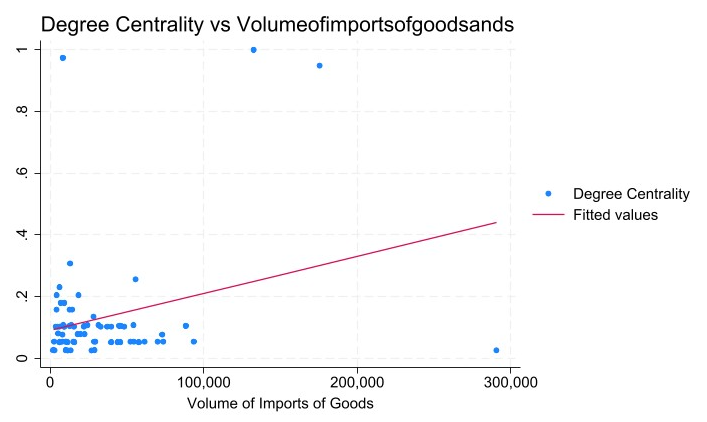 | Graph 4.7. Degree Centrality vs Volume of Imports of Goods and Services |
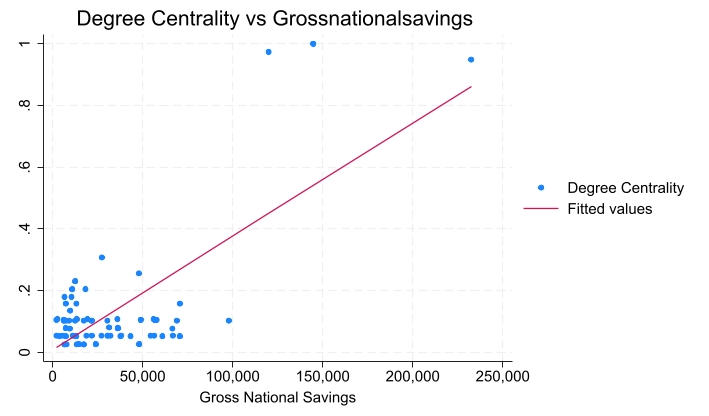 | Graph 4.8. Degree Centrality vs Gross National Savings |
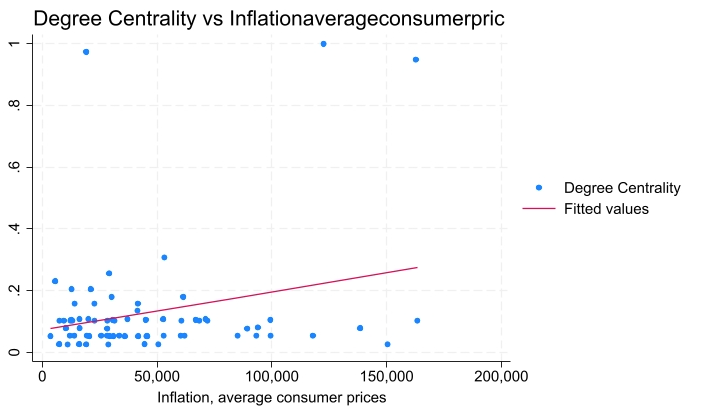 | Graph 4.9. Degree Centrality vs Inflation (Average Consumer Prices) |
4.2. Analyzing Inflation and Savings Effects on Maritime Connectivity
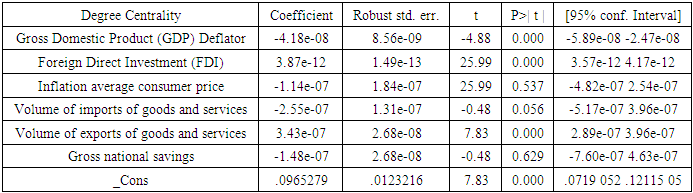
- The regression results show that inflation and gross national savings have minimal impact on port centrality. The non-significant relationship between inflation and port centrality (p=0.537) suggests that price stability in a country, while important for overall economic health, does not directly influence maritime connectivity. This may be because:1. Maritime shipping decisions are primarily based on demand for goods and infrastructure quality rather than local price fluctuations.2. International trade pricing mechanisms often offset domestic inflation effects.3. Long-term shipping contracts and relationships may insulate the maritime network from short-term price variations. The limited impact of gross national savings on port centrality (p=0.629) is noteworthy given the theoretical connection between savings and investment capacity. The finding suggests that:1. Direct foreign investment, rather than domestically mobilized capital, plays the dominant role in port development.2. The time lag between savings accumulation and infrastructure investment may obscure immediate relationships.3. In the China-Africa context, bilateral agreements and strategic partnerships may supersede the role of domestic savings in determining port development priorities.
4.3. Results and Discussion
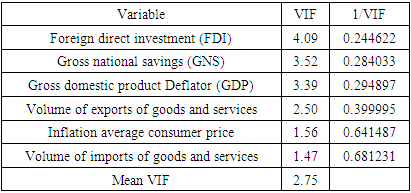
- Based on the results from Social Network Analysis (SNA), and VIF (Variance Inflation Factor), the specific factors shaping the China-Africa Maritime Cargo Shipping Network is identified by Foreign Direct Investment (FDI). The Social Network Analysis graphs highlight the existence of central ports in both China (e.g., Hong Kong, Shenzhen) and Africa (e.g., Durban, Mombasa). These ports form dense clusters that are critical to global trade between the two regions. Major ports that are central to global trade, like Hong Kong and Shanghai in China, and Durban and Mombasa in Africa, are key hubs in the network. Secondary ports in Africa, such as Accra or Douala, show fewer connections, highlighting the regional focus of trade. Ports with strong export and import volumes contribute significantly to the network's connectivity, serving as gateways for trade flows between China and Africa. Foreign Direct Investment (FDI) has the most significant impact on the degree centrality of ports, with a coefficient of 3.87e-12 (p < 0.001). This means that foreign direct investment plays an important role in determining how central a port is in a network. It should be noted that ports with higher FDI are more likely to have better infrastructure and more logistics systems. China’s investments in Africa’s ports are a key factor in increasing Africa’s participation in global maritime trade, improving trade flows and port connectivity between the two regions. Export Volume of goods and services have a significant influence on port centrality with 3.43e-07 (p < 0.001) coefficient. Ports in China such as Durban and Mombasa in Africa and Shanghai and Hong Kong in China serve as major export hubs which is critical to the trade flow between China and Africa. Volume of imports of goods and services generally boosts trade connectivity, however in this case it shows a negative but marginally significant effect on port centrality with a (probability = 0.056). Furthermore, inflation has no significant impact on port centrality which is why it have a probability value of 0.537 suggesting that inflation does not play a direct role in shaping port connectivity in the China-Africa Maritime Network. Moreover, even though inflation may affect the cost of trade or shipping, its limited impact on port centrality suggests that it is not a dominant factor in determining the connectivity of ports in the China-Africa network. The Gross National Savings has a non-significant effect on degree centrality, with a p-value of 0.629 suggesting that national savings have a minimal direct impact on port connectivity in the maritime network. While national savings might reflect the economic health of a country, they do not appear to influence the port centrality or the trade flows between China and Africa in the context of this model. The VIF values indicate that there are no severe multicollinearity issues in the model, with a mean VIF of 2.75. This suggests that each of the variables FDI, GDP Deflator, export volume, inflation, and import volume has a distinct role in influencing port centrality without being excessively correlated with each other. This is crucial because it ensures that the regression model's estimates are reliable and not distorted by overlapping influences between the predictor variables. It confirms that each factor is independently contributing to the explanation of degree centrality in the China-Africa maritime cargo shipping network.
4.4. Limitations of Analysis
- The robustness of any empirical analysis is inherently constrained by the quality and scope of the dataset and the assumptions embedded within the chosen analytical model. In this study, the limitations associated with both the AIS dataset and the multiple linear regression model must be acknowledged to ensure a comprehensive understanding of the findings. One of the primary limitations of the dataset pertains to temporal constraints. The AIS data utilized in this study covers three distinct years: 2018, 2020, and 2023. However, the inclusion of data from 2020 introduces a significant challenge, as this period coincides with the COVID-19 pandemic, which led to unprecedented disruptions in global shipping patterns. The pandemic-induced supply chain bottlenecks, changes in trade volumes, and shifts in maritime logistics strategies may have introduced anomalies that could affect the representativeness of the dataset for long-term trend analysis. Another, critical limitation is related to spatial resolution. While AIS data provides granular insights into vessel movements, it does not capture the full spectrum of port operations or the complexities of inland logistics networks. This limitation may lead to an incomplete representation of trade flows, particularly for landlocked African nations that rely on multimodal transport systems beyond maritime shipping.Additionally, the analysis relies on country-level economic indicators, which, while useful for broad assessments, may obscure regional variations within large countries such as China and geographically diverse African nations. Aggregated economic data may fail to capture localized economic disparities, variations in port efficiency, and regional trade dynamics that influence maritime shipping patterns. Additionally, our reliance on country-level economic indicators introduces potential aggregation bias. Large nations like China contain multiple economic regions with varying levels of development, while African countries exhibit considerable geographic and economic diversity. These regional variations are obscured when using national-level metrics, potentially masking important sub-national patterns that influence port centrality.The multiple linear regression model employed in this study carries inherent assumptions that may not fully align with the complex realities of maritime shipping networks. The model presupposes linear relationships between economic variables and degree centrality, yet some of these relationships may exhibit non-linear characteristics or threshold effects. For instance, FDI might need to reach a certain critical mass before significantly impacting port connectivity, a nuance that linear models cannot adequately capture.Furthermore, despite incorporating several economic indicators, our model inevitably suffers from omitted variable bias. Factors such as port efficiency metrics, quality of hinterland infrastructure, bilateral trade agreements, and regional economic integration initiatives likely influence port centrality but were not incorporated into the analysis due to data availability constraints. These omissions may affect the estimated coefficients of included variables and limit the model's explanatory power. These limitations, while important to acknowledge, do not invalidate our findings but rather contextualize them within the constraints of available data and methodological approaches. They also highlight promising avenues for future research that could address these shortcomings through expanded data collection, more sophisticated modeling techniques, and targeted case studies of specific port types or regional contexts.
5. Conclusions
- This study highlights the key factors shaping the China-Africa Maritime Cargo Shipping Network. The results indicate that Foreign Direct Investment (FDI) and export volume are the primary drivers of port centrality, emphasizing the importance of infrastructure investments and trade activities in enhancing port connectivity. GDP Deflator also plays a role, suggesting that economic conditions can influence port centrality, while factors like inflation and gross national savings have minimal impact on the network’s connectivity. The regression model and VIF analysis confirm that the factors are independently significant and do not suffer from multicollinearity, ensuring reliable estimates. Through Social Network Analysis (SNA), key hubs like Hong Kong, Shenzhen, Durban, and Mombasa were identified as central to trade between China and Africa. In conclusion, FDI and export volume are the most critical factors driving the China-Africa maritime network, providing insights into how economic investments and trade flows shape global maritime trade dynamics between the two regions.