-
Paper Information
- Paper Submission
-
Journal Information
- About This Journal
- Editorial Board
- Current Issue
- Archive
- Author Guidelines
- Contact Us
Journal of Logistics Management
2020; 9(2): 23-30
doi:10.5923/j.logistics.20200902.01

Reverse Logistics and Performance of Food Industries in Kenya
 Abstract
 Reference
 Full-Text PDF
 Full-text HTML
Jones Bor
PhD Candidate, Jomo Kenyatta University of Agriculture & Technology, Kenya
Correspondence to: Jones Bor, PhD Candidate, Jomo Kenyatta University of Agriculture & Technology, Kenya.
| Email: |  |
Copyright © 2020 The Author(s). Published by Scientific & Academic Publishing.
This work is licensed under the Creative Commons Attribution International License (CC BY).
http://creativecommons.org/licenses/by/4.0/

This study sought to find out the effect of reverse logistics on performance of food industries in Kenya. The study used an explanatory research design whereas the target population for study was the key staff in supply chain, production and safety and environment or equivalent managers in the 187 food processing firms in Kenya. A census survey of all the 187 food processing firms was carried out, the data collection instrument was a structured questionnaire and to accomplish the study objectives, a research hypothesis was developed and tested. Data analysis was conducted using descriptive and inferential statistical technique, further other statistical tests were done in the study. Presentation of data in form of charts and tables was deemed appropriate for this study. The study established that reverse logistics had a significant and positive effect on performance of food industries in Kenya. This study therefore concluded that reverse logistics when properly implemented leads to better performance in the food industries in Kenya. It recommended that a proper framework of reverse logistics should be put in place so as to steer firm performance.
Keywords: Reverse Logistics, Green Supply Chain Management, Food and beverage processing companies
Cite this paper: Jones Bor, Reverse Logistics and Performance of Food Industries in Kenya, Journal of Logistics Management, Vol. 9 No. 2, 2020, pp. 23-30. doi: 10.5923/j.logistics.20200902.01.
Article Outline
1. Introduction
1.1. Background of the Study
- Reverse logistics is an issue that has received growing attention, above all in the last decade given the confluence of several situations, compounded by the concern about environmental matters, sustainable development and economic benefits that could accrue to organizations through effective management of reverse logistics function. Reverse logistics is closely related to product recovery management in the context of manufacturing entities, the primary goal of recovery management is to cover as much of economic and ecological values in order to reduce the ultimate quantities of waste.Previously the manufacturing companies focus was on cost reduction and after embracing the concept of reverse logistics they began to optimize reverse flows in terms of value recapturing. Reverse logistics enables companies to recapture value that would otherwise be lost. Effective reverse logistics management can bring enormous benefits to the organization ranging from enhanced performance, better profits, and customer satisfaction. Chileshe N et, al (2015) opines that Reverse logistics focus is on waste management, materials recovery (recycling), parts recovery or product recovery (through remanufacturing). It is imperative to note that RL has gained attention in both developed countries, as well as emerging economies, all over the world including nations in Africa. The major reverse logistic processes are product acquisition/gate keeping, collection, inspection/sorting, disposition and redistribution.Kenya is a Developing country in East Africa with a Coast line on the Indian Ocean, it has a population of 47.6 million people as per the 2019 census results. According to (World Bank 2019) Kenya’s Gross Domestic Product (GDP) growth rate of 5.8 percent was achieved in 2019 and 5.7 percent in 2018 compared to 4.9 percent in 2017. Majority of the countries that are considered as developed, realized that status through the process of industrialization (Sheehan, 2008). Industrialization involves a shift of labour and capital from agricultural production into manufacturing sector, which should lead to an increase in the share of manufacturing value added in the Gross Domestic Product (GDP). Unfortunately for Kenya, the share of the manufacturing sector to GDP has been on a declining trend declining from 11.8% in 2011 to 8.4% in 2017 (Kenya Association of Manufacturers 2019).Returns management is a costly exercise for organizations, it is necessitated by products that are expired, recalled, damaged packaging or delivered incorrectly (Sameer et al 2009; Martin, 2007). Returns handling can be measured in terms of volumes handled to indicate the size of the operation. According to Sameer et. al. (2009) returned products can be handled up to four times, while adds no value to the customer, yet adds significant cost to the supply chain. The two most common causes of returns in the pharmaceutical industry are expired drugs and recalls. Most organizations must deal with product returns for various reasons, for instance, customers change their minds, items are damaged or have quality problems, merchandise is unsold, or products are returned at the end of their usable life. Products recovery and reuse reduce the negative effects on environment, mainly reducing waste disposal, extraction of raw materials and transport and distribution emissions. Furthermore, firms can recover value from end-of-life products by reusing components, recycling materials or recovering energy through incineration (Mario et al., 2013; Kleindorfer et al., 2005).Globally, manufacturing has acted as a growth escalator for economies that has succeeded in evaluating high income, hence the Kenyan Government has been keen on the growth of its Manufacturing Sector. Manufacturing sector is key for Kenya to achieve its desired economic goals as captioned in Governments Big Four Agenda Pillars, Manufacturing is the only one guaranteed to create jobs and contribute to GDP in short term and medium term therefore it is imperative to prioritize the sectors productivity, in particular the Food & Beverage Sector, (KAM Priority Agenda, 2019). The food & beverage industry is the largest sector and constitutes 22 percent of total Kenya Association of Manufacturers membership, the sub-sectors under this includes; dairy products, alcoholic beverages, spirits, juices, bakers & millers, water, cocoa, carbonated soft drinks, chocolate & sugar (K.A.M 2016). Food processing entails the transformation of raw ingredients into food or transformation of food into other forms that can be consumed by humans or animals. Performance measurement is the process of quantifying the effectiveness and efficiency of action where measurement is the process of quantification and action leads to performance (Arif-Uz-Zaman et al., 2014). Effectiveness is the extent to which a customer’s requirements are met and efficiency is a measure of how economically a firm’s resources are utilized when providing a pre-specified level of customer satisfaction. Performance measurement systems (PMS) are described as the overall set of metrics used to quantify both the efficiency and effectiveness of action (Arif-Uz-Zaman et al., 2014). The essence of performance measurement is to identify whether customer needs are met, bottlenecks and wastages, further it comes in handy on decision making to ensure that management decisions are based on facts.
1.2. Statement of the Problem
- Manufacturing sector is very competitive, therefore companies are searching for better ways of improving their processes and customer satisfaction, hence reverse logistics is considered as one of the strategies of enhancing performance. The manufacturing sector plays a very critical role in any economy through the creation of productive employment and opportunities for wealth generation through direct linkages to all sectors of the economy, the sector continues to face a myriad of challenges that have seen it fail to realize its full potential. Reverse logistics is a component of green supply chain practices which can be leveraged upon to enhance firms performance, however although reverse logistics is widely practiced in other industries globally, information on reverse logistics in Kenyan context is limited. Sharma et al. (2016) opines that effective management of reverse logistics can be beneficial to the organization, proper planning and implementation of reverse logistics could accrue profits, customer satisfaction and socio-economic benefits to the organization.As per the Kenya National Bureau of Statistics(KNBS) economic survey (2019), there was a deceleration in Kenya’s economic growth compared to the previous year (2018), the slowed overall performance was occasioned by relatively slower growth in activities of manufacturing, from the sectoral analysis performance manufacturing performed dismally with a growth rate of (3.1%), agriculture, forestry and fishing (3.2%), electricity and water supply (4.9%), transportation and storage(7.1%), accommodation and food service activities (9%), information and communication (8.4%), construction (6.6%) and finally financial & insurance activities posted (5.6%). The weak performance can be attributed to high operations cost hence there’s need to investigate the underlying relationship between reverse logistics adoption and performance of food industries in Kenya.Empirical studies investigating the existence of sustainability initiatives are limited, particularly those which focus on reverse logistics efforts especially in food industries, the notable ones include; Rao & Holt (2005), Green et al., (2012) and Runala and Zaffar (2015) found a positive relationship between environmental practices and organizational performance, whereas other studies such as De Giovanni and Esposito Vinzi (2012) and Huang et. al., (2012) proved that there were no significant relationships between such practices and organizational performance, therefore this study tried to prove it in the African Context.
1.3. Objective of the Study
- 1. To investigate the effect of Reverse logistics on performance of food industries in Kenya.
2. Theoretical Background
2.1. Reverse Logistics
- The term Reverse Logistics (RL) was first published by James R. Stock by the Council of Logistics Management in 1992. It is the process of backward flow of moving goods for the purpose of capturing value, proper disposal, remanufacturing and refurbishing activities. Reverse Logistics (RL) is emerging trend in Supply Chain Management to gain more competitive advantage in terms of their value, profitability, sustainability and provide additional advantage in any type of industry, Reverse Logistics can be applied in the industrial practice under logistics management. This concept mainly focuses on recovery of the product through 3R (Reuse, Remanufacturing and Recycle) concepts (Sathiyagothai B and Saravanan S 2017). Reverse Logistics (RL).RL is the process of planning, implementing and controlling the efficient, cost-effective flow of raw materials, in-process inventory, finished goods, and related information from the point of consumption to the point of origin for the purpose of recapturing value or of proper disposal (Campos et. al 2017). It is economically viable to factor in the reverse logistics framework during the conception of a products life cycle. Mishra and Napier, (2014) opines that reverse logistics entails the reverse flow of materials and information with the purpose of reusing, reconditioning and recycling useful components that can be placed on the market once again through their transformation into new products.The concept of reverse logistics has been receiving increased attention in the recent decades due to numerous factors, such as competition between companies, social marketing, environmental interference and economic aspects (Kabir, 2013). Returned products are collected from the customer through product acquisition and are inspected and sorted out into different categories. The next step is to take disposition decision for further processing. Reuse; repair; refurbish, remanufacture; recycle; and disposal are the common disposition alternatives discussed by authors frequently in the literature (Thierry et al., 1995, Blackburn et al., 2004; Carter and Ellram, 1998; Krikke et al., 2003; Agrawal et al., 2016).Reverse logistics entails planning, implementation, and control of the efficient & cost-effective flow of raw materials, work in process inventory, finished goods and related information from the point of consumption to the point of origin in order to create value and proper disposal (Sharma et. al., 2016: Hawks, 2006). Further, reverse logistics can incorporate remanufacturing and refurbishment. The primary focus of reverse logistics is the reverse flow of materials from customers to suppliers with the aim of maximizing value from the returned items or reduce the total cost incurred, such products can be sorted for re-use, re-manufacture, re-cycle and disposal (Sharma et al., 2016). Previous studies have shown that recovery of used products is more economically sound than disposal hence organizations are very keen on this concept. Sharma et. al., (2016) asserts that proper planning and implementation of reverse logistics could accrue profits, customer satisfaction and socio-economic benefits to the organization. Reverse logistics has become a competitive necessity for many firms, recently the concept of reverse logistics has gained significant attention in both academia and practice, due to a variety of reasons especially those pertaining to environmental concerns (Sajan et. al., 2017). It includes the motive for economic potential associated with used products and the resulting business options. With respect to this a number of multinational firms have recognized and embraced reverse logistics practices, for instance Dell, General Motors, HP, Kodak & Xerox (Ulster et. al., 2007).Traditionally, the product flow in a distribution channel happens from the industry towards the final consumer. However, some factors such as defective products, or damages, expired dates, order errors, among others, cause a flow in the opposite sense which generate the need for a logistics operation called reverse logistics (Gisele and Rosane, 2006; Somuyiwa and Adebayo 2014) as well as the minimization of the consequences on the environment that is environmental logistics. According to Rogers et al. (2002) customer returns due to buyer’s remorse or defects, are generally the largest category of returns. Key reasons for customer returns include; defective/unwanted products, liberal return policies/customer dissatisfaction, incorrect products, warranty returns and damaged products. The classic supply chain approach, now called the forward supply chain, does not feel any responsibility for end-of-life (EOL) products. Then, the reverse supply chain, or reverse logistics (RL), tries to account for EOL products in the most environmentally friendly manner possible. The evolution of the supply chains leads to an integrated approach of considering both forward and reverse supply chains simultaneously populated as closed-loop supply chain (CLSC). (Kannan Govindan and Hamed Soleimani 2016).Environmentally friendly practices and the need to maintain sustainable development are important aspects in the debate surrounding reverse logistics. By not embracing sustainability, organizations face consequences in terms of increased economic and social liability (Savits 2002; Michael Bernon and John Cullen 2007). Sustainable development embraces the “triple bottom line” philosophy of not compromising the future needs of society, the economy and the environment.There’s need for the food and beverage processing firms to handle the reverse logistics function appropriately owing to the cost associated with the process. A study by Min & Ko (2008) established that organizations have not been keen to return merchandise until things get out of control. Reverse logistics practices usually reduce organizations current assets as it lowers returned products, inventory value and lengthens order cycle time due to shipping of ordered items, further Min & Ko (2008) states that it causes organization to lose sale and thus sales revenue. Proper management of product returns has a positive impact on customer satisfaction level & retention, (Senthil et al., 2014; Sharma et. al., 2016). Previous studies have proved that organizations that have embraced reverse logistics as an opportunity for enhanced business tend to prosper through customer support and the ultimate issue for profitability, further a study by (Sharma et. al., 2011) points out that awareness of reverse logistics could bring economic benefits by recovery of returned products for use.
2.2. Food Industry in Kenya
- The Kenyan Food Industry is one of the most important sectors in world economy with a highly significant relevance for economic and environmental development as well as social wellbeing. Vlachos, IP (2014) opines that the major challenge for reverse logistics in the food industry relies on the perishable nature of food and agricultural products which have short shelf life and require fast and efficient logistics operations. Even the smallest deviation in an organoleptic characteristic may create a food safety incident and subsequently pose a possible threat to consumer’s health.The food and beverage industry is the largest sector and constitutes 22 percent of total KAM membership, the sub-sectors under this includes; dairy products, alcoholic beverages, spirits, juices, bakers and millers, water, cocoa, carbonated soft drinks, chocolate and sugar (K.A.M 2016). Food processing entails the transformation of raw ingredients into food or transformation of food into other forms that can be consumed by humans or animals. Traditionally food processing was meant to make food more digestible and preserve food during times of scarcity. Food processing typically takes clean, harvested crops or butchered animal products and uses these to produce attractive, marketable and often long shelf life food products.Lifestyle of health and sustainability (LOHAS) have recognized that global warming has a substantial impact on social, economic, political, and technological factors; social media, politicians, and non-profit companies have played a role in increasing public awareness of this concern (Lee & Kim, 2015; Pretel et al., 2016; Unger & Landis, 2016; Wang 2016). LOHAS consumers are enthusiastic about adopting cleaner technologies as well as reducing greenhouse gas emissions that cause global warming; this is reflected by LOHAS consumer participation in relevant volunteer activities (Wang 2016; Kulak et al., 2016; Lee & Kim, 2015).Following this trend, all major businesses worldwide, including those in the hospitality sector, must consider the impact of their operations on the environment. Wang (2016) noted that the food and beverage industry influences the environment in three ways, first services provided in restaurants have direct environmental impacts, including energy consumption, solid waste generation, air emissions, water emissions, food borne diseases, and refrigerant emissions. Second, the industry has an upstream environmental impact, namely, pollution produced by suppliers, manufacturers, and farms that supply restaurants for instance pesticide residues, animal waste, and food contaminants introduced during production. Third, the industry has a downstream environmental impact, namely, consumer behavior, including excessive use of disposable tableware and plastic bags, considering these impacts, it is evident that the food and beverage industry uses massive quantities of energy, water, food materials, and detergents. Therefore the industry cannot ignore its responsibility to protect the environment. Reducing energy usage and carbon dioxide emissions is a crucial goal of the food and beverage industry (Wang 2016).World Bank ESMS implementation hand book (2014) outlines food and beverage companies are confronted with a number of significant environmental and social challenges. Though the challenges are insurmountable, but if not effectively addressed and managed, they will hurt the firms’ core business operations and profitability. Some of these challenges are increasing energy and raw materials costs, the growing power and influence of environmental and labor regulatory agencies, and rapidly evolving consumer awareness and concerns about environmental and social issues. In addition is the primary risk of failing to manage food safety while building brand and consumer confidence. All of these risks ultimately can have financial consequences, (IFC World Bank 2014). Previous research has shown that there are direct business benefits from implementing environmental practices, conserving and using energy and materials efficiently helps to reduce production costs, reducing waste and discharges can minimize the cost of increasingly expensive, regulated discharges to the environment these could be the greenhouse gases and wastewater. Organizations can realize financial benefits from waste management, instead of merely capturing and treating process wastes with no benefit, further organic wastes can be converted to biogas for boiler fuel or generate electric power, or organic fertilizer and soil amendments to strengthen crop production sustainability.
2.3. Firms Performance
- Effective reverse logistics can result in direct benefits, including improved customer satisfaction, decreased inventory levels, and reductions in storage and distribution costs, a well-managed reverse logistics program can result in savings in inventory carrying, transportation, and waste disposal costs as well as improving customer satisfaction. Performance of reverse logistics can be measured the in terms of improved customer relations, environmental regulatory compliance, cost containment, improved profitability, recovery of products and reduced inventory. (Somuyiwa, Adebambo O. and Adebayo, Iyabo T. 2014).For any business activity supply chain has strategic implications on its performance, identifying the required performance measures on most of the criteria is essential and it should be an integral part of any business strategy (Pandiyan et al., 2016; Chia et al., 2009). Supply Chain Performance has been defined as a systematic process of measuring the effectiveness and efficiency of supply chain operations (Pandiyan et al., 2016). It promotes the collaborative integration among members of the supply chain in a specific industry.It is essential for organizations to effectively monitor their performance as it helps place them on the path financial stability and service excellence, (Pandiyan et al., 2016), it should be noted that for firms to continuously improve their supply chain process, there’s need to use a manageable number of metrics in order to enhance business success, since what gets measured gets managed.Performance measurement is the process of quantifying the effectiveness and efficiency of action where measurement is the process of quantification and action leads to performance (Arif-Uz-Zaman et al., 2014). Effectiveness is the extent to which a customer’s requirements are met and efficiency is a measure of how economically a firm’s resources are utilized when providing a pre-specified level of customer satisfaction. Performance measurement systems (PMS) are described as the overall set of metrics used to quantify both the efficiency and effectiveness of action (Arif-Uz-Zaman et al., 2014). The essence of performance measurement is to identify whether customer needs are met, bottlenecks and wastages, further it comes in handy on decision making to ensure that management decisions are based on facts.A number of studies have highlighted that firms have been unable to maximize the potential of their supply chain performance primarily due to their inability to integrate the needs of the respective partners (Cadden et. al., 2013; Gunasekaran et al., 2013). It is recognized that supply chain performance is difficult to define largely, because any such measures must be understood by each of the supply chain participants. These measures could include; operational measures such as operating cost, inventory costs, flexibility (Cadden et. al., 2013), delivery performance (Cadden et. al., 2013; Ahmad & Schroeder, 2003; Beamon, 1999; Gunasekaran et. al., 2001) and the financial measures.
2.4. Relationship between Reverse Logistics and Performance
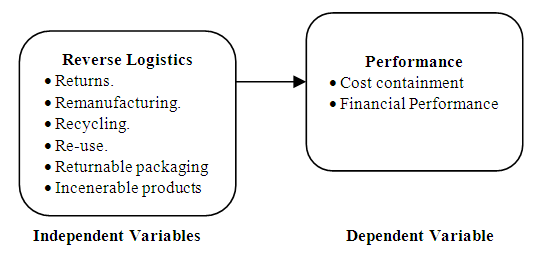 | Figure 2.1. Conceptual Framework (Source: Researcher (2019)) |
3. Methodology
3.1. Research Design
- The study adopted explanatory research design given that the study aimed at examining the effect of reverse logistics on performance of food industries in Kenya. This research design is appropriate since it is quantitative in nature hence hypotheses can be tested by measuring the relationships between variables, further it will facilitate data analysis using statistical techniques. The performance constructs are, cost and financial aspect.
3.2. Target Population
- The population of interest in this study were managers in supply chain/production and safety & environment working for the 187 food processing firms in Kenya being the unit of analysis, one response per firm. The focus was on understanding the knowledge of the participants with respect to reverse logistics practices implementations with their organization and how it affects their decisions. This survey was carried out in the food manufacturing sector since its products are consumed frequently which bolters the essence of logistics decision to deliver them to customers.
3.3. Sampling Technique and Sample Size
- A Census survey was conducted to all the 187 Food processing firms registered with the Kenya Association of Manufacturers being the unit of analysis. The unit of observation comprise Senior Managers in Supply Chain, Production and Safety & environment for the 187 Food and Beverage processing firms.
3.4. Data Collection Methods
- The data used in this study consist of questionnaire responses from managers in Kenyan food processing firms. The questionnaires were administered to a subset of the population of interest that comprised of managers with knowledge of their organizations Supply Chain Activities i.e. Supply Chain Managers, production managers and safety & environment managers.
3.5. Data Analysis and Presentation
- The survey data was analysed using Descriptive and Inferential Statistical analysis techniques, descriptive statistics gives the profile of the respondents i.e. frequencies and their percentages whereas inferential statistics adopted a Linear Regression Analysis Model in order to determine the effect of explanatory variable on performance in the Food industries in Kenya. Inferential statistics was used to test & validate the hypothesised relationships between reverse logistics and performance, the responses were coded and analysed using SPSS statistical software Version 24. Inferential univariate analyses was used to process the survey data results based on likert scale evaluations that allowed statistical & graphical representation.
4. Results
4.1. Response Rate
- The study sought to collect data from 187 food and beverage companies who are registered members of Kenya Association of Manufacturers, the survey managed to obtain feedback from 161 firms translating to a response rate of 86.1 percent.
4.2. Descriptive Findings
4.2.1. Effect of Reverse Logistics on Performance of Food Industries in Kenya
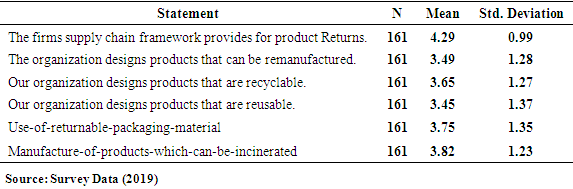
- The study sought to establish the effect of reverse logistics on performance of food industries in Kenya. The respondents were asked to indicate their levels of agreement on specific statements regarding reverse logistics based on a five-point Likert’s scale. The findings are as shown in table 4.1. As the findings portray, on the first statement that the company’s supply chain framework provided better product return frameworks and channels, most of the respondents agreed with the statement as evidenced by a mean of 4.29 and a standard deviation of 0.99 while on the second statement that the organizations designed products that could be remanufactured, most of the respondents agreed neither agreed nor disagreed with the statement as shown by a mean of 3.49 and a standard deviation of 1.28. On the third statement that the organizations designed recyclable products, a slight majority of the respondents agreed with statement as shown by a mean of 3.65 and a standard deviation of 1.27. The findings imply that reverse logistics is not highly upheld in the food and beverage processing sector an aspect that could sabotage performance.
|
4.2.2. Performance of Food Processing Industries in Kenya
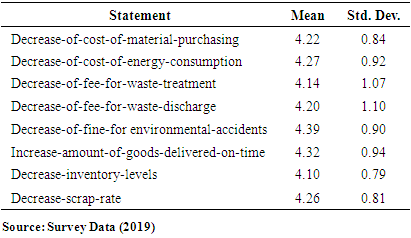
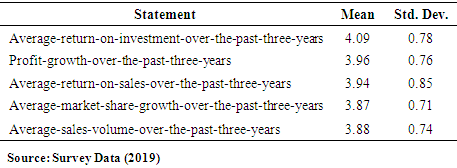
- The study sought to find out the performance of food and beverage processing companies in Kenya as the dependent variable for the study. The main measures used to unveil the performance of the companies as far as supply chain is concerned were cost containment and financial aspects of the firms. The findings are therefore presented based on these measures.Cost ContainmentThe study sought to find out performance of food processing companies based on the cost containment. The findings as indicated in table 4.2 revealed that most of the firms had attained a decrease in cost of material purchasing, cost of energy consumption as well as decrease in fee for waste treatment as evidenced by means of 4.22, 4.27 and 4.14 respectively. The findings further showed that majority of the firms had recorded decrease in fees for wasted discharge as well as fines for environmental accidents as shown by mean of 4.20 and 4.39. Increase in goods delivered on time, decrease in inventory levels and decrease in scrap rates were also recorded. This indicates that the performance of the organizations as far as cost containment was concerned was relatively high. This is an implication that food processing companies in Kenya were working towards enhancing their performance by upholding sustainable supply chain practices such as reverse logistics. The findings concur with those by Large and Thomsen (2011) who stipulated that as a result of effectively observing the sustainable supply chain practices, firms benefit from decreased operational cost in both the short-term and long-term.
|
|
4.3. Regression Analysis
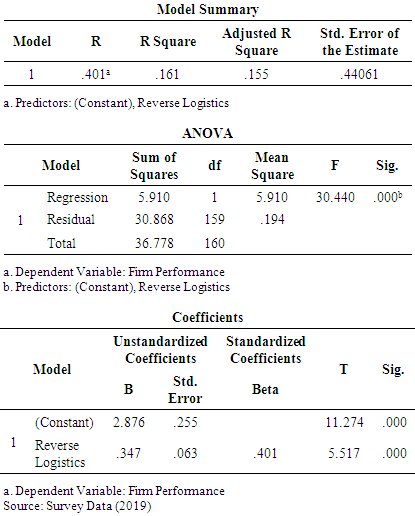
- Effect of Reverse Logistics on performance.H1: Reverse logistics has a positive significant effect on performance of food industries in KenyaThe study sought to find out the relationship between reverse logistics and performance of food industries in Kenya. The statistical relationship between the two variables was sought through regression model whereby the output was generated in terms of model summary, ANOVA and regression coefficients. The model adopted herein was of the form: Y=α0+β1X1+ɛ. The findings on the model summary as shown in table 4.4 revealed that the R2 for the model was 0.161 an indication reverse logistics explained up to 16.1% variation in performance. The ANOVA results on the other hand revealed that at an F-calculated of 30.44, the model was significant at a significant level of 0.000<0.05. This implies that performance of the food industries could be explained by reverse logistics and that the model was significant to give a direction on whether to accept of fail to accept the alternative hypothesis.
|
5. Conclusions and Recommendations
- The main aim of this study was to establish the effect of reverse logistics on firms performance in the food manufacturing sector in Kenya. It’s worth mentioning that the relationship between reverse logistics and performance of manufacturing organizations constitute a gap in literature. The aim of the study was to address the gap by investigating whether there’s a correlation between reverse logistics practices and firm performance, from the analysis of interactions, the study established that there exist a positive significant relationship between reverse logistics and performance, this could be attributed to a framework for waste reduction and cost mitigation through the concept of reverse logistics within the food manufacturing supply chain. The study concluded that efficient and effective management of reverse logistics in the food and beverage manufacturing firms led to better performance.Correspondingly the study recommended the adoption of reverse logistics as a management strategy to boost manufacturing firms’ performance. The study established that there is a positive significant relationship between reverse logistics and firms performance and there’s need to invest in a sustainable reverse logistics framework for the manufacturing firms. By so doing the organization will leverage on enhanced performance.