-
Paper Information
- Paper Submission
-
Journal Information
- About This Journal
- Editorial Board
- Current Issue
- Archive
- Author Guidelines
- Contact Us
Journal of Logistics Management
2020; 9(1): 1-6
doi:10.5923/j.logistics.20200901.01

A Critical Review of Simulation Applications in Supply Chain Management
 Abstract
 Reference
 Full-Text PDF
 Full-text HTML
Jemimah Maina1, Patrick Mwangangi2
1School of Business and Economics, Kirinyaga University, Kenya
2Department of Entrepreneurship and Procurement, Jomo Kenyatta University of Agriculture and Technology, Kenya
Correspondence to: Jemimah Maina, School of Business and Economics, Kirinyaga University, Kenya.
| Email: |  |
Copyright © 2020 The Author(s). Published by Scientific & Academic Publishing.
This work is licensed under the Creative Commons Attribution International License (CC BY).
http://creativecommons.org/licenses/by/4.0/

Supply Chain Management is a process that manages the flow of goods and services and related information from the point of origin to the point of consumption. Supply Chain Management is a complex process as it involves a lot of activities like purchasing, production, inventory management, logistics and transportation. Globalization has increased this complexity due to the numerous suppliers, customers and logistics service providers located in different geographical locations. In order to manage this complexity, simulation software’s can be used as they mimic real life situations and they will help managers in making superior decisions on areas like facility location, transportation choice and inventory model choices. This paper analyzed the literature and identified Supply Chains adopting simulation to aid in the decision making process thereby improving Supply Chain Performance. A critical analysis of the case studies was conducted and the results reveal that simulation is a powerful tool that can be used in modeling complex supply chain activities. Simulation models however fail to provide optimum solutions for decision variables inherent in predefined objectives. Therefore, integrating optimisation models would offer best likely alternatives for decision makers. Managers should therefore select the most suitable model that best symbolizes the system under study.
Keywords: Simulation, Modeling, Decision Support Systems, Supply Chains, Supply Chain Management
Cite this paper: Jemimah Maina, Patrick Mwangangi, A Critical Review of Simulation Applications in Supply Chain Management, Journal of Logistics Management, Vol. 9 No. 1, 2020, pp. 1-6. doi: 10.5923/j.logistics.20200901.01.
Article Outline
1. Introduction
- In recent years Logistics and Supply Chain Management have received great attention as many organizations have valued Supply Chain Management (SCM) as an important strategy in attaining competitive advantage (Chan & Chan, 2005). Supply Chain Management is the process of designing and coordinating the supply chain network and it involves managing the flow of goods and services and all other activities that transform raw materials into finished goods (LeMay, M.Helms, Kimball, & McMahon, 2017; Hayes, 2019). A Supply Chain (SC) is a network extending from the suppliers to the customers and involving resources, people who exchange information, goods and services. SCs could also contain different echelons representing suppliers, facility plants, warehouses and distribution centres and customers (Lambiase, Mastrocinque, Miranda, & Lambiase, 2013). According to Hwarng & Xie (2008) SCs are very difficult to manage as they are dynamic and highly characterised by the bullwhip effect which is greatly influenced by vast changes in consumer demand. They add that simulation and modelling tools are prerequisite in gaining resilience in these SCs. Hou (2013) describe simulation as a process of experimenting models in a controlled virtual environment so as to replicate the working of a system in order to understand the system better. Simulation assists in designing and evaluating performance of complex SC facilities before actual implementation which allows better utilization of resources and also analyse the existing facilities to identify the extent to which SC problems are in order to modify them (Chan & Smith, 1993). Simulation applies various techniques such as multi-agent simulation, Monte Carlos simulation, continuous and discrete event simulation. The latter is more often used in modelling the SC and Chan & Chan (2004) are of the opinion that in applying these simulation techniques, qualitative performance measures such as customer satisfaction, flexibility of the system to the demand pattern, effective risk management, supplier performance in terms of delivery and quantitative factors like cost minimization, profit maximization, capacity and resources utilization maximization could be used to design proposed systems so as to determine the values of the variables that yield optimum performance levels. This paper aims to critically review simulation applications in SCM and various case studies have been presented within the SC context.
2. Methodology
- The main aim of this paper is to critically review simulation applications in Supply Chain Management. This was achieved by systematically reviewing published case studies that had applied simulation in their SC networks. Winchester & Salji (2016) asserts that a critical literature review aids in looking for key themes and provides for an overview of what they say to draw meaningful conclusions. Numerous cases were identified through searches of ‘supply chain simulation’ or ‘simulation applications in supply chains’ keywords but most had minimal information on the case description. Four cases were analysed as these had in-depth information on the type of simulation applied, how it was conducted and the effect these technologies had on the SC performance. The cases were selectively chosen to cater for different sectors. These included the petroleum SC, Chemical industry SC, Information Technology SC and automotive SC. A critical analysis of these simulations is provided to draw viable conclusions and recommendations. According to Gustafsson (2017) multi-case studies is useful in giving the similarities and differences between the cases and it gathers strong and reliable evidence.
3. Case Studies of Simulation Application
3.1. LPG Supply Chain
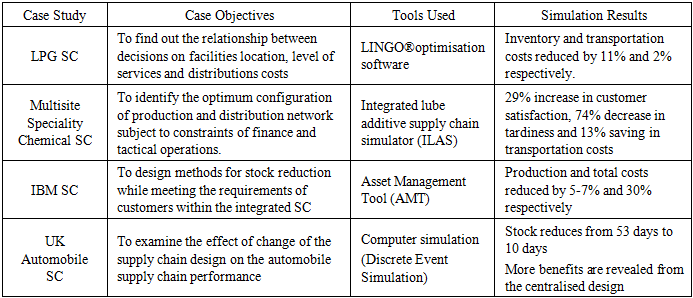
- A literature review by Masudin (2015) illustrate the application of a simulation model in Indonesian Liquefied Petroleum Gas (LPG) SC to find out the relationship between decisions on facilities location, level of services and distributions costs. It explores how the simulation model will affect the inventory and transportation decisions taking into account the existing facilities and the main objective was determining the optimum location of the distribution centres for the LPG facilities constrained by capacity and demand of each facility and the link between supply and demand between the facilities. A Capacity fixed-charge facility location-allocation problem is cast-off to find out the optimal solution for this model.According to Zuo-Jun, Shen, & Qi (2007) decisions on facilities location, inventory management and distributions are very important in being integrated together in the decision support system to give a company a competitive advantage. To fix the challenge faced in LPG, a proposed location-allocation four echelon model was built using LINGO®optimisation software, incorporating the fixed costs, inventory and transportation costs.Based on a transportation research policy and practice by Melkote & Daskin (2001) transportation decisions will have an impact on location decision in terms of costs. Transportation costs portray a non-linear relationship with investment budgets while the facility expenditure rises with an increase in the budget. However a research by Zuo-Jun, Shen, & Qi (2007) reveals that as the number of facilities increases, so do the transportation costs thus creates a linear relationship between them.According to the LPG study 5566 variables and 263 constraints were simulated in the model to get the optimal transportation cost which was found by identifying the ideal situation that reduces the total costs and maximizes the customer’s service. It was discovered that in applying the model, total costs would be saved by USD 106.57 million from (5149 to 5042). Inventory and transportation costs would also reduce by 11% and 2% respectively. With a constant inventory holding cost of USD 138 per tonne per year, the sensitivity analysis of the study revealed that an increase in the number of facilities causes a rise in inventory and transportation costs. Interestingly, these costs also increase with an increase in demand and the service level is improved when more facilities or distribution centres are opened.
3.2. Speciality Chemicals Supply Chain
- Adhitya & Srinivasan (2010) in their article discuss the application of dynamic simulation for multisite speciality chemicals SC which has been implemented in Matlab/Simulink, with the name integrated lube additive supply chain simulator (ILAS). This model encompasses different processes within the SC which includes acceptance and assignment of jobs, job scheduling, and procurement of raw materials, storage and production. The key players for this SC are suppliers for raw materials, third party logistics, providers and shippers, and the customers. It has been used to analyse the performance of the SC in terms of profit, decision making and customer satisfaction measured by the waiting times of raw materials to arrive.According to Kannegiesser (2008) the chemical industry has a very divergent and long SC and this industry is the biggest consumer of its own. It is highly characterised by social-political uncertainties and regulations regarding to the environment and energy prices. Due to this complexity, dynamic simulation is highly recommended to overcome these barriers. One of the major contributions of system dynamics is the use of the beer game model by Jarmain 1963 in management education (Hwarng & Xie, 2008). Aspentech (2003) commentate that dynamic simulation captures the behaviour of the entities, their interactions and uncertainties hence leading to decreased cycle times of projects, even start-ups and production optimization. Nevertheless Hutton (2012) augments that dynamic simulation does not guarantee future performance and therefore a comparison of alternative models should be made to select the one with desired results.The main objective of the case study is to identify the optimum configuration of production and distribution network subject to constraints of finance and tactical operations. Uncertainties which include order detail arrivals, transportation times for raw materials, processing and packaging times are preoccupied by stochastic variables in the model. Wylde & Failor (2014) instil that stochastic variables reveal uncertainties in underlying models which guarantee future performance. In this context, sales jobs are assigned based on an equal assignment policy within the three plants of Singapore(S), Houston (H) and Japan (J). Simulation reveals that this leads to a low customer satisfaction level of 66% and a high unpunctuality of 295 days. This problem has been fixed by assigning orders to the Singapore plant which has led to a 29% increase in customer satisfaction measured by less waiting times for the arrival of raw materials, 74% decrease in tardiness and 13% saving in transportation costs. Plant S have 50% longer processing times, 2.5 times higher delays in processing but 25% lower processing costs as it is aging. The strategic decision made is to either sell it, upgrade it or leave it as it is considering various demand forecast. After running simulation, the decision taken is to upgrade it as a high profit of USD 16.32million and 96% customer satisfaction is revealed. Simulation in this case has been used to optimize parameters and investigate disruption impacts thereby providing support for strategic decisions.
3.3. IBM Supply Chain
- Lin G., et al., (2000) maintain that simulation has helped IBM to accomplish faster responsiveness to customers while holding minimal inventory. This was achieved by developing an Asset Management Tool that integrated graphical process modeling, performance optimization and simulation to analyze their extended SCs quantitatively. Being the world largest company providing computer hardware and software worldwide, the company is linked with multiple suppliers which calls for multiple manufacturing and distribution sites and a single product line involves many bill of materials with differentiated lead times and costs.Due to the challenge of increasing competition and continued deflation of prices, the main objective of this tool was to design methods of stock reduction while meeting the requirements of customers within the integrated SC. This could be achieved by reducing uncertainty by making accurate forecasts and improving SC flexibility in adapting to changes at the market quickly. Blunt (2016) uphold that research and collaboration with suppliers is required for management of the extended SCs. Additionally, Thompson (2016) maintains that integrating business activities through the entire SC through information sharing with the suppliers would help solve problems associated with managing the extended SC and enhance better customer satisfaction. The input parameters for the simulation provided in this case were manufacturing lead times, transportation times, demand forecast, quantity of the products required in a bill of materials and reliability of suppliers. Moreover, a simulation run was carried out to identify scenario based analysis of build-to-plan, build-to-order, assemble-to-order, continuous and periodic replenishment policies. Khalili, Azgomi, & Bidgoly (2013) supports that a simulation engine is vital in providing users with opportunities to change the set input parameters while observing the output reports to get the optimum set of output values. IBM’s Personal System Group (PSG) is responsible for making and selling personal computers and they faced fierce competition from Dell and Gateway computers making them to copy the build-to-order policy practiced by these competitors. Applying simulation using the ATM tool resulted to a 50% reduction in inventory and led to more than USD100 million drop in look-back expenses which include payment to distributors and business partners due to the price actions given for the inventory they are holding. Remarkably, a 5-7% on production costs which equates to USD 650 million was saved annually by selling products 4-6 weeks nearer to the components procurement times. In the Printing section with annual approximate gross revenue of USD 1.95 billion, applying simulation using the AMT tool saved this section USD 1.6 million which represents 30% of the total cost of holding inventory.
3.4. UK Automotive Supply Chain
- Turner & Williams (2005) present a case study for the application of computer simulation in the automotive industry SC in the UK market from assembly plant ordering to finished vehicle stocking for the delivery to customers. According to Davies, Padgett, & Holweg (2015) UK is the second largest premium cars producer worldwide with more than 40 companies producing cars here. As a result of this rising in output and productivity, employment is rising and a forecast of over 2 million productions is expected in the coming years. Likewise SMMT (2016) enhance that this industry accounts for at least GBP 50 billion annual turnover. They add that car producers or Original Equipment Manufacturers (OEMs) focus on the SC stability and performance and coordination of Tier one, two and three suppliers to detect any signs of distress and mitigate the risks. Bommer & O'neil (2001) augments that SC collaboration leads to enhancement of revenues, costs reductions and higher flexibility of operations to cope with the benefits of high uncertainties of demand. Holweg & Frits (2004) however argue that this industry suffers from many challenges amongst them the complexity of the products due to variations in specifications and complexity of supply network caused by multiple stocking locations from the assembly plant. Hung, Samsatli, & Shah (2006) ascertain that due to advancements in computing technology, simulation has become a vital tool in analysing complex problems within the SCs and this has been supported by Wadhwa, Mishra, Chan, & Ducq (2010) in their research on SC coordination using simulation which revealed that cooperation and transparency of information were more beneficial when the SC was leaner. The key inputs of the model in the UK automobile SC case are data related to vehicle production, their distribution to dealers and the nature of customers demand. The dynamic performance of the SC is modelled as a series of events like customer’s arrivals to find out a vehicle which matches their individual requirements. Production, distribution and sale of 500,000 cars are simulated in each run which run for 5 years. The KPIs of the output include service and stock levels and customer satisfaction. To determine stock order specification, a Pareto rule is used by the manufacturers to ensure that those with a low expected demand are not made to stock. The model implements this by putting a minimum threshold of four vehicles a year. Cars are transported directly to the dealers or distribution centres after assembly by road but frequency, delivery times and batch sizes are varied to simulate transportation by rail or road.SEP (2013) expounds that computer simulation is vital in making predictions of what to expect under a set of circumstances that could be used as a base scenario. In this context, the base scenario is a UK car manufacturer with 100,000 cars per year of which 50% are exported. The model has 13 body combinations, 3 trim levels, 15 paint colours and 99 option packages to give 57,912 potential variants. A ‘build-to-forecast’ with long lead times production scheduling is used and all stock is held by the network of 370 dealers who use a stock locator system to locate stock held by different dealers. An alternative scenario is used that restrict stock at the dealers by holding most of it at a single distribution centre. After running the simulation, stock reduces from 53 days to 10 days. Centralisation benefit is also revealed with 20 days giving a better service level for the alternative scenario as compared to 53 days of the base scenario. Additionally, without the distribution centre, more than 60% of sales are from dealer stock but with the distribution centre this reduces to below 3%. This is important as it allows dealers to use information systems to source for customer orders directly from the production schedule leading to on time delivery which improves customer satisfaction.
4. A Critique on the Findings
- This report focuses on four SCs that have successfully implemented simulation to solve problems within their networks. This includes the LPG SC, Multisite Speciality Chemical SC, IBM SC, and UK automobile SC. The analysis of these case studies is provided in table 1 below.
|
5. Conclusions
- In conclusion, SCs are complex systems involving multiple entities covering the movement of goods and value addition activities from raw material phase to finished goods delivery phase. Many uncertainties like demand, production and delivery uncertainties exists along the chain triggering a prompt decision to be made on when and how much to replenish. A delay in time is observed when a lag exists between when a decision is enacted and once its effect is felt. Due to this complexity, robust technological tools are required to support these decisions and allow evaluation of their impact prior to their actual implementation. Simulation models can be used for this purpose as they provide flexibility in accommodating random stochastic elements. While simulation attempts to expound on the relationship between input and output parameters, they fail to provide optimum solutions for decision variables inherent in predefined objectives. Therefore, integrating optimisation models would offer best likely alternatives for decision makers.Succeeding with powerful technologies like simulation, managers should select the most suitable model that best symbolizes the system under study. Decision makers must enquire what questions they wish to address and the functions that the model will perform. System dynamics are better used when problems involve continuous processes requiring feedback to model behaviour change while discrete event systems are suitable for systems requiring detailed/empirical data for the linear processes. These models, if used appropriately, could aid decision making and improve performance within the Supply Chain.