-
Paper Information
- Paper Submission
-
Journal Information
- About This Journal
- Editorial Board
- Current Issue
- Archive
- Author Guidelines
- Contact Us
Journal of Logistics Management
2019; 8(1): 1-13
doi:10.5923/j.logistics.20190801.01

The Dangerous Boda Boda Transport Mode: Mitigating an Impending War on the Roads in a Transforming City? Case of Kampala City
 Abstract
 Reference
 Full-Text PDF
 Full-text HTML
Paul Wanume1, Alex Nduhura1, Benedict Mugerwa2, Henry Bagambe3, Jemimah Ninsiima4
1MCIPS, Uganda Management Institute, Uganda
2MCIM/Urban Management Specialist, Uganda Management Institute, Uganda
3Uganda Management Institute, Uganda
4FCCA, Uganda Management Institute, Uganda
Correspondence to: Alex Nduhura, MCIPS, Uganda Management Institute, Uganda.
| Email: |  |
Copyright © 2019 The Author(s). Published by Scientific & Academic Publishing.
This work is licensed under the Creative Commons Attribution International License (CC BY).
http://creativecommons.org/licenses/by/4.0/

This paper investigates the tyranny of motorbike (boda boda) socio economic costs associated with commercial motorbike accidents in a city setting and provides strategies to reduce the negative effect of such transport mode. Existing research has focused on social economic costs with vehicles automobile related accidents leaving silent but impactful broader indirect costs and strategies for managing boda boda in the city un debated and in limbo. The study borrows from the view that cities and their streets are for everyone. City dwellers no matter the economic and social status must have an opportunity to enjoy life in cities. Based on a cross-sectional survey and documents analysis, this paper concludes that the costs of boda boda accidents is alarming and may be silently impacting on economic growth and prosperity of city dwellers especially the bottom of the pyramid. The outcome of the study point to the need to continuously review such costs and institute mitigants to reduce boda boda fatalities and injuries through various interventions but more importantly underpins the need to establish the true delivered of boda boda accidents to their victims. The study findings are relevant since they provide an assessment of not only economic but social costs associated with motorbike accidents. The study provides strategies that are informed by empirical and secondary evidence in Uganda’s context and from international experiences. These are necessary for Uganda that seeks to create 9 cities and other countries are envision not at transforming their cities into smart cities but transiting existing municipal authorities into cities and gradually into smart cities.
Keywords: Socio-economic costs, Crash severity, Casualty severity, Motorbike (boda boda), Smart city
Cite this paper: Paul Wanume, Alex Nduhura, Benedict Mugerwa, Henry Bagambe, Jemimah Ninsiima, The Dangerous Boda Boda Transport Mode: Mitigating an Impending War on the Roads in a Transforming City? Case of Kampala City, Journal of Logistics Management, Vol. 8 No. 1, 2019, pp. 1-13. doi: 10.5923/j.logistics.20190801.01.
1. Introduction
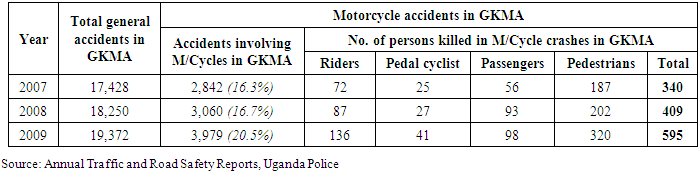
- Smart city status remains a pursued destiny for most governments across the world. Getting to such status is usually confronted from various dimensions; smart health, smart transport, smart education, smart agriculture, smart commerce, smart public service delivery, smart technology and so much more (Casado & Ureba, 2017; Ahmed, et al., 2017; Gharaibeh, et al., 2017; McClellan, et al., 2017; Walter, et al., 2017; Jukan, et al., 2017).It is argued that more than a half of the World’s population now lives in urban areas (Dirks, et al., 2010; Dirks, & Keeling, 2009; Dirks, et al., & Keeling, 2010). The fraction of national populations in cities is likely to continue increasing in the years to come (Kin, et al., 2017). Urban centres and cities come along with opportunities and challenges. While cities exist, governments world over are struggling with the challenge of transition cities into smart cities. Understanding this challenge requires deeper understanding of a smart city. World Bank (2000) forecasts that by 2025, two thirds of the world population will be living in urban areas (World Bank, 2000). Escalated urbanization changes are and will continue to occur in cities, the heart of developing nations in Africa. East Africa and Uganda are not an exception as they lie in this block. This growth comes along with increased mobility into and within cities that are in transition to becoming smart cities. Various modes of transport are adopted to improve mobility in cities. Air transport has been popular amongst nations with significant levels of urbanization such as in the Europe among countries such United Kingdom, USA, France, Canada, Germany and among the BRICS. In Africa, South Africa, Nigeria, Ghana and Kenya exists significant levels of air transport adoption in connecting cities. France, United Kingdom, United Arab Emirates and Nordic countries have promoted rail transport. In East Africa, developments such as the regional standard gauge railway manifests recognition of the value that rail transport in developing economies. Water transport has been popular in the global commercial world in transiting containerized cargo shipments and to a small extent promotion of tourism. In Africa and Asia, water transport has helped citizens connect to markets, health care facilities and schools where road infrastructure is either poor or lacking. On the other hand, in the greater parts of Asia and developing countries in Africa, motorized tricycles have been promoted. In India, Bangladesh, Thailand, Kenya, Burundi, and Pakistan motorized tricycles are popular in transiting dwellers in cities. While other modes such as cycling, pipeline have been to some extent limited, new modes of transport are increasingly becoming popular.In Uganda and within most parts of Kampala Metropolitan Area, conventional transport modes have been used since the colonial period. However, the introduction of two wheeled motorbike transport has over the last three decades become an increasingly popular mode of transport in the city.The mode has been popular due to flexibility and speed in a city popularized by traffic jams.Origin of Boda TransportThe origins of boda boda transport is traceable in the locus of commerce. This mode of transport was locally named “mwanyizabala” after traders in coffee that manifested a boom in sales around early and mid-1990s. After selling off their yield, traders went to procure motorbikes (boda boda) as a sign of achievement and for ease of transport of their coffee. Over the years, from movement of coffee the boda as commonly called has become a popular means of transport not only for cargo but also for passengers. On the other hand, another school of thought provides trace for the origin of the boda boda from tax evasion perspective. It is argued that bicycles over years had been used to transport illegal items across Uganda - Kenya boarder points especially. To evade tax with ease it is found that by shifting from use of bicycles to use of bodas, more cargo and speed advantages would occur to the tax evaders in the early 1990s. While these views provide varying motivations for the introduction of boda boda transport, they share in the purpose of the boda boda. Both views point to increased flexibility, speed and mobility as a key motivation for the introduction of such transport.On the large, this mode of transport has been grossly welcomed as it offers flexibility, jobs for unemployed youth, reduced time spent in traffic jam, connection to inaccessible areas marred by severe infrastructural deficiencies. Such benefits have been short lived as the boda boda mode has now become a tyrant in the city, a hiccup facing a city in transition to become a smart city. Boda Bodas (motorbike) riders have turned unruly as they do not respect traffic lights and rules, over speed, caused accidents that have resulted into deaths, permanent body injuries. They are alleged to be deeply involved in crimes such as theft and murders. By causing death, and permanent body injuries boda bodas could be contributing to increase of poverty and increasing unplanned settlements in the city, a backdrop to the journey of Kampala towards becoming a smart city.Giffinger, et al., (2007) define a smart city as;‘A city well performing in a forward-looking way in economy, people, governance, mobility, environment, and living, built on the smart combination of endowments and activities of self-decisive, independent and aware citizens.’While cities must be forward looking, and provide opportunity for everyone, constraints impede such assertions. One of such includes the constraints to mobility and constrained livelihoods due to traffic congestion, cost of living and unascertained costs transferred to city dwellers by other dwellers. In Uganda, Kampala like any other upcoming smart city faces similar challenges.Elsewhere including Uganda (Vision, 2040) governments are focusing on smart transport strategies that are aimed at transitioning the bulge of populations that are usually below the poverty line to middle income status. This has been done through initiating policies that have enabling development of tarmac coverage of roads (kms) and supporting the introduction of affordable transport modes such as cycling and motorbike (boda boda) options to for citizens that constitute the bottom of the pyramid. In Uganda, motorbike transport has been promoted since the early 1990s and continues to remain a key form of flexible and flexible transport mode in urban centres.Despite the benefits of boda boda transport, this mode of transport continues to be the most perceived as dangerous means of road transport in Uganda. Broadly, road transport has always been promoted a means of preferred choice in cities and urban centers, this means of transport remains traumatic. Peden, Scurfield, Sleet, Jyder, Jarawan, & Mathers, 2004; World Health Organization, 2004) predict that road traffic injuries (RTI) have been predicted to become the third leading cause of disability-adjusted-life years lost worldwide by 2020.It is further argued that rapid growth in motor vehicle numbers will result into an increase in RTI in low and middle income countries of the world (WHO, 2004). As numbers increase, enforcement of traffic safety regulations and public health infrastructure is inadequate in these countries (Nantulya & Reich, 2002; WHO, 2004; Ameratunga, Hyder & Norton, 2006).Although road traffic injuries affect all age groups, their impact is most striking among the young (Kobusingye, Guwatude, Owor & Lett, 2002). As such, the sudden termination of their lives would cause displacement of these families and their futures devastated, resulting into social welfare problems. Domestic production and the economy at large will be affected due to lost productivity. It is therefore, evident that reducing crashes on economic grounds alone can be justified, as there is a significant impact on the financial resources that the countries concerned can ill-afford to lose.Over the past two and half decades, Uganda Government has registered a remarkable growth in her economic development (World Bank, 2016). This has resulted into a change in the modes of transport. Among this changes has come Uganda’s popular ‘boda boda’ motorbike transport mode. Such changes have occurred majorly in Kampala, Uganda’s capital city. Uganda Bureau of Statistics reveals that 60% of Uganda’s GDP is produced in Kampala (UBOS, 2014). Based on this development, plans are underway to turn Kampala city into a smart city (KCCA, 2015). Plan, while creating other nine other cities and transforming Kampala city into a regional city. This will include; five regional cities; Gulu, Kampala, Mbale, Kampala, Mbarara, and Arua) and five strategic cities; Hoima, Nakasongola, Fort portal, Moroto, and Jinja, (Uganda Vision, 2040). Underlying these developments is the accommodation and expansion of transport modes aimed at increasing mobility and safety of road user in Kampala including transport investments of the bottom of the pyramid, boda boda cyclists.The ‘Boda Boda’ opportunity and ChallengeMotorcycles (boda bodas) have become an important novelty in mobility development that largely appears to benefit low-income users in Uganda and the Greater Kampala Metropolitan Area (GKMA) in particular. Accordingly, there has been unprecedented growth in the population of motorcycles within Kampala. Records by Kampala Capital City Authority reveal that in Kampala alone, indicate that 100,000 boda bodas operate in the city. Alongside this growth, the number of accidents involving motorcycles as a proportion of all the accidents in GKMA is increasing (Table 1).
|
|
|

2. Methodology
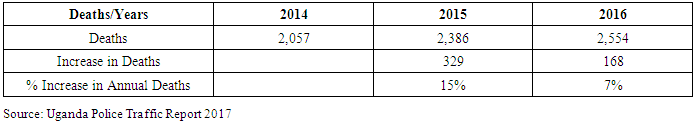
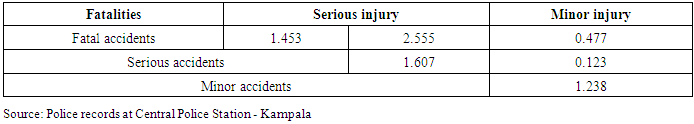
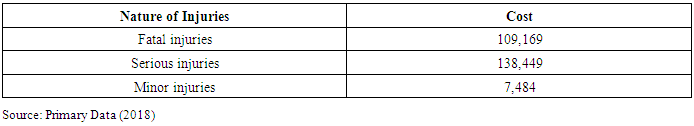
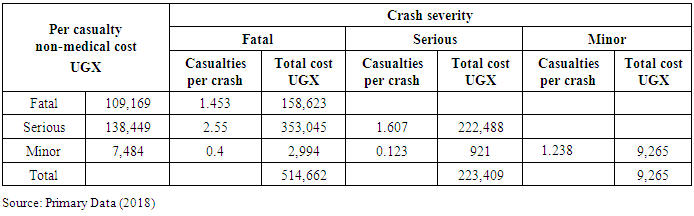
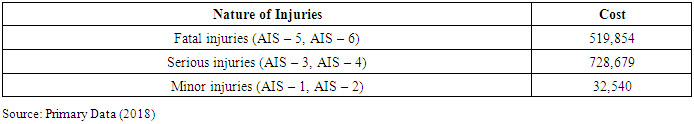
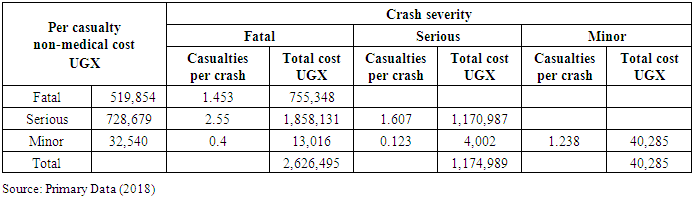
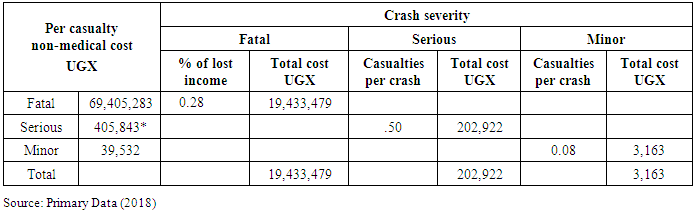
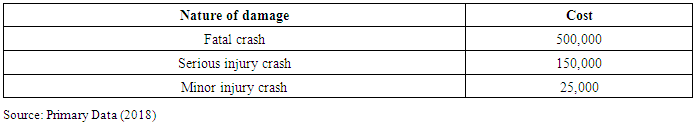
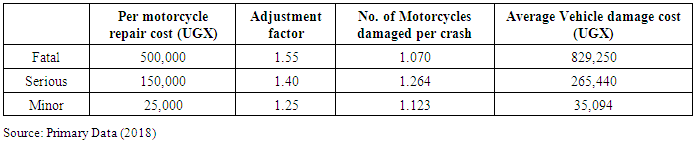
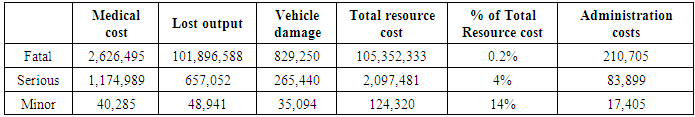
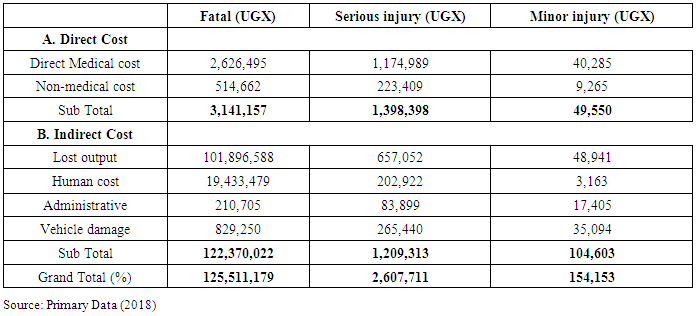
- This study was restricted to city and in particular Greater Kampala Metropolitan Area (GKMA), The GKMA is the largest single production centre of Uganda. It is the centre for industry, commerce and services, presenting high traffic congestion and serious road safety concerns. Nsambya one of the major hospitals that is registered as a private not for profit hospital – is selected as a case study. The hospital is selected for its good record of patient records compared to government hospitals that have been alleged to have fractured record systems. The hospital provides uniqueness as has rare features such as being a hospital where all services relating to medical and hospital care are purely borne by the patient. This was important in generating an approximate medical and hospital cost estimate due to motorcycle crashes. Besides, it is a tertiary referral hospital with a capacity of 361 beds. It is involved in patient care, research and teaching and offers specialist services in Surgery, Internal Medicine, Pediatrics and Obstetrics and Gynecology.In this study, the population consisted of all the motorcycle crash victims (both outpatient and inpatient) that reported to Nsambya hospital during the period June to September, 2011. The victim was deemed to have been involved in a motorcycle crash if he/she was a pillion passenger, a rider or was hit by a motorcycle (as a pedestrian, pedal cyclist or car occupant). A total of 237 RTA victims reported at Nsambya Hospital during the study period. 79% (187 cases) of these cases were due to RTA involving a motorcycle (boda boda). Determination of a representative sample size was based on the average monthly motorcycle crash patients that had attended the emergency unit at the hospital in the previous 5 months prior to the study. A sample size of 113 cases out of a target population of 207 patients was selected. A hospital survey was conducted in order to investigate the socio-economic costs of motorcycle crashes with motorcycle accident victims and was preferred based on the fact that it permits a concentration of accident victims, thereby allowing low-cost data capture.The study was guided by the following objectives; SO1: To identify the costs associated with motorcycle (boda boda) road crashes and casualties and S02: To explore strategies that should be implemented to reduce costs associated with motorcycle (boda boda) road crashes and casualties.Crash and casualty severityAll motorcycle crash data recorded by the police in Kampala Metropolitan district for the period 2007-2009 and 2014 to 2016 was reviewed to document the total number of motorcycles involved in each category of crash severity (fatal, serious and minor injury). The period 2010 to 2013 due to lack of data. In this study, crash severity was determined by dividing the number of motorcycles involved in RTAs by the number of motorcycle crashes by severity. Over the six months, police records indicated that there were 2,913 casualties of which 6.4% (186) were fatalities while 55.6% (1,621) were seriously injured. Besides, 38% (1,106) received minor injuries. Casualty severity was determined by dividing the total of number of casualties as a result of motorcycle crashes by the total number of crashes by severity.Socioeconomic CostsA hospital survey was conducted in order to investigate the socio-economic costs of motorcycle crashes with motorcycle accident victims. Estimation of the costs due to motorcycle/boda boda crashes was based on the Human Capital Method/Gross output (Babtie Ross & Silcock, 2003 & Transport Research Laboratory [TRL], 2003). This study focused on the economic costs of motorcycle road crashes as well as an estimate of the sum that reflects the pain, grief and suffering incurred by the victims and their families from a societal outlook. This approach is recommended by Kumaranayake, Pepperall, Goodman, Mills, & Walker (2000). The assumption was that the value to society of avoiding a death or injury is related to the potentially high in terms of economic output and resources.The cost of road traffic injuries is composed of two major parts: direct and indirect costs (Kobelt, 2002). In this study, direct costs were categorized into medical and non-medical costs while indirect costs were categorized as lost output due to absence from work as a result of injury or disability and lost output due to premature death, human costs, administrative costs as well as costs due to vehicle damage.Direct costsMedical and non-medical costsIn this study, hospital/medical costs referred only to health-care-related costs directly spent for impediment, detection, and treatment of the patient. A hospital survey was carried out in which patients or their caregivers were interviewed to make a self-report about the hospital and medical cost. This information was verified in the Accounts section by extracting the corresponding patients’ total hospital and medical bill based on the level of injury severity – Abbreviated Injury Scale (AIS). The non-medical costs constituted the sum of food costs, travel costs, and nursing care costs. In order to capture resource use (non-medical costs) that was likely to vary from patient to patient and that seemed difficult to extract from existing data sources, only self-report measures were done for both the patient as well as caregivers.Indirect costsLost outputThe lost output of the injured person or caregiver referred to the present value of lost wages of the victim or caregiver over the period of illness and was computed by multiplying the number of lost working days for those with serious, minor injuries or caregiver, with their average daily wage. The average daily wage was used because most of the patients were unskilled workers and there were no statistics on the average income of road fatalities in Uganda. Use of the average daily wage has been applied in other studies related to the cost of road traffic accidents (Pornlertwadee, 2002, Riewpaiboon, Piyauthakit & Chaikledkaew, 2008). The lost output in case of death referred to the present value of lost wages of the victim from the time of death to retirement (60 years in Uganda). Using a discount rate of 14% (BOU, 2011), the lost labor output of fatalities was computed using the cumulative present values of the assumed wages of the deducted lost economic years of the fatalities until the age of 60 years. This study did not record any permanent disabilities.Human costsPain, grief and suffering were derived as a percentage of lost output cost. In TRL (1995), it is suggested that the following values are used: 28% of total lost income for fatal accident; 50% of total lost income for serious injury accident and 8% of total lost income for minor injury accident.Administrative costsThis study adopted the TRL (1995) recommendation for costing administration activities in a crash for developing countries as:Total resource cost = (lost output + medical cost + vehicle damage)Fatal Accident - 0.2% of total resource costSerious Injury Accident - 4.0% of total resource costMinor Injury Accident - 14 % of total resource costPDO Accident - 10 % of total resource costVehicle damageThe costs associated with vehicle damage were calculated as the average cost of motorcycle repairs multiplied by the average number of vehicles involved/damaged in crashes by severity. While vehicle damage is usually extended to damage to include external objects like traffic signals, lamp posts, and buildings, in this study the definition is constrained by limits of data on constructs of the extended definition of vehicle damage.
3. Findings
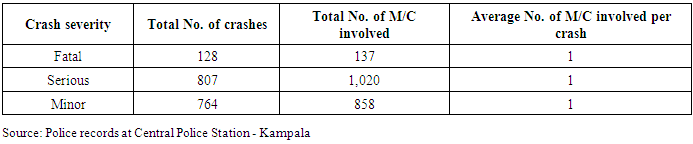
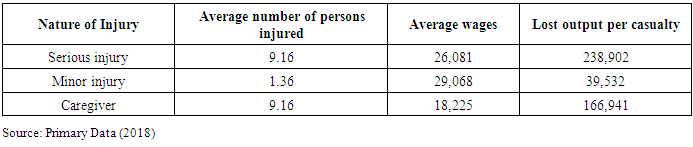
- AgeThe average age of fatalities was 30.17 years. The fatalities died within a period of 30 days from the date of the accident. The average age of the victims with minor or serious injuries was 31.37 years. There is a substantial over-representation (75.9%, n = 108) of the economically active age range of 20 - 49 years. The majority of the victims (37.9%) were in the 20 – 29 age range. The over-representation of the economically active and productive age group provides the need for local authorities such as Kampala Capital City Authority to pay particular attention to them.IncomeThe majority of the victims (36.1%) earned between UGX 20,000 and UGX 30,000 per day. There was underrepresentation of victims earning above UGX 50,000 daily (only 2.8%). The average daily income of motorcycle road crash victims with serious and minor injuries was UGX 26,081 (about $9.3) and UGX 29,068 (about $10.4) respectively. The average daily income of fatalities was UGX 27,500 (about $9.8). This income level is above Uganda’s national average income per capita of $400 (about UGX 3,075 daily). This study was carried out in Kampala, the largest single production centre in Uganda and therefore such incomes would be expected. It is also probable that poorer crash victims may fail to afford and report to this hospital where there are no subsidies as is the case in a Government hospital such as Mulago. With such income level, absence from work and or the family can have far-reaching effects, well beyond the immediate costs of the treatment which may be needed and other monetary costs of the accident.Crash SeverityBasing on the number of motorcycles involved in RTAs and number of crashes involving motorcycles, the average number of motorcycles involved in each crash (crash severity) was determined (Table 4).
|
|
|
|
|
|
|
|
|
|
|
|
|
4. Discussion of Findings
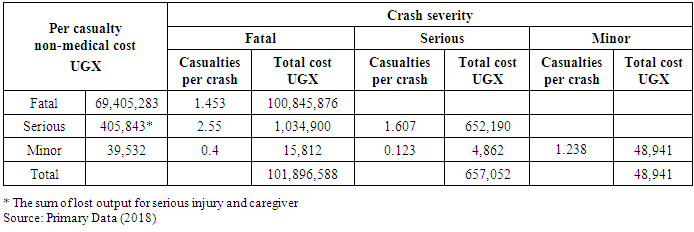
- This study reveals that in a fatal motorcycle crash, 81.2% (UGX 101,896,588) of the cost estimate are due to indirect costs as a result of loss of income due to fatalities. Earlier studies by De Leon et al (2005) had discovered that 73% of the costs in fatal crashes are due to lost income as a result of fatalities and permanent disabilities. The higher percentage in this study can be explained by the fact that there were no permanent disabilities. However, the result that the indirect costs were higher than the direct costs is consistent with that of other illnesses (Al-Masaeid, Al-Mashakbeh and Qudah, 1999; Garcia-Altes and Perez, 2007; Miller and Blewden, 2001; Pitagpravej, 1997; Riewpaiboon et al, 2008; Sumiratana, 1998; Suwanrada, 2005). It can be further explained that the higher percentage of indirect costs is attributed to a higher proportion of young and energetic people involved in motorcycle accidents. As a result longer periods of productivity are lost, which negatively impacts on their dependents and the economy as a whole.In this study, the highest proportion of the total cost estimate for serious injury crashes are direct medical costs, comprising 45.1% of the total cost estimate for serious injury crashes. Similar studies have also determined a higher cost estimate for direct medical cost of serious injuries (De Leon, Cal, and Sigua 2005; Riewpaiboon et al, 2008). This high proportion can be explained by the fact that there were no permanently disabled persons due to motorcycle crashes in this study, hence the small proportion of indirect costs. The majority of the patients (61.5%) were out-patients with minor injuries. It is worth noting that Nsambya Hospital is purely private with no subsidies for patients and it is a lower referral hospital, compared to Mulago hospital, a Government facility also found in the study area. It is therefore highly probable that the medical cost of injuries is even higher than what is presented in this study, premised on the possibility that more severely injured victims could have opted for Mulago Hospital, a national referral hospital which can manage more complex cases. Besides, this study did not make any follow-up with patients to determine further costs on rehabilitation and recovery. It is likely the medical cost could be much higher (Maraste, Persson & Berntman, 2003).Conversely, it can be seen that the cost due to lost output again constitutes the highest proportion (31.7%) of the cost acquired from minor injury crashes. This is closely followed by medical cost (26.1%). This high proportion can be explained by the fact that there is a higher proportion of patients earning a daily wage that could be lost due to the morbidity absence period.Whereas the proportion of administrative cost is low compared to the other cost components, its significance clearly indicates the resources that police and other agencies would require to perform their duties properly. It is expected that incorrect statistics or under-reporting would result in absence of these resources which impacts policy and strategy formulation on road safety.
5. Conclusions
- This study has demonstrated the need to reduce motorcycle crashes in order to lessen the associated socio-economic costs. The number of motorcycle crashes and motorcycles involved in these crashes is reasonably high even with cases of non-reporting, mis-recording and under-recording. This is a pointer to concerned local authorities to design further efforts to reduce crash risk through enhanced planning of the area and the provision of good transport infrastructure and facilities. Reduction of the crash rates will lead to improved quality of life for the susceptible road users and unlimited benefits to the people in the GKMA.The findings of this study further indicate that majority of the victims (75.9%) were in the age range of 20-49, representing an economically productive age group. This situation provides the need for local authorities such as KCCA to pay particular attention to them and the efforts in terms of policy and planning should be directed at such cases, in order to curb the casualty rates that could result into significant individual, family and societal costs.As Uganda seeks to establish 9 more cities by 2040 (Uganda Vision, 2040) and transform the current city into a regional city. In pursuit of this great dream, major constraints exist-the boda boda challenge and the inevitable costs of its existence to the city and urban dweller. The most affected have been the poor people that this study conceptualizes as the bottom of the pyramid. Making cities a place for everyone, will require several initiatives.Addressing this challenge is critical for improving wellbeing of the current city dweller in and dwellers in other cities to come. It is important that this challenge be sorted before rolling out of other cities as it is envisaged in Uganda Vision 2040. This view is informed by this study. The study has demonstrated the importance of estimating crash costs particularly in a densely populated area like GKMA. The findings of this study led the researchers to conclude that accidents involving motorcycles are a major cause of fatality and injury and result in significant social and economic costs in GKMA. These costs and inconveniences to dwellers in Kampala city is unaffordable and expensive for dwellers top settle in especially those below poverty line (pedestrians and riders) that we conceptualize as the bottom of the pyramid. The high costs and inconvenience created by diversity of mobility option with the introduction of boda transport appear unsustainable for city dwellers and more so at a time when Uganda is preparing to create more cities.Implications for Smart City Policy MakersAddressing the boda challenge requires well thought strategy in the journey to create smart cities and transit municipalities into cities as well. While the costs have been established, there is need for strategy to manage the boda boda challenge into to develop cities that are for everyone. This is in line with views by other scholars on smart cities“cities are people’s future, places where tomorrow’s civilizations are built.”Erik OrsennaCritical strategies that need to be implemented include; Effective implementation of road safety strategies are essential in reducing crash and casualty severity and this can result in significant reduction in the associated socio-economic burden.There is need to design roads with specific lanes for boda boda riders. This will help to reduce unnecessary traffic caused by congestion exposing pedestrians and passengers on bikes to accidents (Patrick, 1993).There is need to establish sidewalks for pedestrians and specific cycling specific lanes for boda boda riders. In addition, restricted exclusive lanes in cities for buses and small utility vehicles (SUVs) taxis should be incorporated in design of roads in cities and urban centres. This is part of require improving design of the urban environment. It is argued that the Dutch and Scandinavians have created urban environments with cycle ways, play spaces, shops, and green belts with ease of access to residential areas (Patrick, 1993; Mohan, 1989). Mohan (1989) argues that China provides good example of traffic separation where it is argued that almost half of the road surface in cities is reserved for cyclists and pedestrians (Mohan, 1989).In Marseille, France similar urban design has been implemented. Such reduces exposure to fatalities and accidents.Gradual phasing out of sole passenger bikes and encouraging the adoption of commercial smart bike sharing models (Midgley, 2009). This is in line with evidence of successful similar model adoption in UK, India, USA (DeMaio, 2003; DeMaio, 2004). It is argued that bike sharing helps to reduce accidents as commercial boda boda riders are likely to ride within appropriate speed limits as they are guaranteed extended revenue per ride when smart bike sharing models are adopted. Benchmarking visits should be explored by urban authority officials to countries like UK, USA, India and others.Establish licensing rider training schools for motorbike riders with and established national curriculum for motorbike training. This is likely to increase rider awareness of road signs and respect of traffic rules. This practice has been implemented in Rwanda, making the boda boda riders more sensitive to road safety signs, compliance with wearing of helmet by the boda boda riders and passengers. Such initiative will not only reduce not only the chances of injury and fatalities on riders but also passengers and pedestrians when drivers comply with road safety requirements.In Uganda, safe boda initiative through a smart phone app has been launched. Like UBER, the app allows motorbike passengers to book online their travel over motorbikes. The initiative has involved training of participating boda boda riders on road, passenger safety, customer care and the broader Traffic and Road Safety Act of Uganda and defensive driving.Promote entrepreneurial, progressive and intelligent in urban setups. Government and local authorities need to partner and promote innovative road safety initiatives by motorists, and support firms such entrepreneurial models possess significant growth potential such as Safe Boda. For instance Safe Boda partners with the Ministry of Health to give all our drivers first responder training to enable them extend help to the community around them. Under such initiative riders are trained in customer service so that our customers always have an amazing experience. Riders are also given basic training on how to maintain their bikes in good condition to ensure safety on the road. Such initiatives should be supported by government of Uganda and replicated through attracting potential investors in such an industry by local authorities at Municipality, City and urban Centre governance levels.To reduce the boda boda challenge requires that city authorities explore other alternative to motorbike transport. And integrated system with trains, trolleys and buses. However, standard of service should be reliable and costs should be affordable to city dwellers. This view is supported by Lowe (1990) who argues that these have constituted smart transport alternative in cities such as Paris, Toronto and others. This will reduce pedestrians’ exposure to unsafe boda boda.There is need to return streets to the people by building diversity into road design and use. Zoning off some parts of the city to motorists can help reduce exposure to accidents by motorists. Such initiatives have been implemented in City of Kigali, Rwanda. Beyond reducing exposure to accidents by boda boda travel, such initiative promote wellbeing of city dwellers as walking to and from work within zoned off areas provides some physical exercise opportunity that would have otherwise been missed. This view is supported by Tiwari (2002), Thynell et al. (2010) and Jain & Moraglio (2014) that suggest that to reduce the war on roads, there is need to have urban streets returned to the people, pedestrians.Charging riders who breach traffic rules with instant fines may help to solve the boda boda challenge. This requires that all motorbikes are registered and that rider’s identities are linked with the bikes ridden. Global position systems (GPS) are also necessary to track fined riders to ensure that they pay fines in times. Surcharges should be encouraged where riders delay to pay express fines. This will, make drivers cautious of other road users’ safety when riding. This practice has been implemented in Uganda for automobile drivers and some progress is being made reducing accidents and associated fatalitiesThe challenge of boda bodas is a political one (Jain, & Moraglio, 2014; Avery & Avery, 2002). Policy makers must understand the stakeholder interests and explore options for dealing with lost revenues by boda boda owners, riders and pedestrians that consider such mode of transport as a flexible and affordable option. This will be necessary for implementing the above cited strategies that are aimed at creating equilibrium with tradeoffs, necessary for making cities a place for everyone and civility (Avery et al., 2002).Promotion of commercial storeyed parking buildings in the city and urban areas. Deliberate efforts by city planning authority should be considered in promoting such initiative. Building plans in the city should have 50% of pace for parking space to accommodate parking of cars. Only such building should be approved for construction in Kampala for years to come. This will help to reduce congestion on streets, which is considered one of the major causes of accidents by boda boda and motorists in the city. The city authorities should further promote stored commercial building through offering discounted price on building plans for storeyed parking, offer blanket advertising on TV, billboard and social media advertising.Governments through their agents such Ministry of Transport and Works, Transport authorities in should promote less driving and riding in cities. Avery et al., (2002). Mohan (1989) argue that that when more and more people drive and ride, pollution and accidents combined kill more people. To reduce the number of people driving and riding, there is need to explore the opportunity of promoting combined transport such as light trains, licensing of scheduled bus companies to move in people and around town.The FutureMost cities including Kampala are a result of poor planning. Causing major changes may appear to be costly, troublesome and is faced with high vulnerabilities to change resistance among city dwellers. Despite this hereditary challenge, using more of the air space rather than ground surface is recommended in such context.However, opportunity for implementing thoughts lies in the journey of developing five regional cities and 5 strategic cities in Uganda as per the promise of Uganda Vision 2040. Elsewhere, this should form part of the current and future planning efforts. Failure to implement such initiatives is unforgiveable by generations to come.