-
Paper Information
- Paper Submission
-
Journal Information
- About This Journal
- Editorial Board
- Current Issue
- Archive
- Author Guidelines
- Contact Us
Journal of Logistics Management
2017; 6(1): 11-25
doi:10.5923/j.logistics.20170601.02

Impact of Service Operation Strategies on the Supply Chain Performance of Private Automobile Companies in Ghana
 Abstract
 Reference
 Full-Text PDF
 Full-text HTML
Ephraim Kwaku Akafia, Abdul Samed Muntaka, Seth Boahen
Department of Information Systems and Decision Sciences, KNUST, Kumasi, Ghana
Correspondence to: Abdul Samed Muntaka, Seth Boahen, Department of Information Systems and Decision Sciences, KNUST, Kumasi, Ghana.
| Email: |  |
Copyright © 2017 Scientific & Academic Publishing. All Rights Reserved.
This work is licensed under the Creative Commons Attribution International License (CC BY).
http://creativecommons.org/licenses/by/4.0/

At Toyota Ghana Company Limited, the core mandate is the sale of brand new vehicles from Toyota Motor Corporation (Japan), spare parts as well as servicing. To expand its assess network, TGCL introduced a new service strategy authorising private garages known as Toyota Ghana Authorized Service Shops (TGASS) to offer accessibility to clients outside of the four catchment areas of the company. In that vein, the current study sought to assess the impact of the new service strategy on the performance of the supply chain of TGCL. The study employed the mixed method approach in conducting the study using a total of 90 participants (15 managerial staff and 75 clients) selected through the purposive and convenient sampling techniques. Data was collected using questionnaires and unstructured interviews. The results show that respondents perceived TGCL’s supply chain performance improved significantly after the introduction of the TGASS service strategy. The study, therefore, concluded that introducing alternative service strategies has a significant effect on the service output of the supply chain of private organisations.
Keywords: Service Operations Strategy, Service Strategy, Supply Chain Performance
Cite this paper: Ephraim Kwaku Akafia, Abdul Samed Muntaka, Seth Boahen, Impact of Service Operation Strategies on the Supply Chain Performance of Private Automobile Companies in Ghana, Journal of Logistics Management, Vol. 6 No. 1, 2017, pp. 11-25. doi: 10.5923/j.logistics.20170601.02.
Article Outline
1. Introduction
- In the light of the volatile economic conditions and heightening global competition, many businesses in the automobile industry have learnt to develop and implement new strategies and management systems to help them keep abreast with the business environment. Strategic and operational planning have today become a necessity, and these needs to be regularly reviewed and updated, so they are relevant to current issues (Pinheiro de Lima et al., 2010).In the view of Li and Tang (2009), the multi-faceted elements of the performance of businesses have become an active challenger to how management systems are developed and operated. The various characteristics of management system models are illustrated by how dynamic factors, both internal and external, define how to strategically manage operation systems; how strategic planning of operations systems need to relate and integrate both short term and long term objectives; and how crucial it is to utilise both resource and competency-based models for operations strategy development and design (Chiesa et al., 2008).The assertion of Gomes et al. (2004) is that when redesigning a strategic management system, there is the need to ensure that certain characteristics which reflect specific performance measurement systems are put into place such that the system has balance, integration, linkage and flexibility whiles ensuring that the system is multifaceted and multidimensional. Such characteristics have not been utilised widely for understanding the environment within which operations systems are used. This is because they are undeveloped and not well integrated into the management process to ensure that the level of performance of the firm is enhanced (Taticchi & Balachandran, 2008). Performance can be improved when the measurement subsystems that are integrated into the strategic management systems have the capability to provide performance management at a strategic level and not just deploying the systems for performance measurement. Also, there is the need to develop strategic management systems which would keep changing as the environment changes and not remain static. Then also, there should be flexible performance measurement systems that are able to deal with changes in the organisational environment (Neely, 2005). As such, the performance of these institutions implementing the operational strategy could be felt in their supply chain effectiveness (Beck & Hofmann, 2012). An effective and efficient supply chain management (SCM) is vital when addressing the ever-changing nature of clients’ expectations. Competition in today’s business environment is about entire supply chains rather than just individual firms (Li, 2012). In effect, since SCM has assumed a strategic position within management research and practice from its previous operational level, SCM research has shifted focus from efficiency to effectiveness and is now oriented towards the needs of clients (Godsell, 2011). Recent marketing strategies of manufacturers like Toyota is to provide client services as a means of boosting their turnover because it can be seen that when businesses offer both products and services rather than just products only, value is added through the diversity of their functions to the client (Gupta et al., 2008). Managerial challenges have, however, been encountered by businesses in the process of transforming from the product offering to product-service offering (Baines et al., 2007). Businesses like Toyota offer sales of vehicles, spare parts, and servicing of vehicles. The authorised distributors of Toyota Motor Corporation (TMC) in Ghana, Toyota Ghana Company Limited, require reconfiguration of operational strategy to support their product offering. The company sell Toyota products and offer after sales services which include sales of spare parts, service and maintenance of Toyota vehicles. In a bid to expand its assess network and enhance its supply chain, it decided to get services closer to their clients by authorizing private garages known as Toyota Ghana Authorized Service Shop (TGASS) to offer 2S facility services (service vehicles and sale of spares) in all major cities in Ghana to make TGCL products and services accessible and be responsive to their clients. The focus of this study was to assess the impact of the TGASS service operation strategy on the performance of the supply chain of Toyota Ghana Company Limited.
2. Literature Review
2.1. The Resource-Based View Theory
- The development of effective strategies by organisations has seen many contributions from various concepts and models. There are those models which propose that competitive advantage can be achieved through integrating the organisational capabilities with its resources (Grant, 1991). Others like Porter (1980) see that there is the need for a fit between the internal competencies and resources of an organisation with its external opportunities and threats.In recent times operations strategy, which deals with how effectively the capabilities of a firm is utilised to achieve organisational objectives, is shifting from market-based to resource-based. A market-based operational strategy focuses on the dictates of the market. Whereas the resource-based view concentrates on developing, protecting and leveraging the operational resources of the business to achieve an edge in market competition and become more profitable.The resource-based view provides a succinct insight into a firm’s resource capabilities. New studies of the RBV have centred on the advantages that can be derived from resources that are within a network. The assumption is that the emphasis on inter-firm relationships necessitates the extension of the RBV beyond just a firm to developing highly efficient networks, such as supply chain networks of which Toyota is a part (Slack & Lewis, 2009). In their view, management of firms must be familiar with operations strategy decisions which should consider issues such as supply chain, capacity, process technology, including procurement and logistics, and organisation development (Slack & Lewis, 2009). Thus, operations strategy should be more action oriented than just decision making (Kim & Frohlich, 1994).
2.2. Service Operations Strategy
- Operations management is concerned about how effective and efficient a firm’s operations become. Per Johnston (1994) service operations management has to do with designing and operating systems that are directed towards the provision of services. Service, as defined by Gronroos (2000) is “the processes consisting of a series of activities where a number of different types of resources are used in direct interaction with a client so that a solution is found to a client’s problem.” It has been established that the way in which strategic decisions are made in a firm determines the description that is given to the process utilised in operations strategy (Ho, 1996). Strategy has been construed as that which enhances the competitive advantage of businesses in a given market based on the firm’s resources (Swink & Way, 1995). In the manufacturing sector, differences exist in how performance criteria are perceived as various researchers pay attention to the set of decision areas that are used in attaining the objectives of manufacturing (Skinner, 1969; Leong et al., 1990). Thus, various researchers have identified and developed diverse sets of decision areas for firms engaged in manufacturing (Mills et al., 1998).In the service industry, traditional operations management literature considers how to match the expectations of clients to their perceptions by developing systems for service delivery (Armistead, 1992). Various authors have proposed different models to provide insight into service operations systems by using various classes of services (Johnston, 1994; Sampson, 1996). The framework for operations strategies offered by Arias-Aranda (2002) consists of three basic strategies: process, service and client-focused operations strategies (Bowen & Youngdahl, 1998). A service operations strategy depends on certain decisions that must be taken in terms of the business structure and infrastructure. Nine such issues have been identified by Arias-Aranda (2002) and these are: number of different services offered, degree of process standardisation, push/pull orientation of the service delivery process, human resources specialisation, use of information technologies, back and front office activities relationship, type of operations layout, degree of client participation, and new service design and development.
2.3. Strategy Implementation
- Effective implementation of strategy has been systematised with a laid-out process as proposed through models developed by different authors. The clear communication of strategy has been pointed out as the first step in strategy implementation. After which is the designing of the fundamental organisational structures necessary to carry out the strategy. The third element is for management to establish operational objectives together with designing the operational structures. The final element considered is establishing adequate control systems and motivational environment that will foster the process of strategy implementation (Hrebiniak & Joyce, 1984). In order to successfully implement a strategy based on the above process, there is the need for management to keep the loop of planning and designing structures. The approach can be both top-down or bottom-up. The model of Hrebiniak and Joyce (1984) was modified by Higgins (2005) who used “8S” instead of “7S” as originally proposed. The revised model, therefore, consisted Strategy, Leadership Style, Shared Values, Systems and Processes, Structure, Staff, Resources, and Strategic performance. These are intended to facilitate and improve the process of strategy implementation.
2.3.1. Challenges to Strategy Implementation
- Several factors exist within the environment of a business that impacts on how successful strategies are implemented. The organisational culture context, the leadership context, the change management context, and the organisational power structure context were the four factors which have been identified in this regard (Hrebiniak, 2005b). These factors are interrelated, and their synchronisation is important for a firm to implement its strategy effectively. In his view, Hrebiniak (2008) noted that change management is not only a critical organisational adaptation skill but also a necessity for strategy implementation. As such, change management has been singled out as a major potential hindrance to successful strategy implementation (Hrebiniak, 2005b), specifically the attitude of resisting change. Another factor that has been identified is the lack of trust in an organisational culture and has been ranked as a major obstacle to strategy implementation. Organisational culture is described as those norms, attitudes, and shared values which guide behaviour and engender an environment in an organisation that predisposes individuals to act in a particular way (Hrebiniak, 2005b). Where trust is lacking in an organisational culture, uncoordinated and inadequate information is distributed in the organisation, especially those units which can affect or be affected by the overall strategy execution. Additionally, the lack of trust, short-term orientation at the expense of long-term organisational orientation is another destructive cultural issue impeding strategy implementation. It is the view of researchers that where an organisation is distracted by its short-term objectives, it creates a blockade for the effective implementation of strategies (Alexander, 1985; Al-Ghamdi, 1998). Another contextual element that affects strategy implementation is the power structure existent in a firm. The nature of the power structure determines the resource allocation decision-making process where strategies need to be implemented. A crucial thing for implementation is creating the motivation necessary for key employees involved in the process to carry out all tasks and responsibilities stipulated for implementing the strategy through the guidance, support and participative approach to top management (Brenes et al., 2008). The fourth enumerated challenge is concerned with the context of organisational leadership. Relevant and proper leadership skills are necessary for encouraging the positive attitude of workers during the implementation of strategies. The studies of Al-Ghamdi (1998) pointed out that about 75% of companies lack the effective coordination of implementation activities. The way out of this challenge is for leaders to use “strategic maps” which are designed to link a specific strategy to the plan for executing it so that organisational efforts of implementation are successful (Kaplan and Norton, 2006). One crucial aspect of leadership is the ability to “sell” its strategy to all employees, and this requires the need for adequate communication of the strategy to them (Hrebiniak, 2005). As opined by some researchers, the majority of employees do not know or even understand the organisational strategy, as high as 95% in some cases (Kaplan and Norton, 2005). Where employees have no knowledge about the strategy of the organisation, it is practically impossible for them to contribute to its implementation. Another dimension of the leadership context is the level of compensation given to employees. The motivation of employees to work and execute organisational strategy depends on their level of compensation (Terborg & Ungson, 1985). Thus, leadership must ensure there is adequate and equitable compensation of all employees.
2.4. Service Strategies in Manufacturing Firms
- Studies have identified five service strategies that organisations can deploy, and these are client services, client support service provider, after-sales service provider, outsourcing partner and development partner (Gebauer, 2008; Gebauer et al., 2010). Some of the strategies are transaction based, whereas others connote a relationship-based business philosophy, which implies that the success of each service strategy is dependent on different resources. Another way of considering various service strategies is to consider how the strategy of the organisation fit its environment. Strategy-environment-fit suggests that both internal and external factors such as price elasticity of demand, clients’ strategic choice, competitive rivalry and market growth affect service strategy (Gebauer, 2008). Other researchers have also discussed clients’ strategic choices as it relates to service strategies in the manufacturing industry. Client demands for services have become rampant and have provided an opportunity for competitive advantage if firms can provide, in addition to product offering, services that are client oriented in terms of process oriented consultancy services (Gebauer et al., 2004). The main concerns regarding manufacturing firms are to view service strategy from the view point of clients, and this will help them deliver value addition throughout the value chain of the product’s life cycle (Wise & Baumgartner, 1999). As a consequence, knowledge and skills related to services have become even more critical resources.Building on Oliva and Kallenberg’s (2003) concept of the transition process from the product manufacturer to the service provider, Penttinen and Palmer (2007) identified four strategic positions that a manufacturing company could hold, depending on the completeness of their offering and the nature of the buyer-seller relationship. They distinguished between more and less complete offerings, and between transactional and relational relationships with clients.
2.5. Dimensions of Business Operations Strategy
- Studies have grouped operation strategies based on four main priorities, namely: delivery priorities, quality, cost and flexibility. However, this study focuses on the delivery priority.
2.5.1. Delivery Priority and Strategy Type
- Delivery priority considers both dimensions of fast delivery and timely delivery (being able to deliver per a stipulated schedule). This operational strategy achieves reliable service delivery even if the promised delivery date is far in the future, though it may not achieve the least cost or the best quality. Companies focus on improving their technology and consolidating familiar market segments that demand products on a continuous and high volume basis. This dimension of delivery priority contributes to helping an organisation improve upon how efficient they utilise their technology and aid in providing a stably satisfied consumer base by either delivery reliability or delivery speed (Ward & Duray, 2000). The focus of delivery priority leads some firms like Toyota to engage in vertical integration. One crucial operational decision is vertical integration within the value chain which handles issues about ownership rate and how ownership is directed either towards suppliers or consumers (Beckman & Rosenfiled, 2008).
2.5.2. Vertical Integration and Performance
- The measurement of performance in supply chain management literature considers both the operational and financial aspects of performance. This notion is upheld by both concepts and practices that pervade this field which demonstrates that value can be tied to both positive and negative outcomes (Sengupta et al., 2006). Various researchers have been able to identify that cost reduction is the major issue that organisations seek to achieve in improving their performance when they engage in vertical integration (Bengtsson & Dabhilkar, 2009; Wallenburg et al., 2010). As pointed by Mohr et al. (2011) as much as 66% of managers only pay attention to how they can reduce cost through vertical integration and some of the costs which they seek to reduce include finance costs, fixed overheads, production-related costs and capital investment costs. Mohr et al. (2011) indicated that vertical integration had been used as a vehicle to enhance the quality of products. The assertion is that quality improvement is a better measure of improved performance which is aligned to the organisation’s core competencies (Bengtsson & Dabhilkar, 2009; Wallenburg et al., 2010). Nevertheless, Broedner et al., (2009) posited that as low as 12% of integrations undertaken in the supply chain of businesses are achieving intended results as understood from clients’ view point. Gottfredson et al. (2005) also noted that about half of integration activities fall below expectation and about 10% achieved the cost reduction strategy intended. The relationship between integration and performance have mixed results from research. Likewise, Bustinza et al. (2010) found no direct relationship between the two constructs except that organisational capabilities necessary for its competition are affected through this process. Other studies identified that the relationship between integration and performance has both optimal and very low positions, indicating a U-shape (Kotabe & Mol, 2009; Kotabe et al., 2012). Hence, there is no established and clear-cut relationship between performance, integration and implementation.
2.6. Supply Chain Strategy, Flexibility and Performance
- Supply chain performance can be improved based on strategy and flexibility of an operational system (Christopher & Ryals, 1999). The cascading effect that strategy has on flexibility is carried over to how flexibility also impacts on the performance of a supply chain (Jenkins & Wright, 1998). Where this is positive, it improves how effective supply chain initiatives become, despite the fact that the connection between flexibility, strategy and performance have not been much researched in supply chain management (Fantazy et al., 2009).
2.6.1. Supply Chain Strategy
- For supply chain to attain its strategic position within a firm’s operations, Vickery et al. (2003) are of the opinion that there is the need to adopt the system perspective whereby the supply chain strategy is integrated into the organisation’s strategy for the value chain whiles taking note of the supply chain partners. Two aspects of this system perspective are supply chain integration and integrative information technologies. The conclusions of Vickery et al. (2003) identify a positive relationship between information technology systems and the integration of supply chain. For the aspect of integrating information technology, a firm deploys information technology systems which provide the advantage of both internal and external integration. The intermediating factor which ensures that supply chain integration results in improved performance is client service strategy (Vickery et al., 2003).Due to changing levels of client expectations and the dynamics of competition, it is necessary for management to adopt a dynamic view of supply chain strategy. When supply chain strategies take into consideration the lifecycle of products, it aids firms to become dynamic in their supply chain operations because demand levels during each lifecycle of the product are not static, requiring flexibility in supply chain strategy (Aitken et al., 2003). One other consideration to be made is the value of supply chain partners. These make strategic choices, provide supply partnerships, create cross-functional teams, and enhance the relationships existing between clients and suppliers. According to Vickery et, al. (2003) supply chain partners are an important part of a firm’s supply chain integration process which increases the performance of the firm (Frohlich & Westbrook, 2001). A vital part of supply chain integration afforded by supply chain partners is the high level of resource utility as the higher the efficiency with which resources are utilised the higher the efficiency of operations (Closs et al., 2011). In their view, Harrison and New (2002) opined that companies which regard the critical role of supply chain strategy in the overall corporate strategy in achieving sustained competitive position are successful.Supply chain management literature is replete with various forms of supply chain strategies, some of which are: the four strategies proposed by Katz et al. (2003) based on information sharing – appending, innovation, modularizing and following; and Fisher’s (1997) supply chain strategies of efficient and responsive supply chain based on the product and demand. It is needful for those managing the supply chain to align the supply chain process with the kind of product the organisation is offering. According to Fisher (1997), an efficient supply chain strategy focuses on functional products whiles the responsive supply chain strategy focuses on innovative products. Lee (2002) also proposed the agile (strategies that are responsive and flexible aimed at fulfilling unpredictable client needs whiles minimising the risk of supply shortages) and risk-hedging (managing supply chain risks by pooling risks and sharing resources) supply chain strategies. Another group of supply chain strategies in literature is the Client-Oriented Strategy (COS), the Innovative Strategy (INS) and the Follower Strategy (FOS) (Fantazy et al., 2009). The COS leans towards the satisfaction of the consumers by means of providing exceptional client services and delivering reasonable service, whiles the innovative strategy strives to be the first mover and gain a competitive position that the firm can sustain, and finally, the follow strategy follows the first two and dwells on achieving cost reduction in operations.
2.6.2. Supply Chain Flexibility
- For the Supply Chain to be flexible, there is the need for interrelationship and coordination of the various functional areas of an organisation such as the marketing, finance, production, and service departments. There should also be the coordination of both internal functional areas and the external elements of the supply chain partners (Vickery et al., 1999). Research abounds in the variety of supply chain flexibility capabilities available to firms (Oke, 2005; Salvador et al., 2007). Kim (1991) asserted that flexibility is related to both logistics and operational functions in an organisation; Kotabe & Mol, (2009) also pointed out that flexibility must go with the organisational structure and hierarchy of authority in the business. Whereas the issues of variety, volume, materials and process are considered by D’Souza and Williams (2000) as necessary elements of supply chain flexibility. In the view of Garavelli (2003), flexibility in logistics is a matter of integrating both downstream and upstream (also known as distribution and procurement flexibility) in sourcing materials and making a product available in the market. Product flexibility deals with how client requirements are used in the customization of products that suit them, whereas access flexibility focuses on the ability to provide extensive distribution channels for the product (Vickery et al., 1999). In addition, Sanchez and Perez (2005) also considered two forms of flexibility: delivery and sourcing flexibility in terms of a firm’s capability in utilising JIT and being able to procure raw materials or components respectively. Then also, information systems flexibility was proposed by Duclos et al. (2003) like the flexibility of a firm in aligning information systems to the dynamic information requirements of the firm together with the ability to respond to the changing expectations of consumers. The type of supply chain flexibility adopted by a firm depends on its particular situation, therefore, there is the necessity of supply chain partners to provide capacity and eliminate redundancies within the system which can come about through the convergence of supply chain objects across all partners in the chain who are willing to compromise on the basis of cost and benefits (Simchi-Levi, 2011).Two other aspects of flexibility that have been proposed are volume and launch flexibility. When a firm is able to respond to client demands by adjusting capacity, it has volume flexibility, and the firm’s ability in introducing brand new products or improving or varying existing products means the firm has launch flexibility (Vickery et al., 1999). The interrelationship between these two types of flexibility and the dynamic nature of a business’ environment impact on the firm’s performance. The findings of their research indicated that where there is volume flexibility, a firm is capable of managing uncertainties in the market, and where there is launch flexibility, a firm is able to manage its product uncertainties (Vickery et al., 1999). Within a supply chain are various systems interact with one another though they may not be centrally located. Hence, a network approach towards supply chain strategy has been proposed (Garavelli, 2003). The implication is that companies would have to stretch their resources in an attempt to attain full flexibility, hence would not settle for no flexibility at all, but develop a balance in their quest for flexibility. The advantage in this process is that a firm can achieve optimum supply chain operations, enhance its ability to manage costs, and improve the effectiveness of resources and plants allocation within the supply chain (Garavelli, 2003).
2.6.3. Supply Chain Performance
- The measurement of supply chain performance has been considered along both financial and non-financial lines (Maskell, 1991). Metrics used to measure the performance of supply chain as noted by Harrison and New (2002) include order fulfilment lead-time, delivery cost per unit, obsolescence rate, inventory days of supply, warranty costs and client return rate. Accordingly, Vickery et al. (2003) identified that the use of both intermediate and final performance outcomes are necessary. In his view, Maskell (1991) says that financial measure is more suited for strategic decisions, whereas the day-to-day decisions demand non-financial (Gaiardelli et al., 2006). An example of financial performance measures is sales growth and operating profit performances. On the other hand, examples of non-financial measures include client satisfaction and lead-time performances.Emphasis on service supply chain management implies that service performance dimensions should be taken into consideration. Six of such service performance measures were identified by Fitzgerald et al. (1991) and these are:× Competitiveness: a firm’s capability of winning new clients and creating client loyalty;× Financial performance: the use of such ratios like asset turnover, profit per served client, cost of labour control, and capital costs; × Flexibility: this involves a firm’s ability to develop service designs which are able to provide speed of service delivery, flexibility in volume and specification flexibility in the long term. There is also the need to utilise flexible employment contracts and different pricing and promotional policies to enhance demand;× Resource utilisation involving the efficient use of equipment, facilities, and staff;× Innovation: being able to measure the process of innovation as well as the innovation itself; and× Quality of service: maintaining a healthy link between consumer expectations and quality delivery, whiles using a clear objective of client expectations as a guide for measuring consumer satisfaction. Another aspect of supply chain performance measurement is the effectiveness of aftersales services. A framework was developed in which both short and long-term strategies are assessed to ascertain the level of operational performance of a firm’s supply chain (Gaiardelli et al., 2006). Financial performance measures reveal the overall strategic level of supply chain performance. On the other hand, the use of client satisfaction and flexibility of supply chain is used to assess the operational level of supply chain performance. Another contribution of Gaiardelli et al. (2006) in terms of measuring supply chain performance is the reliability and responsiveness of front office and the use of waste, asset utilisation, and internal lead time as a measure of back office activities.
2.7. The Ghanaian Automobile Industry
- The Ghanaian automobile industry in the last decade has been dominated by major household makes like Nissan, Toyota, Hyundai, Kia in the affordable car segment; and Jaguar, Land Rover, BMW, and Mercedes-Benz in the luxury segment. Around this time, Japan Motors Trading Company and Auto Parts were the only licensed distributors of Nissan vehicles in Ghana; Toyota Ghana Company Limited (formerly Ghana Motors, GHAMOT) was the only authorised dealer of Toyota cars in Ghana, while Hyundai Motors and Auto Plaza were sole dealers of Hyundai vehicles in Ghana.Rana Motors was also the only licensed dealer of Kia vehicles in Ghana while Modern Auto Services (MAS) dealt in SsangYong, and later other Chinese makes like Chana and Lifan. CFAO Motors had the sole distributorship of Renault and Mitsubishi vehicles in the country while Africa Motors traded in Suzuki and Chevrolet vehicles. In the luxury segment, Silver Star Automobile was the sole distributor of Mercedes-Benz vehicles while Mechanical Lloyd had the franchise for Land Rover and BMW vehicles. Mechanical Lloyd later lost the Land Rover franchise to Alliance Motors who were already the sole distributors of Jaguar vehicles in Ghana. The industry from the beginning of 2000, however, took a new turn with new firms entering the market, introducing newer franchises Parwani (2015).However, in what the traditional automobile firms describe as the emergence of the grey market of Ghana’s automobile industry, Stelin Automotive entered the market selling Mitsubishi and later Toyota vehicles from Dubai. Much later, StoubLimited also replicated Stelin by introducing Toyota Land Cruisers with extra features from Dubai – creating a parallel market and therefore a stiff competition for some of the traditional auto houses.
2.7.1. Challenges in the Ghanaian Automobile Industry
- In any properly controlled economy, necessary agencies are put in place by the government to regulate the importation, sales and use of such products as important as an automobile. Sadly enough, this has not been the case with Ghana where there are many grey importers who knowingly or unknowingly would bring in vehicles that are neither environmentally conducive nor mechanically compliant. This is a phenomenon that impedes national development. For instance, these grey imports make it impossible to render accurate sales figures hence the inability of economic planners to have the appropriate statistical figures to help plot growth in the sub-sector. In view of such negative practices in the Ghanaian auto-market, currently, this grey market is forming a significant part of the auto market which is fiercely competing against genuine products for sub-Saharan Africa. The situation has created a very strong challenge for the organised and genuine auto-market brand builders who invest their monies in the business for long term gain. Parwani (2015) wrote that due to the quality of these grey imports, the maintenance cost is usually very high, thereby creating financial nightmares for automobile users. And a disturbing aspect is the distrust which customers develop for the genuine brand holders.
2.8. Conceptual Framework
- Figure 1 represents the supply chain of Toyota in Ghana. After the production of the cars and spare parts by the Toyota Motor Corporation (TMC), they are delivered to TGCL. Prior to the introduction of TGASS, TGCL serves their customers directly. TGCL had only two centres serving the whole of Ghana. Accra centre serving the whole of Southern Ghana, and Kumasi serving the Northern Ghana.
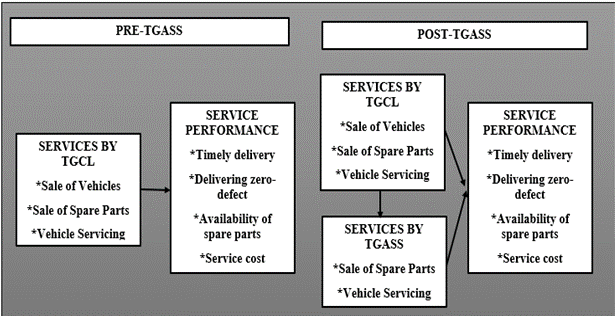 | Figure 1. Conceptual framework of the study |
3. Methodology
- The mixed method approach was adopted in the conduct of the study. Toyota Ghana Company Limited was selected as the case for the current study. A total of 90 participants comprised of 15 (managerial staff of TGCL) and 75 (clients) from the TGCL and TGASSs respectively across the country were selected as study participants. The purposive sampling techniques were utilised in selecting the participants in managerial positions whereas the convenient sampling technique was adopted specifically to select the clients. Both questionnaire and unstructured interviews were used as data collection instruments. The questionnaire was adopted primarily to elicit useful information from the clients concerning the impact of the new service operation strategy used by the TGCL in its service to customers in Ghana. Study participants in managerial positions were rather interviewed. Descriptive statistics were used in analysing the data collected. Paired sampled T-tests were also used to assess the impact of the new service strategy on the performance of the company before and after its introduction from the perspectives of both management and clients.
3.1. Profile of Toyota Ghana Company Limited
- Toyota Ghana Company Ltd (TGCL) was incorporated in Ghana in January 1998 by the investment of Marubeni Corporation, Japan and Marubeni Auto Europe S.A., Belgium and started operations in April 1998. In 2008, Marubeni Corporation, Japan became the sole shareholder of the company. TGCL is currently the sole representative of Toyota Motor Corporation of Japan (TMC). Consequently, its principal activity is the sale and distribution of new Toyota vehicles and Spare Parts as well as the provision of After-Sales support for the vehicles.In late 2013, the company became the sole representative of HINO Trucks, selling HINO trucks and providing after sales support for its clients. Currently, TGCL has five (5) branches in Ghana - Accra, Kumasi, Accra Body & Paint Shop, Tema and Tarkwa with two Liaison offices in Tamale and Takoradi and a staff strength of about 470. For affiliates, the company has five (5) Authorised Service Shops: Cape Coast Technical Institute in Cape Coast, Ansuare Company Limited in Tamale, Kwansa Auto Ltd in Takoradi, Gerco Auto Ventures in Ho and EUSBETT Toyota Service Center in Sunyani.
4. Results and Discussions
4.1. Demographics of Respondents
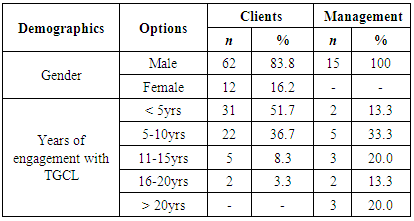
- Data was collected on two aspects of respondents’ demographic characteristic deemed relevant to this study, namely, gender and years of engagement with TGCL. From Table 1 it is obvious that approximately 84% of the clients sampled for the study were males, whereas 16% were females. This is not surprising, as in Ghana most cars are male-owned. All management members sampled were males (100%). This is also not surprising given the fact that most of the garages are managed and owned by males. The management members from TGCL were also males. This is the case because in Ghana most managerial position in organisations is male dominated. Also, the industry seems too technical to be of interest to females.
|
4.2. Nature of TGCL Service Operations
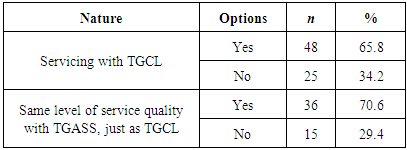
- In Table 2, the clients sampled were asked if they patronised the services of TGCL before the introduction of this new operating service strategy. The responses revealed that most of the respondents about (66%) indicated ‘Yes’, whilst 34% said ‘No’. By implication, most of the respondents have experienced both service operation strategies, and could better provide an assessment on before and after the introduction of the new service. Out of the respondents who experienced both service operation strategies, approximately 71% indicated they enjoyed the same level of service with the new operation system (TGASS), compared to the direct services from TGASS. About 29% were, however, dissatisfied with the new operating service.
|
4.3. Supply Chain Performance before TGASS
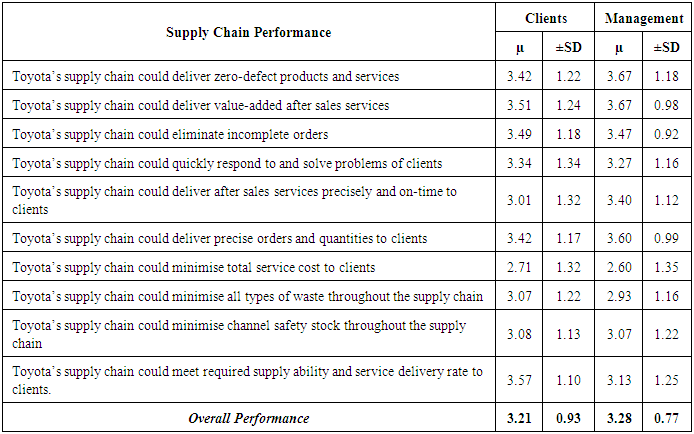
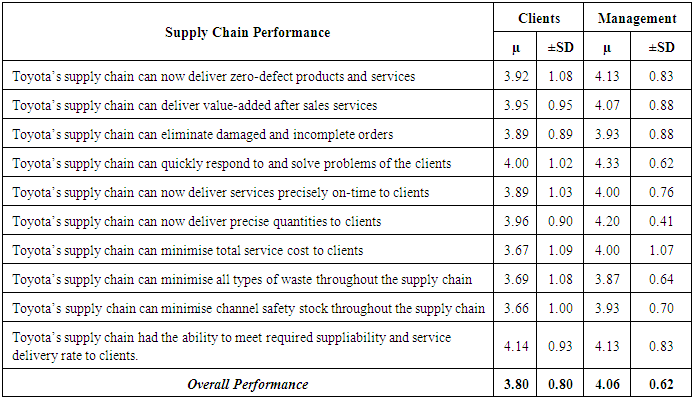
- In assessing the TGCL supply chain performance before the introduction of TGASS. Respondents were asked to respond to a series of questions on a 5 point Likert scale of 1-strongly disagree, 2-disagree, 3-neutral, 4-agree, and 5-strongly agree. The responses from both clients and management (TGCL and TGASS) is presented in Table 3.
|
|
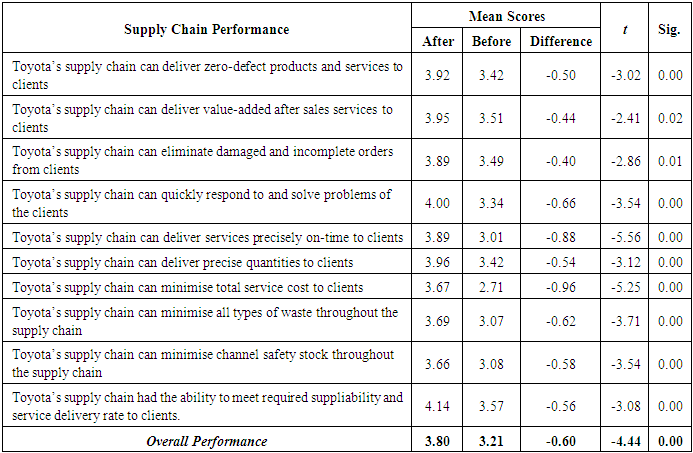
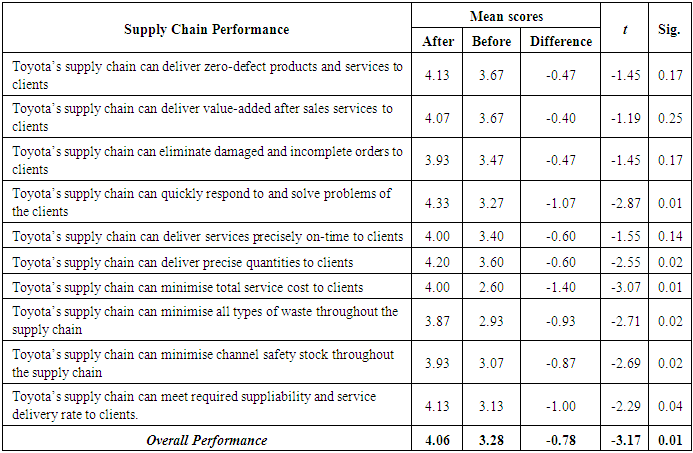
4.4. The Effect of the New Service Operation Strategy on the Supply Chain Performance of TGCL
- The fourth objective sought to examine the effects of the establishment of the new operation strategies on supply chain performance of TGCL. The effects were ascertained by running Paired-Samples T-Test for the mean difference of the supply chain performance, before and after the introduction of TGASS. The confidence interval was 95%, and the level of significance at 0.05. A separate analysis was conducted for clients and management, so as to record their distinct perception on the supply chain performance of TCGL.From Table 5, it could be discovered that the mean scores for all the items after the introduction of TGASS were higher than the scores before the introduction. The t-test was meant to establish whether this difference was statistically significant or not, at 0.05 level of significance. From the analysis, Toyota’s supply chain had the ability to deliver zero-defect products and services to final clients after TGASS than before, and this was statistically significant (t= -3.02; Sig.= .000).
|
|
5. Conclusions
- The study sought to explore the effects of the introduction of TGASS service strategy on the performance of the supply chain of Toyota Ghana Company Limited. From the analysis of results, it can be concluded that the overall supply chain performance of TGCL has significantly improved with the introduction of the TGASS service strategy. The mean scores of all the supply chain performance items were greater than the performance scores before the introduction. Moreover, the t-test results indicated these mean differences were statistically significant. The scores for all the items under the supply chain performance after the introduction of TGASS were all higher than the performance before the introduction of TGASS. Clients indicated the current service operation strategy was much better, easier and faster. For TGCL to benefit from the change in service operations, there is the need to put in extra effort in training the staff of the TGASSs, to deliver services just as TGCL would have delivered. This suggestion stems from the fact that, some of the clients complained staff of TGASS do not exhibit professionalism during service delivery. The staff of TGASS must not only be provided with technical training but customer service as well to enhance their human relations expertise. It is important for TGCL to support the service strategy with the provision of improved spare part deliveries to the TGASSs to avoid delay delivery of spare parts to clients since vehicle servicing and maintenance depends on the availability of spare parts. One of the reasons for engaging the TGASSs is to reduce the cost of opening outlets by TGCL. However, the services of these TGASSs go a long way to influence the perceptions clients have towards TGCL. Some TGASSs, as indicated by the clients, do not have up to date facilities in servicing Toyota cars. It is therefore recommended that TGCL supports those TGASSs in acquiring the necessary technologies for quality service delivery.The results of the study prove enough of evidence to motivate the company to implement the new service strategy.