Obasanjo O. T.1, Nwankwo O. C.2
1Department of Geography, Ahmadu Bello University, Zaria, Kaduna State, Nigeria
2Transport School, Nigerian Institute of Transport Technology, Zaria, Kaduna State, Nigeria
Correspondence to: Obasanjo O. T., Department of Geography, Ahmadu Bello University, Zaria, Kaduna State, Nigeria.
| Email: |  |
Copyright © 2014 Scientific & Academic Publishing. All Rights Reserved.
Abstract
Distribution of petroleum products by road transport is characterized by various constraints. The study is aimed at examining the constraints of distributing petroleum products from PPMC Kaduna using road transport. Data were sourced through primary and secondary sources, using random sampling technique questionnaires were administered. The findings revealed that there is a continuous increase in the volume distributed and the numbers of trucks used yearly. Using K-W test, the study reveals that the first ranked constraints were mechanical problems, short-fall and delay in off-loading respectively. Furthermore, the correlation matrix of the trucking problem result reveals that five pairs of the variables were inter-related. The student t-test also shows that the volume of petroleum products and number of trucks used were significant at 0.05 confidence level. It revealed that there is a significant difference in the volume and number of trucks used in transporting petroleum products by road transport. For instance, the combination of PMS and number of trucks used shows a t-test value of 1.447, p. <0.222, while DPK- number of trucks shows a t-test value of 1.751, p.<0.155 and AGO-number of trucks indicates a t-test value of 1.833, p. <0.141, at 4 degrees of freedom and at 0.05 level of significance respectively, in that the compared mean’s t-test is statistically significant. It is recommended that modern technology should be adopted; there should be integrated monitoring, evaluation, vehicle tracking technology and continuing driver training education for effective distribution logistics.
Keywords:
Petroleum products, Road transport, Distribution
Cite this paper: Obasanjo O. T., Nwankwo O. C., Distribution Constraints of Petroleum Products by Road Transport from Pipeline and Products Marketing Company (PPMC) Kaduna, Journal of Logistics Management, Vol. 3 No. 2, 2014, pp. 21-27. doi: 10.5923/j.logistics.20140302.01.
1. Introduction
Transportation is the physical movement of passengers and goods from one geographical location to another to enhance their utility (Akintayo, 2010). Nigerian cities are facing rapid population explosion due to urban rural drift for the search of greener pastures. Transportation gets worst due to the increase in population without improvement on transport facilities. Economic transformation, and indeed, the development of any country are hardly possible without an efficient transport system (Lingaitiene, 2006; Tijjani and Nwankwo, 2013). This is because goods should be transported from origin to destination at minimal costs and time (Ubogu 2011).Transport system permits goods such as petroleum products to be sold to consumers in places far distant from the region where they are produced. Economists assert that goods have not been produced until they have actually been transported to the final consumers who will satisfy their want (utility) by the consumption of the goods. It therefore means that transportation by moving goods from point of production to the point of consumption is fulfilling productive services (Akintayo, 2010). In transporting goods, we have different modes such as rudimentary forms, road, rail, air, water and pipeline transport. However, each mode has its comparative advantage. The road transport is flexible, easy to operate and faster than most other modes of transport (Ndikom, 2008). Roads by far handle the largest freight transport share in Nigeria. The highways in the country generally account for about 70% of the movement of goods and persons in the country (Ubogu, 2011). The various modes of transporting petroleum products complement each other on numerous occasions, although in some cases they stand in competition against each other. Road transport forms the major linkage between the depots and the bulk consumers and retails outlets. The cost per unit of transporting the products by road depends both on the road tankers vehicles in use. This is one of the main issues in freight transportation demand all over the world (Obasanjo, 2013).In Nigeria, refined petroleum products are transported from the refineries through a network of pipelines, coastal (marine) vessels, road trucks and rail wagons to the 21 regional storage/distribution depots, spread across the country. It is from these depots that the marketing companies used to obtain their supplies. NNPC is supplied through imports and locally refined products by both the major and the independent marketers. The major marketers account for 70% of products distributed in 2008, according to data from the Nigerian National Petroleum Corporation (Nigeria National Petroleum Corporation, 2008). About 80% of freight movements are done on the road and there has been a steady growth in number of heavy goods vehicles. We have an average of about 5,000 tankers involved in wet cargo haulage, to move about 150 million liters of fuel and 2,500 trailers in dry cargoes plying Nigeria roads daily. However, bad roads, poor road networks and also various hindrances such as delays at police, military, state revenue agency and customs check points obstructs an effective and efficient logistics (Olagunju, 2011). For some time now in Nigeria since the comatose condition of the rail transport, road haulage of petroleum products has assumed a wider dimension due to its flexibility and door-to-door service has become the most utilized way of intercity movement of goods and services, which has also led to the inflation of transport cost.Road transportation is the dominant mode of transportation in Nigeria. The restrictive nature of the water ways, coupled with the near collapse of the rail system, and the high cost of air travels have further exerted a lot of pressure on the road as over 70 percent of the total movements in the country are made by the road. In fact, about 80% of the freight movements are done on the road. In Nigeria, there has been a steady growth in number of Heavy Goods Vehicles. We have an average of about 5,000 tankers involved in wet cargo haulage, to move about 150 million liters of fuel and 2,500 “trailers” in dry cargoes plying Nigeria roads daily (Olagunju, 2011). However, in Nigeria, bad roads, poor road networks and also various hindrances such as delays at police, military, state revenue and customs check points obstructs an effective and efficient logistics. Abdulmalik and Omokoghio (2009) revealed that petroleum products distribution is faced with short deliveries and high lead time on a daily basis. The petroleum products are entrusted to the transporter and driver until the point of discharge at the dealers’ premises. It is usually within this stage of the supply chain that short deliveries are experienced, where the quantity loaded is less than what is recorded at the discharge point. It has become a perennial problem in the industry to see short deliveries on a daily basis.The inefficiencies associated with transporting goods to hinterland locations include exorbitant freight costs, traffic delays caused by the piece-meal loading, very slow movements and en-route breakdowns as well as armed robbery attack. Also, physical distribution of hinterland-bound cargoes at present has had to contend with numerous constraints among which are delays, costly delivery system, accidents and increasing demurrage. Not much has been done to alleviate these problems because the best practice has not been put in place (Ubogu, 2011). Nnadi (2006) set out to determine which mode was more significant in the domestic transportation of white products in Nigeria. It was revealed in the study that, the road transportation of petroleum products was associated with problems such as short deliveries, accidents, lives and property destruction, diversion of products, delay of tankers as a result of traffic, bad road and nonchalant attitudes by some tanker drivers.Recognizance survey carried out by Somuyiwa (2010) revealed that the distribution problem from companies to various customers in Nigeria is fraught with inefficiencies at both the system and firm levels. There are infrastructural shortfalls and mismatches in form of inventories and facilities. For instance, most of the vehicles used for outbound are not properly scheduled and routed, there are duplications of channels and perhaps not all vehicles are utilized. Again, there is poor warehouse management system as a result of possible duplication of warehouse entity in the same town. Most importantly, there are no effective customer service measures such as customer feedback. Indeed, no formal supply chain measures are not discernible and could be described as hardly in existence. Hence, the institutional structure of these companies is inappropriate, and there is a lack of integrated planning within and among various companies in the study area. Above all, information gaps and asymmetries abound, the skill base is deficient and the regulatory frameworks are incapable of resolving distribution problems of these manufacturing companies, consequently, these are likely to enhance increase in outbound logistics cost. The fundamental purpose of this paper is to examine the volume of petroleum products loaded and distributed by road transport, and the level of shortfall and diversion in delivering products from PPMC Kaduna to retail distribution centers in Kaduna state. Also, to determine the distribution structure of approved filing stations in Kaduna and constraints of distributing petroleum products from PPMC Kaduna by road transport.
2. Materials and Methods
This study is based on primary and secondary sources of data. Primary source of data was questionnaire administered systematically to DPR approved petroleum products retail distribution centers and their petroleum products truck drivers (respondents), while the secondary source of data was the published data from the PPMC and DPR archives while empirical source of data were from responses to a structured questionnaire. Using the Sample Size Calculator (2014), the sample size of each senatorial zone was determined based on 95% confidence interval and 5.0% margin of error follows: Kaduna Central Senatorial Zone: (Population; 332 and Sample size; 178), Kaduna South Senatorial Zone: (Population; 84 and Sample size; 69) and Kaduna North Senatorial Zone: (Population; 185 and Sample size; 125). Responses were transcribed, coded, summarized in frequencies and analyzed descriptively in percentages. The constraints that were revealed by the respondents was analysed by Kruskal Walli analysis of variance. According to Morgan et al (2004:158) Kruskal-Wallis test and ANOVA have similar power to detect a difference. Student t-test was also employed to test the degree of difference between the volume of petroleum products transported and the number of trucks used in transporting these products. Correlation matrix was used to further examine the extent of the association between the constraints.The study area - Kaduna, is a state in the North-west geopolitical zone of Nigeria. Its capital is Kaduna. The state is the successor to the old Northern Region of Nigeria, which had its capital at Kaduna. In 1967 this was split up into six states, one of which was the North-Central State, whose name was changed to Kaduna State in 1976. This was further divided in 1987, losing the area now part of Katsina State (Kaduna State Government, 2013). Kaduna town, the state capital, was founded by the British in 1913, but the State extends well beyond its capital centre. In 1956, Kaduna town was declared the Capital Territory of the former Northern region, and later the capital of former North Central State, made up of the two colonial provinces of Zaria and Katsina. It has remained the unofficial political capital of the northern region. In I976, when the General Murtala Mohammed administration created seven new States in Nigeria, the then North Central State, with capital at Kaduna, was renamed Kaduna State. In 1987, when the number of States in the country was increased again from nineteen to twenty-one, Katsina Province became Katsina State, while the old Zaria Province became the new Kaduna State. Administratively, States were initially divided into provinces and Native/Local Authorities. However, in 1976, the Murtala Mohammed administration introduced the Local Government Administration system, which delegated some responsibilities to elected/appointed councillors. With each successive Military Government, the number of the LGAs in Kaduna State was increased, from 14 in the early 1980s to 23 in 1998 (Kaduna State Government, 2013).
3. Results and Discussion of Findings
The different means of transportation have different characteristics and requirements that offer advantages and disadvantages depending on the particular circumstances of the operation. They also have different costs and capacity (Obasanjo, 2013). According to Douglas et al (1998) the needs identified include delivery urgency, type and characteristics of supplies to be transported, cargo, volume, size, destination and distance all of which will determine the type of mode to be used and its cost. The major determinant of the volume of petroleum products transported is based on the carrying capacity of the truck.Figure 1 shows that in 2008, 15,041 m3 of PMS was loaded from PPMC Kaduna using 5,251 Trucks, in the same year 11,012 m3 of DPK and 21,223 m3 of AGO were loaded using 6112 and 5042 trucks respectively. From the above figure, it can be deduced that as the year goes by the demand for petroleum products increased, thereby making the volume distributed in each year higher than the previous years with also an increase in the trucks used in transporting these petroleum products. In 2012, AGO recorded the highest volume of product loaded by PPMC Kaduna, amounting to 355,975 m3 using 10,815 trucks, followed by 345,842 m3 of PMS loaded from the same point using 11,026 trucks and 203,282 m3 of DPK product with 8,634 trucks loaded. This reveals that there is an increase in the volume of petroleum products transported from PPMC Kaduna.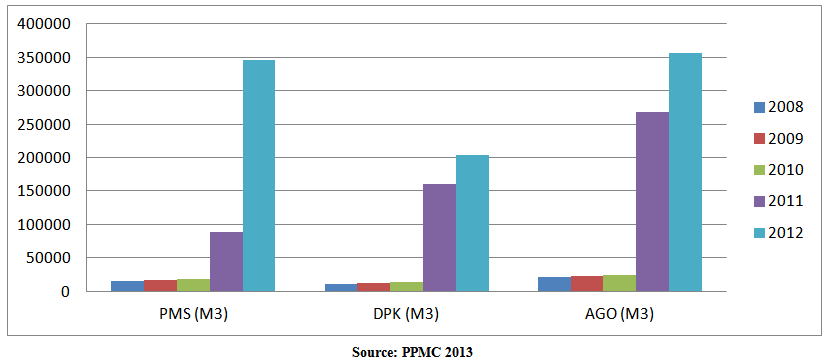 | Figure 1. Volume of PMS, DPK and AGO distributed products in Kaduna State from Kaduna Refinery Depot 2008 – 2012 |
Furthermore, figure 2 reveals that there is an increase in the numbers of trucks used in the distribution of petroleum products due to the increase in volume of the petroleum products transported. 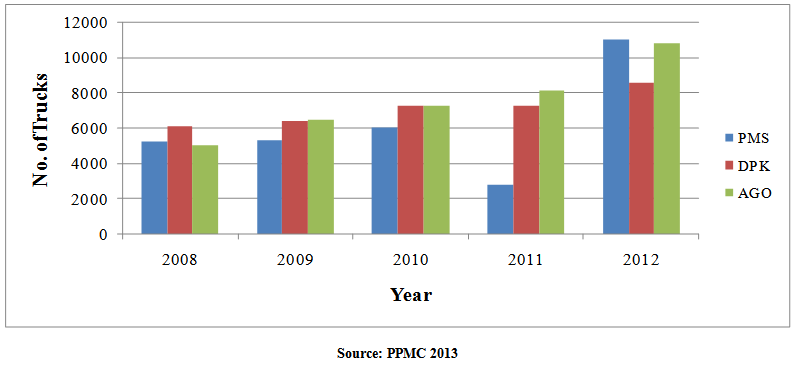 | Figure 2. Number of Trucks used in Distributing PMS, DPK and AGO in Kaduna State from Kaduna Refinery Depot 2008 – 2012 |
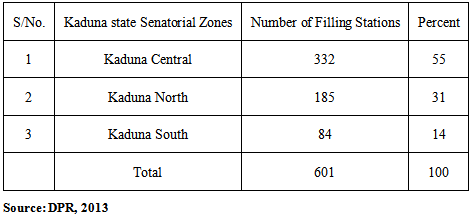
Distribution system faces some constraints of which some are to transporters while some are to the filling station management.Table 1 show that Kaduna state has a total number of 601 approved filling stations. Kaduna Central Senatorial zone has a total number of 332 representing 55% of the total number of filling stations in the state. This is followed by Kaduna North with a total of 185 representing 31% while Kaduna South is the least with 89 filling stations representing 14% of the total number.Table 1. Distribution structure of filling stations in Kaduna State
 |
| |
|
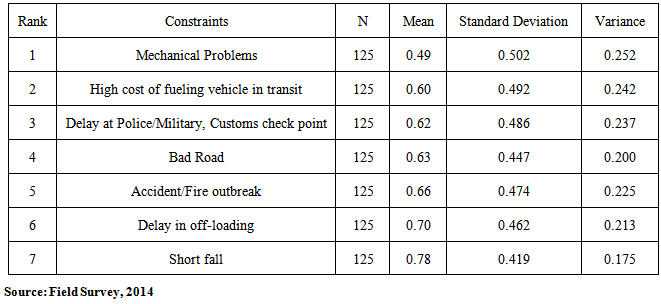
The rank-order of the constraints in Table 2, 3, and 4 using Kruskal-Wallis non-parametric test for repeated measure analysis. Out of the 18 constraints listed for the respondents to rank, only seven constraints as shown in Table 2, 3, and 4 was ranked one to seven in the various Senatorial zone in Kaduna State. As shown in Table 1, the most problematic constraint in Kaduna North Senatorial zone with a mean of 0.49 and a standard deviation of 0.502 is mechanical problem faced by petroleum products transporters. This was followed by high cost of fueling vehicle in transit with a mean of 0.60 and a standard deviation of 0.492. Delay at police, military and customs check points was ranked third because of the state of insecurity in Kaduna State and some part of northern Nigeria. The trucking industry in Nigeria has had to contend with poor maintenance of the roads which leads not only to high rates of accidents and cost of vehicle maintenance but also reducing the travel speed of trucks (Kanawa, 2007). Table 2. Rank-order of Constraints of Distribution by Road Transport in Kaduna North Senatorial Zone
 |
| |
|
Further examination of the constraints of distribution of petroleum products by road transport in Kaduna Central Senatorial zone reveals that short fall is the first ranked constraints with mean of 0.60 and standard deviation of 0.491, followed by high cost of fueling vehicle in transit with mean of 0.61 and standard deviation of 0.489. As shown in Table 3, delay in loading at PPMC and Mechanical problems were ranked the sixth and seventh constraints faced by respondents.Table 3. Constraints of Distribution by Road Transport in Kaduna Central Senatorial Zone
 |
| |
|
Table 4 reveals that the constraints faced by respondents in the distribution of petroleum products in Kaduna South Senatorial zone in ranking order was delay in off-loading with mean and standard deviation of 0.28 and 0.450 respectively. Followed by traffic congestion, High cost of fueling vehicle in transit, state revenue task personnel, delay in salary, delay at police/military and customs check point and bad road in the order at which it was ranked. From this, it can be deduced that in Kaduna South senatorial zone the most prone constraint is delay in off-loading of petroleum products.Table 4. Constraints of Distribution by Road Transport in Kaduna South Senatorial Zone
 |
| |
|
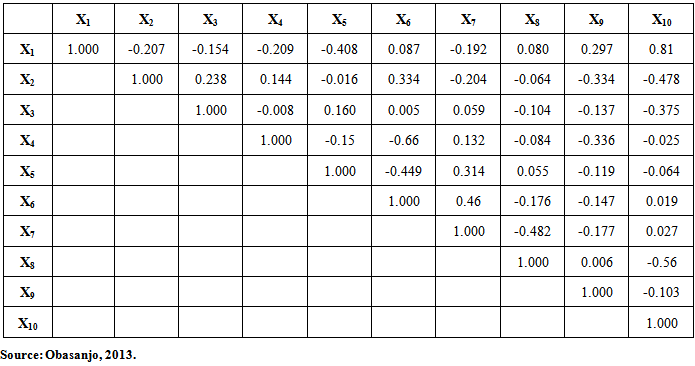
This study further examined the extent of the association between the problems under investigation. Table 5 shows the spearman’s correlation matrix for the ten selected problems tagged X1 (Bad roads), X2 (Theft/Robbery), X3 (Accident), X4 (Traffic congestion), X5 (Mechanical problem), X6 (Delay at police and military check points), X7 (Short delivery), X8 (Inter-state revenue personnel), X9 (Delay in salary) and X10 (Delay in off-loading). It is obvious from the correlation matrix that 5 pairs of the variable were related. Table 5 shows the correlation matrix of association of the constraints of moving petroleum products by road transportation.From the Table 5, pair X10 by X1 reveals that the higher the bad roads the higher the delay in off-loading because bad roads will affect the tankers’ speed, thereby increasing the number of days taken for delivery of petroleum products and off-loading. Similarly, X7 by X6 indicates that the higher the delay at police and military check points, the higher the short-delivery because petroleum products evaporates and the higher the delay, the higher the rate of evaporation and manipulation by truck drivers that eventually leads to short-delivery. Furthermore, X2 by X6 shows that delay at police and military check points exposes the truck drivers to theft/robbery attack because the longer the tanker drivers are delayed, the longer time spent to their destination which can endanger them to theft/robbery at night. Pair X7 by X5 indicates that the higher the mechanical problem, the higher the short delivery because the tanker drivers will have to spend more days that was unplanned for and incur more expenses that can make them drain petroleum products from the tank to resale to black-marketers in order to get money to solve their mechanical problem and welfare leading to short delivery at the final destination (Petrol filling station). The correlation matrix provides a useful relationship between the problems (Obasanjo, 2013).Table 5. Correlation matrix of association of the problems of moving petroleum product by road transportation
 |
| |
|
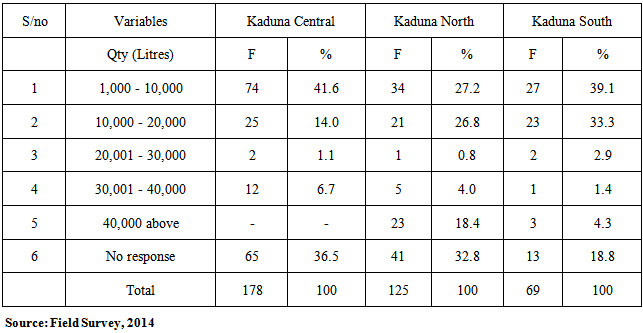
In delivering petroleum products to retail outlets there are some shortfall experienced. These are normally as a result of natural loss through evaporation but there are also instances of pilferage and diversion. The estimated quantity of shortfalls is indicated in the following tables. Table 6 shows the quantity of shortfalls per annum. In Kaduna Central Senatorial Zone, 41.6 percent filling stations agreed that they experience shortfall of about 1,000-10,000 liters; while Kaduna North Senatorial Zone, 27.2 percent filling stations experience shortfall of about 1,000-10,000 liters; and in Kaduna South Senatorial Zone, 39.1percent filling stations experience shortfall of about 1,000-10,000 liters. This indicates that short fall is a major constraint in the distribution of petroleum products in Kaduna State.Table 6. Quantity of Products in Litres Lost to Shortfall per Annum
 |
| |
|
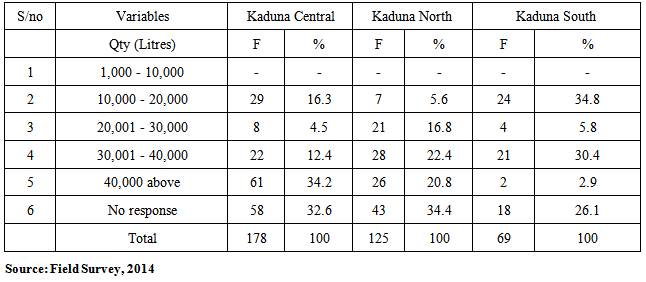
From Table 7, in Kaduna Central Senatorial Zone, 16.3 percent filling stations loose 10,001-20,000 liters to diversion; while in Kaduna North Senatorial Zone, 5.6 percent filling stations loose 10,001-20,000 liters to diversion and in Kaduna South Senatorial Zone, 34.8 percent filling stations loose 10,001-20,000 liters to diversion; this reveals that the filling stations are faced with issues on diversion of petroleum products.Table 7. Quantity of Products in Litres Lost to Diversion per Annum
 |
| |
|
The student-t test values as seen in Table 8 indicates that the calculated t-test for all the compared means were significant. For instance, the combination of PMS and number of trucks used to transport petroleum products shows a t-test value of 1.447, p. <0.222, while DPK and number of trucks shows a t-test value of 1.751, p.<0.155 and AGO and number of trucks indicates a t-test value of 1.833, p. <0.141, at 4 degrees of freedom and at 0.05 level of significance respectively. This implies that there is a significant difference in volume of petroleum products transported by road and the number of trucks used. This implies that road transport is not sufficient enough to move the volume of petroleum products distributed.Table 8. Student-t test statistics of paired differences between the volume of petroleum products and number of trucks
 |
| |
|
4. Recommendations and Conclusions
For distribution using road transport to be efficient and effective, issues concerning logistics, supply chain and supply chain management constraints should be taking into consideration. With the findings enumerated the following recommendations are made to improve the distribution of petroleum products by road transport: modern day technology like e-commerce, e-business, e-order processing, and Accuload III electronic loading Systems should be adopted for order placement, gauging and loading. This will help to reduce the positive and negative (gains and losses) variations in loading of products. PPMC and other marketers should consult the NITT Zaria and CILT Nigeria for human capacity development on distribution logistics. Petroleum products distribution companies should employ an integrated monitoring and evaluation system by using both personnel and vehicle tracking technology like Tachograph. PPMC should license more private depots to enhance distribution and determine haulage Vehicle Technical Standard and driver qualification, in order promote safety. NNPC and Marketers should collaborate with NITT and other relevant government agencies to promote and enforce PTDs mandatory continuing driver training education which can serve as a periodic qualification for drivers to enhance safety. Other modes of transport like Rail, Water and Pipeline should be integrated into distribution system to enhance effectiveness and efficiency. This study has identified the constraints associated with transporting petroleum products by road transport despite its flexibility of door-to-door service of delivering petroleum products. The result shows that there are operational and transportation constraints associated with the distribution of petroleum products. The major findings of this study shows that operational constraints leads to the variations seen in the quantity of petroleum products received and loaded out of the depot. The concentration of the majority of the filling stations in a metropolis calls for traffic, logistics and environmental safety concerns. Road transportation of petroleum products has many constraints which include; Bad Road, Traffic Congestion, Accident/Fire outbreak, Theft/Robbery attacks, Mechanical problems, Delay in Salary, Delay Loading at PPMC, Delay in off-Loading, High Cost of fuelling vehicles in transit, State revenue task personnel, Delays at police/Military and Customs check point, Distance between PPMC and destination, Leakage, Customer changing demand, Location, Operational problems from PPMC, Shortfall and Product Diversion. In as much as constraints cannot be completely avoided, they can be minimized through the use of modern day technology like e-commerce, e-business, e-order processing, and Accuload III electronic loading Systems should be adopted for order placement, gauging and loading. This will help to reduce the positive and negative (gains and losses) variations in loading of products.
References
| [1] | Abdulmalik, A. and Omokoghio, M. (2009). Short Delivery of Petroleum Products at Retail locations in Kaduna Region. Journal of Logistics and Transport, 1(2): 108 – 119. |
| [2] | Akintayo, S.B. (2010). Transport Economics. S. Asekome & co press Zaria. |
| [3] | Kaduna State Government. (2013). About Kaduna State. Retrieved November 20, 2013 fromhttp://www.kadunastate.gov.ng/index.php?option=com_content&view=article&id=295&Itemid=289. |
| [4] | Douglas M.L, James R.S and Lisa M.E (1998). Fundamentals of Logistics Management. Irwin McGraw-Hill. New York. |
| [5] | Kanawa, E. B. (2007), Position paper of the West African road transporters’ union, in: Paper presented at “The business implications of EPA negotiations for ECOWAS”, Accra, Ghana, September 5 – 6. |
| [6] | Ndikom, O. B. C. (2008). Elements of Transport Management. Bunmico Publishers, Lagos. |
| [7] | Lingaitiene, O. (2006). Application of a General Model of Multimodal Transportation in Logistics, The Journal of Transport and Telecommunication 7(1): 92-96. Retrieved January 19, 2014 from http://www.tsi.lv/Transport-and Telecommunication |
| [8] | Nigerian National Petroleum Corporation, (2008). Petroleum Products, Retrieved August 2, 2013, fromhttp://www.nnpcgroup.com/NNPCBusinessInformation/Investment. |
| [9] | Nnadi, U.K. (2006). The Economics of Zerorization in Road Transportation of Petroleum Products in Nigeria, Journal of Science Technology Research, No. 3, pp 12 -17. |
| [10] | Obasanjo, O.T. (2013). A Comparative Analysis of the Cost-Effectiveness of Petroleum Product Haulage from Kaduna Refinery and Petro-Chemical Company by Road, Rail and Pipeline (Unpublished Master’s thesis). Ahmadu Bello University, Zaria. |
| [11] | Olagunju, K. (2011). Articulated Lorries Management in Nigeria: Road Safety Perspective, a paper presented at the Road Safety forum, organized by the International Road Safety Organization; at Ladi Kwali Hall, Sheraton Hotel & towers, Abuja, 6th May, 2011. |
| [12] | Somuyiwa, A.O. (2010). Analysis of Logistics Cost in the Supply Chain Management of manufacturing companies in Southwestern Nigeria, 2002-2006 (Unpublished Ph.D Thesis). Olabisi Onabanjo University, Ago-Iwoye. |
| [13] | Somuyiwa, A.O. (2010). Problems and Prospects of Logistics in Nigeria: Explorative Analysis. Journal of Management and Society, 1(2): 17-26, Retrieved September 1, 2013 from http://www.lautechtransportmgt.com/journal.html |
| [14] | Tijjani, A. and Nwankwo, O. C. (2013). Examination of the Vehicular Emissions Level in Sabon Gari Local Government Area of Kaduna State, Journal of Logistics and Transport, 5(1): 47-55. |
| [15] | Ubogu, A. (2011). The Potentials of Rail-Road Integration for Port-Hinterland Freight Transport in Nigeria, International Journal for Traffic and Transport Engineering, 1(2): 89-107. |
 Abstract
 Reference
 Full-Text PDF
 Full-text HTML