Sultan Kuzu, Emrah Önder
School of Business, Department of Quantitative Methods, Istanbul University, Istanbul, 34322, Turkey
Correspondence to: Emrah Önder, School of Business, Department of Quantitative Methods, Istanbul University, Istanbul, 34322, Turkey.
| Email: |  |
Copyright © 2012 Scientific & Academic Publishing. All Rights Reserved.
Abstract
In this study, the long term relationship between economic growth and developments in the logistics sector are investigated. The basis of an econometric model, the relationship between logistics development and economic growth are established. The findings derived from analysis are annotated. Following methods are used in the analysis: Unit Root Tests, Engle-Granger Cointegration test and Granger Causality test. Two variables including GDP (represent to economic growth) and Turnover Index of Transportation and Storage (represent to logistic development) are used in this study. Through the analysis findings show that two variables are cointegrated. And in long run a Granger causality relation from economic growth to logistic development found. So it can be said that economic growth plays active role on the logistics development. Consequently, a Granger causality relation from logistics sector and economic growth is found in long run.
Keywords:
Cointegration Analysis, Economic Growth, Granger Causality Test, Logistics Development
Cite this paper: Sultan Kuzu, Emrah Önder, Research into the Long-Run Relationship between Logistics Development and Economic Growth in Turkey, Journal of Logistics Management, Vol. 3 No. 1, 2014, pp. 11-16. doi: 10.5923/j.logistics.20140301.02.
1. Introduction
Logistics deals with the planning and control of material flows and related information among and between suppliers to consumers. Improvements in transportation and logistics make valuable contribution to production and consumption activities. Logistics has become a leading industry, playing an important role in social and economic development. Industrial development, on the other hand, has a great effect for improved logistics sector[1].With economic globalization and the deepening of social division labor, logistics as a sophisticated organization and management technology, which showed more and more important strategic position in the economic development, and gradually cause for concern. Thus the interaction between logistics and economic growth has also thus become a research spot[2].In the world, the huge contribute of the logistics to economic development was already approved by the practice in many countries. Especially recently, the system and intensives of logistics also exhibits the important value of reducing environment pollution and accelerating the sustainable development. So the logistics are attracted broadly the attention by the people[3].
1.1. Overview of the Sector / Global Sector
Logistics industry is of great importance for the competitiveness of a country's foreign trade. As a result of the growth of the economies of the countries, the logistics sector has grown in importance. In addition, the location of a country is of great importance in terms of the logistics industry.According to World Trade Organization (WTO), Transportation services in the value of the total services was around 28% in the last ten years and in 2010, the rate was over 30%. When other service-items are examined, Transportation and Logistics industry sector appears to have an important place.In 2010, Transport has been the fastest growing component of exports of commercial services to increase of 14% and $ 782.8 billion to reach.
1.2. Logistics Industry in Turkey
Turkey, in terms of its strategic location, it holds a very important place in the World. Geography of Turkey, there are important advantages from the perspective of logistics. Our country's geo-strategic point of view is the bridge between Asia and Europe and the Mediterranean and the Black Sea and at the intersection of three continents[4]. Logistics companies in Turkey are serving mostly sectors, which are concentrated foreign trade. Textiles and apparel, automotive, consumer products, retail and food, petrochemicals, machinery manufacturing and construction sectors are among the sectors.Published by the World Bank Logistics Performance Index (LPI), Turkey is improving its logistics performance. LPI, which operates worldwide logistics operators in their respective countries on the ease of logistics based on feedback.
2. Literature Review
Held et al., (2000) accentuate that the regional logistics must be oriented on the development of regional economy through the development of logistic infrastructure and services.[5]Wen-Jie Zhang (2002) exercises the economics and the trade theory to analyze the relationship between economy and logistics, finally derives that the relationship of economy and logistics represent the economic globalization, the regional economic integration, the pursuit of profit and core competence in the regional enterprise, and the status quo of Chinese economic development promoting the development of Chinese modern logistics[6].Gong Zhong (2003) defined the exact meanings of regional logistics and regional economic growth. He selected three variables (freight, freight turnover, logistics network) as indicators to describe logistics from different aspects and also took every region’s GDP as its description indicators of economic growth. He had established two single-equation regression models about the effects of regional logistics impacted on the regional economic growth[7].Li and Zhang (2007) puts forward the evaluation system of regional logistics adaptability from the point of view the matching between the regional logistics and the regional economy, marks out or improves the regional logistics system to fit the regional logistics structure, the service level, the legal policy, the infrastructure, the information network, the personnel quality[8]. Ates and Isik (2010) are investigated in their study, The effects of development in logistics services on export led growth in Turkey. In conclusion, no relation can be found between logistics sector and export in short run but, in long run a Granger causality relation from logistics sector to export is found. In addition, a duplex causality relation from logistics sector revenue to industries production index. Consequently, a Granger causality relation from logistics sector and export is found in long run[9].Navickas et all (2011), In global economy the activity of logistics systems, its infrastructure usage for the purpose to achieve the growth of economy become a necessity, whereas the scope and aims of logistics systems and its infrastructure use become specific in a reason of the impact of country’s economic policy, focused on long-term competitiveness. Main factors of logistics systems impact on country’s economic growth could be embodied through development levels of logistics systems and its infrastructure, the impact of business environment, the mobility and effective use of resources, logistic flexibility and receptivity to innovations[10].
3. Data and Methodology
To predict future events and conditions, and many other areas of the economy is of great importance. To better predictions about the future, in terms of decision-making and policy-making, is required.The time series prediction model using a variable current and previous values are obtained.The concept of cointegration, in 1980, entered into the analysis of time series. Cointegration analysis is a method of attempting to determine whether a long-term relationship of two or more non-stationary time series. To be examined closely associated with economic variables in the long-run equilibrium.The presence of co-integration relationship between the variables indicates that these variables move together in the long term. Also if there is cointegration relationship between the variables investigated short-and long-term causal relationship.In this study, the long-term macro-economic relationship between the two variables examined. The data of the variables, which is used in this study, taken from the Central Bank of the Republic of Turkey’s National Databases and the official web page of Turkey Statistical Institute. The variables used in seasonal periods were obtained during the periods of 2005-2013[11].Eviews 7 package program was used for the econometric analysis.The aim of this study is to be established with an econometric model of the logistics development and economic growth will be investigated whether long-term relationship. The absence of numerical healthy data and details of the logistics sector cause to the use of data from the transportation and storage data. Numerical reflections of all the developments in the logistics industry also directly reflected in the transport and storage sub-sector is considered.First, unit root tests for this purpose whether the variables are determined degree of stability. To conduct cointegration analysis of the variables are the same degree. And then to apply Granger causality test of the variables are cointegrated.
4. Empirical Analyses
To conduct the Engle-Granger Cointegration test two variables are used in this study. They are Turkey’s GDP and turnover index of Transportation and Storage. Firstly investigate the stationary all of the variables with unit root test.
4.1. Unit Root Test
Analysis of the time series data by the method of traditional regression analysis are implicitly assumed the time series is stationary. The most commonly used techniques are Dickey-Fuller, Augmented Dickey Fuller and Phillips-Perron tests. To give a brief information about the Dickey-Fuller test;Consider the autoregressive model,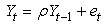 | (1) |
Where Y0 = 0, ρ is a real number, and {et} is a sequence of independent normal random variables with mean zero and variance σ2.The time series Yt converges (as t→∞) to a stationary time series if |ρ|<1. If |ρ|=1, the time series is not stationary and the variance of Yt is t σ2. The time series with ρ=1 is sometimes called random walk. If |ρ|>1, the time series is not stationary and the variance of the time series grows exponentially as t increases[12].Given n observations Y1, Y2, …Yn, the maximum likelihood estimator of ρ is the least squares estimator,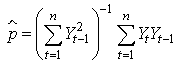 | (2) |
 is a consistent estimator for all values of ρ[13].Augmented Dickey-Fuller;DF test are confronted with the problem of autocorrelation. To eliminate this problem, DF equation enough to eliminate autocorrelation lagged value of the dependent variable is added to the right side of the equation. After the addition DF regression equation becomes Augmented Dickey-Fuller equation.The following model is used for the ADF test;
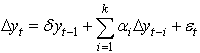 | (3) |
Hypotheses are the same DF tests.Phillips-Perron test;This test proposes new tests for detecting the presence of a unit root in quite general time series models. Their approach is nonparametric with respect to nuisance parameters and thereby allows for a very wide class of weakly dependent and possibly heterogeneously distributed data. The tests accommodate models with a fitted drift and time trend so that they may be used to discriminate between unit root non-stationary about a deterministic trend. The limiting distributions of the statistics are obtained under both the unit root null and a sequence of local alternatives. The latter non-central distribution theory yields local asymptotic power functions for the test and facilities comparisons with alternative procedures due to Dickey&Fuller[14]. The following model is used for the PP test;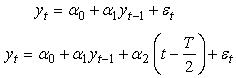 | (4) |
This paper used the method of ADF (Augmented Dickey-Fuller Test) and PP (Phillips Perron test).
4.1.1. GDP Series
Figure 1 shows Gross Domestic Product’s time series graphs and Figure 2 shows Logarithmic and Seasonal Adjustment Gross Domestic Product’s time series graphs.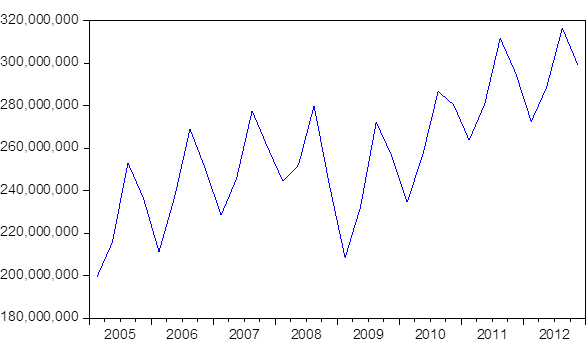 | Figure 1. Gross Domestic Product’s time series graphs |
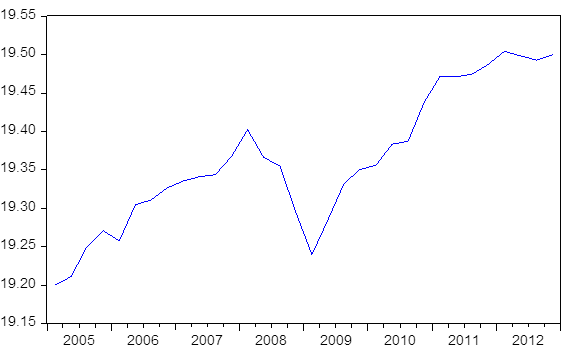 | Figure 2. Logarithmic and Seasonal Adjustment Gross Domestic Product’s time series graphs |
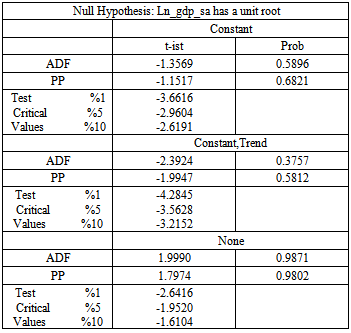
Unit Root Test Result of GDPThe conclusion of the unit root test is shown below in table 1.Table 1. GDP’s stationary tests
 |
| |
|
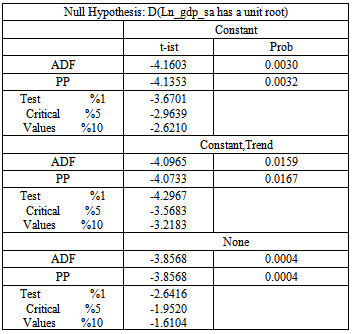
Null Hypothesis is not rejected. GDP series is not stationary. So first differences of this series is shown table 2 ;Table 2. The first differences of GDP’s stationary tests
 |
| |
|
Null Hypothesis is rejected so, first differences of this series are stationary.
4.1.2. Turnover Index of Transportation and Storage (TITS)
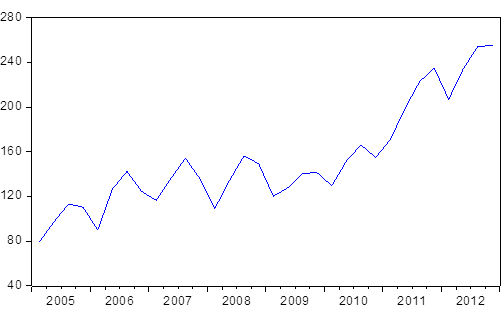 | Figure 3. TITS’s time series graphs |
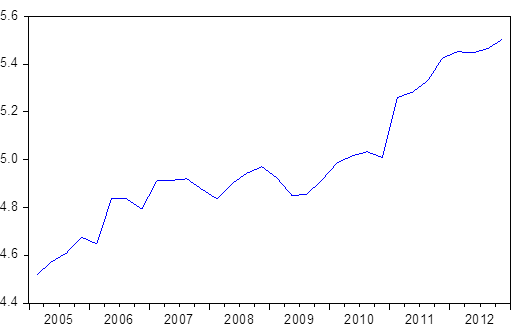 | Figure 4. Logarithmic and Seasonal Adjustment TITS’s time series graphs |
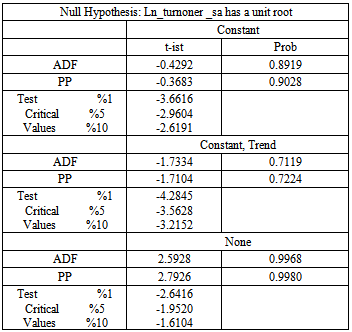
Figure 3 shows Turnover Index of Transportation and Storage’s time series graphs and Figure 4 shows Logarithmic and Seasonal Adjustment Turnover Index of Transportation and Storage’s time series graphs.Unit Root Test Result of TITSThe conclusion of the unit root test is shown below in table 3.Table 3. TITS’s stationary tests
 |
| |
|
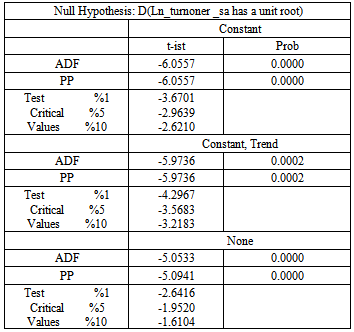
Null Hypothesis is not rejected. GDP series is not stationary. So first differences of this series is shown table 4;Table 4. The first differences of TITS’s stationary tests
 |
| |
|
Null Hypothesis is rejected so, first differences of this series is stationary.These series are stationary at the same degree. We can apply co-integration test between this variables.
4.2. Engle-Granger Cointegration Test
Cointegration is used to describe the long-term stable relationship of the level value of some economic variables. To conduct cointegration, all variables must be stationary with the same degree[15].This paper selected method of Engle-Granger cointegration test because of the number of variables.Cointegration analysis is completed in two steps.Firstly, regression model is established.Then, stability of the error terms are examined.If it is determined that the error term is stationary, we can say two variables are cointegrated1. Step: Regression Model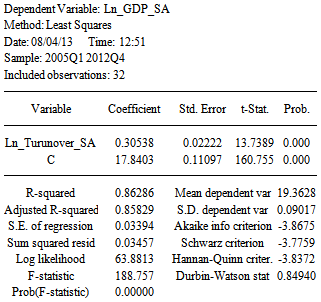 The econometric model:GDP=0.305382TURNOVER+17.84035+et2. Step: The Stationary of Error Term
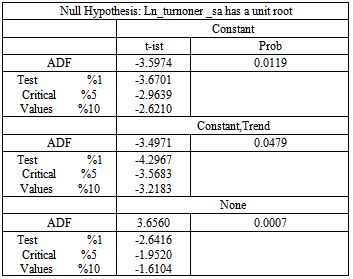
Table 5. Residuals’ stationary test
 |
| |
|
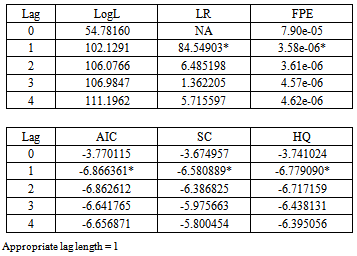
Table 5 shows that the stationary of the error term. And Figure 5 shows that correlogram Q statistics.Figure 6 shows residuals’ graph.Error term of the model is stationary so GDP and Turnover index are cointegrated. Then we choose appropriate lag length to use model criteria for applied the causality test. Table 6 shows that appropriate lag length.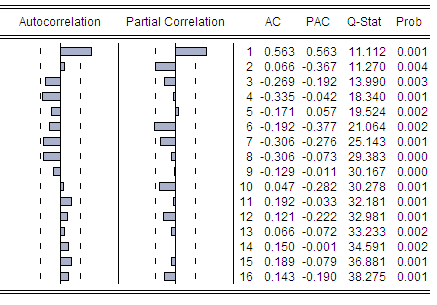 | Figure 5. Correlogram Q statistics |
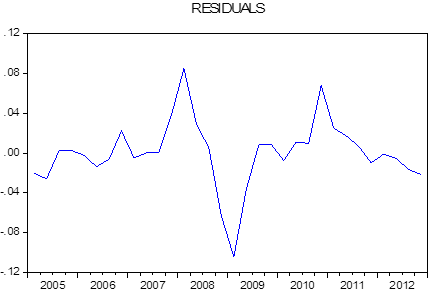 | Figure 6. Residuals’ Graph |
Table 6. Appropriate lag length = 1
 |
| |
|
4.3. Granger Causality Test
Granger Causality Test:Two variables y and x, Granger Causality test requires the following regression is estimated[16]: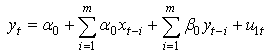 | (5) |
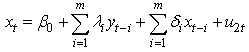 | (6) |
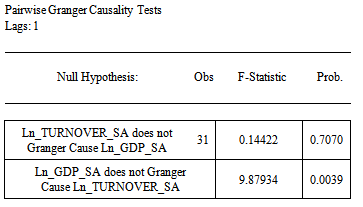
y represent Gross Domestic Product; x represent turnover index of Transportation and Storage. In general, if the x impacted y, that x is a Granger cause of y, and the changes of x must before the changes of y. Therefore, when do the regression analysis of y impacted on the on the other variables, if the past or lagged values of x were encompassed can significantly enhance the explanatory power of regression, which can be considered x is the Granger reason of y. It also set up in turn. The conclusion of the Causality test indicated in table 7.Table 7. Causality Tests
 |
| |
|
Thus, there is one-sided causal relationship from GDP to index of Transportation and Storage.
5. Conclusions
The world, especially in the last 25-30 years, has changed rapidly. Main reason of these changes is the phenomenon of globalization.Logistics industry in our country in recent years is showing developments as a young industry.The result of the econometric analysis shows a long-term relationship between the GDP and turnover index of Transportation and Storage in Turkey. Interpreted the results of the econometric model is established, explanation of GDP, meaningless out turnover index of Transportation and Storage whereas turnover index of Transportation and Storage explaining GDP was effective. So a one unit change in the turnover index of transport and storage of the resulting changes of 30% of GDP and the relationship between them is directly proportional.According to the results of the Granger causality test for model, there is one-sided causal relationship from GDP to index of Transportation and Storage. Increasing economic growth has been achieved in the development of logistics.The results of this study for Turkey are supporting the results of the previous similar studies for other countries. Generally, the economic development of the country has made progress in logistics.Our recommendation, if possible, is to find and examine the long-term data for the same analysis. With using long-term data it can be analyzed in structural breaks. Thus, comparing results with and without considering structural breaks will be possible.
References
| [1] | Bayraktutan, Y. &Tüğlüoğlu, Ş. & Özbilgin M. 2012 “Lojistik Sektöründe Yoğunlaşma Analizi ve Lojistik Gelişmişlik Endeksi: Kocaeli Örneği”, Uluslararası Alanya İşletme Fakültesi Dergisi, C:4, S:3, s. 61-71 |
| [2] | Wang, A. 2010, “Research of Logistics and Regional Economic Growth”, Scientific Research, iBusiness, pp. 395-400. |
| [3] | Yang, S. & Jiangou, Z. 2011, “The Panel Co-integration Analysis between the Logistics Industry and Economics Growth in China”, International Business and Management, Vol. 2. No. 2. Pp. 40-46 |
| [4] | Babacan, M. 2005, “Lojistik Sektörünün Ülkemizdeki Gelişimi ve Rekabet Vizyonu”, İMPY Programı. |
| [5] | Held, D., Mcgrew, A. Goldblatt, D., Perraton, J. (2000). Global transformation: Politics, Economics and Culture. New York: Polity Press&Blackwell Publishers. |
| [6] | Zhang, W. 2002, “The Relationship between the Regional Economic Growth and Logistics”, Logistics Technology, pp.5-7 |
| [7] | Zhong, G. 2003, “Regional Logistics Role in Regional Economic Growth” Beijing University of Technology, Beijing. |
| [8] | Li, Z., Zhang, Y. 2007, “The Study on the Suitability Evaluation of System Regional Logistics”. Logistics Technology, pp.54-56. |
| [9] | Ateş, İ., Işık, E. 2010, “Türkiye’de Lojistik Hizmetlerinin Gelişiminin İhracattaki Büyümeye Etkileri”, Ekonomi Bilimleri Dergisi, Cilt:2. Sayı:1, s. 99-1067 |
| [10] | Navickas, V. Sujeta L. , Vojtovich S. 2011, “Logistics Systems As A Factor Of Country’s Competitiveness”, Economics And Management, pp.231-238 |
| [11] | www.tcmb.gov.tr |
| [12] | Dickey, D.A & Fuller, W.A. 1979, “Distribution of the Estimator for Autoregressive Time Series with a Unit Root Test”, Journal of the American Statistical Association, Volume: 74, Issue: 366, pp. 427-431 |
| [13] | Rubin, H. 1950, “Consistency of Maximum-Likelihood Estimates in the Explosive Case” in Statistical Inference in Dynamic Economic Model, ed. T.C. Koopmans, New York, John-Wiley&Sons |
| [14] | Phillips, P.C.B. & Perron, P. 1988, “Testing for a Unit Root in Time Series Regression”, Biometrica,75, 2, pp.335-46 |
| [15] | Engle, R.F. & Granger, C.W.J, 1987, “Co-Integration and Error Correction: Representation, Estimation, and Testing”, Econometrica, pp. 251-276. |
| [16] | Granger, C.W.J. 1969, “Investigating Causal Relations by Econometric Models and Cross-spectral Methods”, Econometrica, Vol. 37, No. 3 pp. 424-438 |
 Abstract
 Reference
 Full-Text PDF
 Full-text HTML