-
Paper Information
- Paper Submission
-
Journal Information
- About This Journal
- Editorial Board
- Current Issue
- Archive
- Author Guidelines
- Contact Us
Journal of Logistics Management
2013; 2(1): 26-34
doi:10.5923/j.logistics.20130201.04
Correlational Analysis of Distribution Cost and Freight Characteristics of Manufactured Goods (Case Study of Unilever Nigeria Plc)
 Abstract
 Reference
 Full-Text PDF
 Full-text HTML
Geraldine N. Okeudo1, Chikwendu David Uche2
1Department of Transport Management Technology, Federal University of Technology, Owerri
2Department of Transport Management Technology,(logistics option), Federal University of Technology, Owerri
Correspondence to: Geraldine N. Okeudo, Department of Transport Management Technology, Federal University of Technology, Owerri.
| Email: |  |
Copyright © 2012 Scientific & Academic Publishing. All Rights Reserved.
This study determined the relationship and extent between the cost of distribution of the goods manufactured and the quantity of the goods/ weight of the goods in question which inturn create a need for a further research to determine the optimized distribution flow so as to reduce wastage and increase revenue. Data was collected by the administration of questionnaire to a total of 107 respondents of two major plants of Unilever Nigeria Plc in the South East zone of Nigeria. Analysis was carried out on the data collected using a regression and correlation to establish the statistical relationship between the dependent variable (distribution cost) and the independent variables X1 and X2 (weight of the goods and the quantity of the goods) respectively. A positive correlation coefficient(r) value of 0.983 was discovered, indicating a high positive relationship between the variable was discovered. Obviously, an increase in the quantity or weight of the goods must lead to an increased cost of distribution. This prompted a need for the further study in determining an optimal solution to cost of distributution in comparison to quantity/ weight of goods distributed.
Keywords: Warehouse, Physical Distribution System, Network Optimization, Distribution Channel, Physical Flow
Cite this paper: Geraldine N. Okeudo, Chikwendu David Uche, Correlational Analysis of Distribution Cost and Freight Characteristics of Manufactured Goods (Case Study of Unilever Nigeria Plc), Journal of Logistics Management, Vol. 2 No. 1, 2013, pp. 26-34. doi: 10.5923/j.logistics.20130201.04.
Article Outline
1. Introduction
1.1. Background of Study
- In the market and shops of different wholesalers and retailers today, both the end line sellers and the Consumers are confident that goods will always be made available for them to purchase at anytime they desire and rarely enquire how goods find their way into the retailer’s shelves. Only when the customer walks into the shop in need of a particular item that he discovers that the supply of goods is interrupted. We begin to ask ourselves why these goods are not readily available at the time. The distribution inefficiencies or industrial disputes and other variables that contribute to the unavailability of the product becomes glaring and a thing to consider. Most people have little appreciation for the scale and complexity of the distribution system even in the industrial and business circles. Lately, distribution is generally considered to be a major cost centre, an important marketing tool and a determinant of profitability and competitive advantage. The recent sporadic change in logistics integration and intermodal transport has redefined the process of manufacturing and distribution as complementary; “as an unsold product is a waste of resources”. Managerial and conceptual reforms have been accompanied by sweeping changes in physical distribution structure of firms’ distribution systems.
1.2. Production of Goods and Services
- Production is the creation of goods and services, these goods and services can be produced in factories or industries and stored in warehouses. However, production cannot to be said to be complete until the products/services get to end user or consumer. This can be obtained through the distribution process and that complete the production cycle. The distribution activity is equally referred to as physical distribution management (PDM), marketing logistics or physical flow. Physical distribution is the collective term for series of inter-related functions (primarily transportation, stockholding, storage, goods handling and order processing) involved in the physical transfer of finished goods form producer to consumer, directly or through intermediaries.
1.3. Physical Distribution
- Physical distribution explains the problem of getting the right quantity of the right product to the right place at the right time and at the least cost possible, this problem has confronted companies with challenges like meeting delivery due dates and operating an efficient distribution network. Companies like consumer goods companies, with their great diversity of customers spread over vast geographical areas must integrate the systems components of distribution to achieve an acceptable customer service level and avoid reduction of market share[3]. Geographical imposed gap between firms and their potential consumers is bridged by distribution, as physical distribution uses its transportation function to provide time and space utility between these two parties[4]. The continuous increase in the cost of transportation due to poor nature of our roads, high cost of vehicles and spare parts and currently increase in cost of petroleum products poses a serious problem to an effective coverage of territories in the distribution both in rural and urban areas in the country. Distribution is becoming a more imperative issue in company accounts as the cost of transport; warehousing and stockholding were growing relative to the costs of other industrial inputs. Marketing efforts, such as the extension of product lines and penetration of new marketing channels into new markets, were imposing increasing strain on distribution systems, making them more complex to manage and more expensive to operate[31]. Contemporary firms have reorganized their distribution systems to take advantage of the major improvements that was made in the transport and storage infrastructure. The introduction of information management system (IMS) has greatly eased order processing, resource allocation and analysis of distribution cost which has promoted the application of operations research techniques in distribution planning. This paper tries to investigate on ways of reducing cost of physical flow of products and optimize the physical distribution system from distribution centers to wholesalers and retail outlets. With this problem on ground, the study will try to establish the nature and extent of the relationship between distribution cost and volume /weight physical flow of products from the warehouse.
2. Review of Related Literature
- Several researchers have tried to look at optimization of logistics system as a viable mean for reducing the logistics cost in any firm. A recent survey of “over 200” European companies found that logistics costs represent on average, 7.7% of sales revenue [1]. In some sectors, this proportion can be two or three times higher. By improving the productivity of logistics operations it is possible to cut this cost and translate some of the savings into lower prices. Over the past 20 years, the largest saving in logistics costs has accrued from a reduction in inventory levels (relative to sales). This has been achieved by the move to just-in-time response replenishment, the centralization of inventory, the application of new IT systems, and the development of SCM. There have also been substantial improvements in the efficiency of freight transport operations, resulting mainly from the upgrading of transport infrastructure, liberalization of freight markets, and improved vehicle design. Warehousing costs per unit have also declined in real terms as a result economies of scale, increased mechanization, and the diffusion of new computer-based warehouse management systems. The combined effect of these trends has been to reduce the proportion of revenue spent on logistics by European firms by an average of 46% between 1987 and 1999[1].Persson (1991) in his study identified three basic competitive strategies that firms have developed over years through their distribution system.● Strategy 1. Companies use logistics to influence competitive forces by making suppliers or customers more dependent upon them and using heavy investment in a new logistics network to discourage other firms from entering a market sector.● Strategy 2. Companies, using existing resources, develop innovative logistics practices to penetrate new markets or gain competitive advantage in an existing market. The abandonment of fixed depot area boundaries, for instance, and the adoption of multi-depot fleet planning can strengthen a company’s competitiveness in a regional market by simultaneously cutting transport costs and delivery lead times[31].● Strategy 3. Companies aim for across-the-board superiority in logistics by seeking new solutions and system combinations. Such companies tend to regard logistics management as a core competence and key to future success.However, it is possible to distinguish a range of strategic options relating to particular aspects of a logistical system. These are more clearly identifiable and measurable. A good example is the choice that companies must make between a postponement and a speculation strategy (Van Hoek et al., 1998). The geographical form of deferment involves centralizing inventory and delaying its dispatch to local markets until an accurate estimate of the likely demand can be made. Speculation, on the other hand, entails dispersing inventory to local markets in the belief that you will be better able to respond to short-term increases in demand. These contrasting strategies have been examined in detail and practical tools developed to help firms determine under what circumstances they are appropriate.
3. Methodology
- In sourcing for relevant information for this research, the primary data and secondary data were sourced from respondents by the administration of questionnaires to the respondents, personal observations of various geographical locations. The questions were structured for easy understandings by the respondents to enable them give the appropriate responses. The secondary data source of information in this study was the review of internal databases so as to get the required information on SKU history, sales out and stock received. The time span of all the data generated from the internal databases was six months. The major problem encountered, were the data descriptions in the database that did not use conventional descriptions for security reasons; the researcher had to reorganize the data descriptions for better understanding.
3.1. Sampling
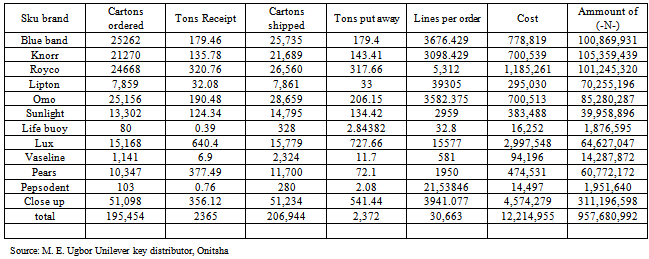
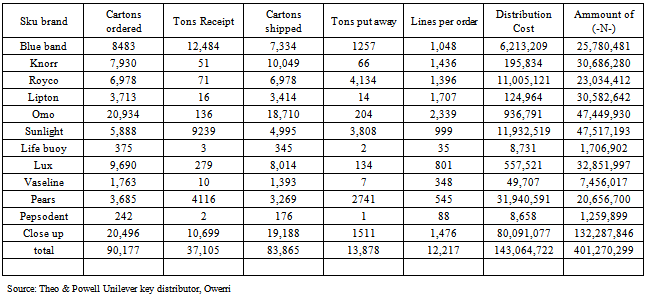
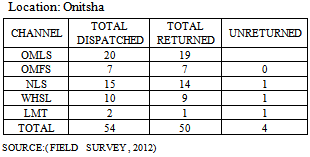
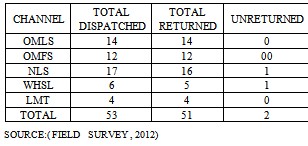
- The sampling frame of the research consists of a very large population which consists of all warehouse and Unilever retailers in South-east, Nigeria. A total of 107 questionnaires were dispatched to the retailers in the two locations selected. A total of 101 questionnaires were returned 50 from Onitsha location and 51 form Owerri location. The samples in this research were based on non-probability samples, but this has little connection to the use of purposive sampling. Instead, this reliance on the use non-probability samples is due to the difficulty of locating data sources that meet eligibility criteria and counting the total size of the population from which that sample is drawn. In addition, the need to collect detailed, in-depth data typically leads to small sample sizes where there would be no point to doing statistical analysis Onitsha and Owerri locations were the samples chosen from the South-east[21] population. The reason was to reduce the cost of research yet achieving a reasonable research data accuracy and reliability of research results.The analysis was carried out in two stages:Stage 1 focuses on the warehouse itself as the point origin in the physical distribution system. The aim is to ensure that the warehouse operates in a way that will facilitate the optimization strategies used in the whole system.Stage 2 is aimed at using regression to determine the nature and extent of relationship between distribution cost and physical flow which is measured in quantity shipped and weight of the shipment.
4. Analysis of Data/Findings
- Three statistical tools used to analyze the data collected in order to achieve a platform for optimizing the distribution system were; warehouse activity profiling, regression analysis (
 ) and network optimization.
4.1. Warehousing Activity Profiling
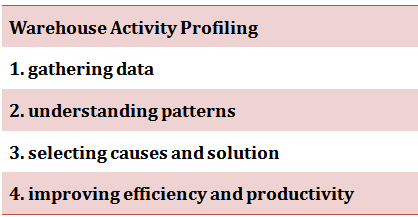 | Figure 1. Warehouse Activity Profiling system |
|
|
|
|
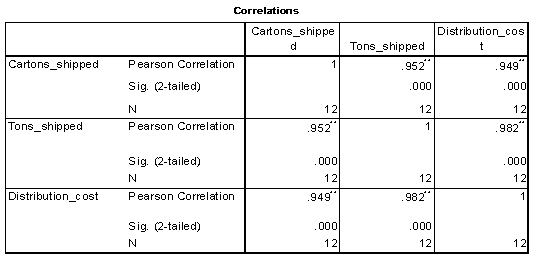
4.2. Regression and Correlation Analysis of Distribution Cost Against Tons Moved and Cartons Shipped
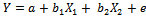
- In determining this relationship between distribution cost against tons moved and cartons ship. A multiple regression equation was introduced to explain the influence cartons shipped and tons moved have on the distribution cost.Below is the multiple regression equation that was developed to define the relationship.
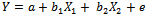 | (4.0) |
 ) and quantity shipped (
 ) which are the independent variables respectively. This study will be using regression and correlation analysis to ascertain that fact and used SPSS to show the relationships and dependability of the regression analysis.The condition known as multicollinearity develops that can be extremely problematic; this can lead to misleading and/or inaccurate results. In other words, multi co linearity occurs when two or more predictors contain much of the same information. To solve this problem the researcher did a natural logarithmic transformation (i.e. change the numbers to natural log) to handle the problem of multicollinearity [21].
|

|
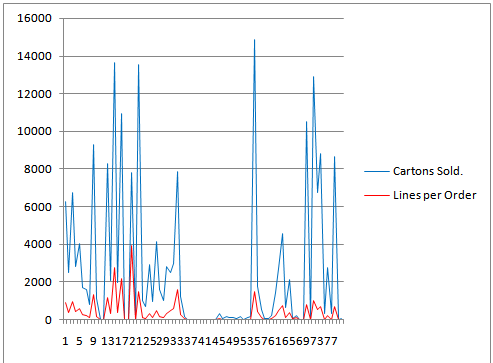 | Figure 2. sales activity trend showing the lines per order and cartons shipped |
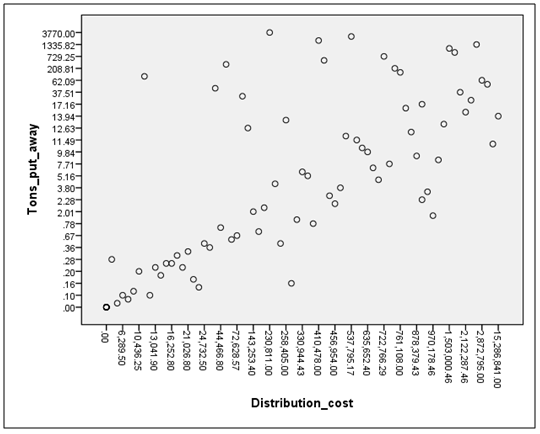 | Figure 3. A scatter plot diagram showing relationship between tons shipped and distribution cost |
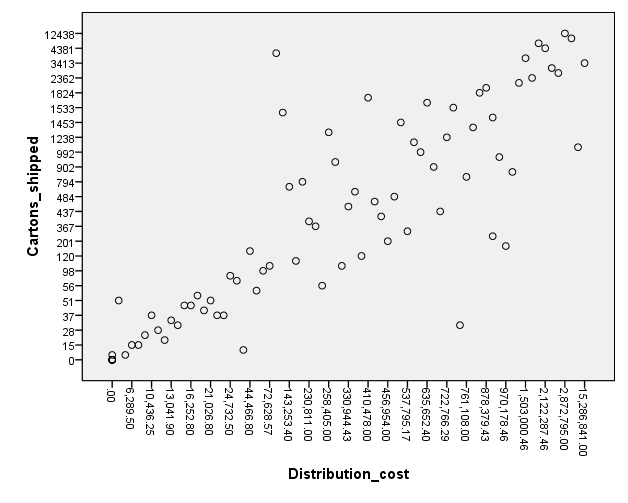 | Figure 4. A scatter plot diagram showing relationship between cartons shipped and distribution cost |
|
|
|
|
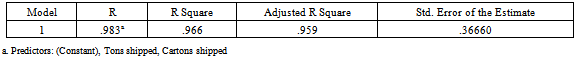
 is 96.6% means that close to 97% of the variation in the dependent variable (distribution cost) is explained by the independent variables. Adjusted
 measures the proportion of the variance in the dependent variable that was explained by variations in the independent variables. In this research the Adjusted
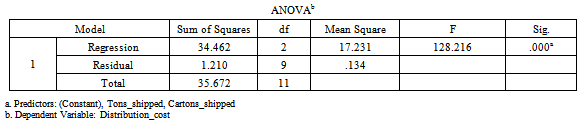
 shows that 95.9% of that variance was explained. The standard error of the estimate is 0.3667, which is an estimate of the variation of the observed distribution costs, in Naira terms, about the regression line. Standard error of the estimate which measures the dispersion of the dependent variables estimate around its mean is below 10% which indicates that the variations were normal.Table 9 shows the results from the combination of these variables which significantly (p < .001) predicts the dependent variable as its value is below the 0.05. The F-statistic is calculated using the ratio of the mean square regression (MS Regression) to the mean square residual (MS Residual). This is statistic can then is compared with the critical F value for 2 and 9 degrees of freedom (available from an F-table) to test the null hypothesis:
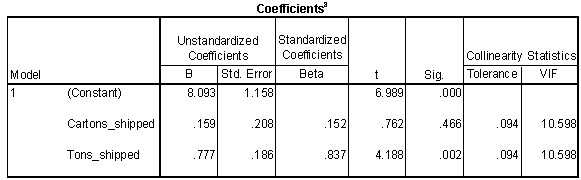
 The p-value associated with the calculated F-statistic is probability beyond the calculated value. Comparing the above value indicates a rejection of the null hypothesis.Table10. indicates that tons shipped, is contributing to the equation more than cartons shipped. However, all of the variables need to be included to obtain this result, since the overall F value was computed with all the variables in the equation. Tolerance and VIF give the same information that explains multicollinearity problems in the data where
 . If the Tolerance value is low (
 ), then there is probably a problem with multicollinearity. In this case, since adjusted
  is 0.966, and
  is about 0.034, then tolerance value of 0.94 is above the 0.034 and then the data is considered to be free from problems of multicollinearity. Form the regression analysis above, the resultant solution developed a mathematical representation of the relationship below.
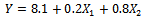
5. Conclusions
- This study explains the relationship between the various determinants (distance, cost,) of an optimized physical distribution system of goods in manufacturing firms. For an optimal physical distribution system to be fully implemented the operations at the source which is the warehouse has to assessed so as to discover the areas of setbacks and wastages and this area has to be given proper attention. The nature and extent of the relationship between flow and weight of products in of the warehouse with the cost of distribution to move products from the warehouse to where they are needed was ascertained and it was clearly discovered there exist a strong positive correlation between the weight of the goods shipped, the volume / quantity of the goods and the distribution cost. Explained thus: an increase in the volume of the goods to be shipped from point A to point B will result in a corresponding increase in the cost of distribution. Also the increase in the quantity of the goods shipped will also result in and increased distribution cost. Therefore it is very important for organizations to find strategies for reducing the distribution cost despite the enormous quantity and weight of the goods transported.
5.1. Suggestion for Further Study
- It can be observed from the study that there is need for further research to determine the possible ways to reduce the cost of distribution despite the various volume and weight of goods transported. Further study should be carried out to determine the optimal cost of distribution.