-
Paper Information
- Previous Paper
- Paper Submission
-
Journal Information
- About This Journal
- Editorial Board
- Current Issue
- Archive
- Author Guidelines
- Contact Us
Journal of Logistics Management
2013; 2(1): 15-25
doi:10.5923/j.logistics.20130201.03
Competitiveness of Small- and Medium Enterprises of the Arizona Aerospace and Defense Supply Chain
 Abstract
 Reference
 Full-Text PDF
 Full-text HTML
Gary R. Waissi, Jane E. Humble, Mustafa Demir
College of Technology and Innovation, Arizona State University, Mesa, Arizona 85208, USA
Correspondence to: Gary R. Waissi, College of Technology and Innovation, Arizona State University, Mesa, Arizona 85208, USA.
| Email: |  |
Copyright © 2012 Scientific & Academic Publishing. All Rights Reserved.
This paper discusses the development of a database and an interactive data visualization of Arizona aerospace and defense suppliers. The paper also summarizes key results of a survey of those companies focusing on their strategic competitiveness and next generation manufacturing (NGM) readiness.The survey categories included: company demographics, supply chain management, global engagement, sustainability and green, process improvement, and innovation. Development of the database andselected key findings of the survey are reported. To summarize: Arizona aerospace and defense companystrengths include: Product portfolio and product diversity; Frequency and scale of process and system improvements; Balance of revenue sources between private- and public; Balance of customers between military and commercial. Weaknesses include: Strategic planning and strategic plan implementation; Utilization of lean manufacturing techniques; Underperformance in on-time delivery of products and services; Automation; Certifications; Global engagement; Interest toward, and knowledge of, strategy for global, sustainability and green, as well as innovation. We believe that the database and findings will, whilerepresenting a snapshot only, add to the knowledge base relating to NGM readiness of the aerospace- and defense companies in the United States, as well as provide new information about the competitiveness of small- and medium aerospace- and defense suppliers.
Keywords: Aerospace, Defense Supply Chain, SME Competitiveness, Next Generation Manufacturing, Arizona Aerospace, Defense Company Database, Database Visualization, Company Size Classification
Cite this paper: Gary R. Waissi, Jane E. Humble, Mustafa Demir, Competitiveness of Small- and Medium Enterprises of the Arizona Aerospace and Defense Supply Chain, Journal of Logistics Management, Vol. 2 No. 1, 2013, pp. 15-25. doi: 10.5923/j.logistics.20130201.03.
Article Outline
1. Introduction
- The aerospace and defense industry of Arizona consists of companies, both original equipment manufacturers (OEM) and suppliers, in a variety of key strategic manufacturing sectors. The industry is considered a source of innovation, an incubator of advanced technologies, and a generator of highly specialized jobs. The competitiveness of aerospace and defense companies for the global competitiveness of the United States is considered strategically critically important. The industry already serves, and can serve even in a more strategic way, as an engine for product- and process innovation, as well as can help other manufacturing industries to become more competitive globally. This, however, requires strategic attention to this industry sector by policymakers and policy implementers at both the Federal- and the State levels.The State of Arizona has one of the well-established and growing aerospace and defense manufacturing clusters in the United States. According to the report “Aerospace & Defense in Arizona: A Sector Profile” the aerospace and defense industry is Arizona’s most active and fastest growing industry,[1]. Other significant aerospace clusters are located in California, Connecticut, Ohio, Kansas, Texas, Virginia and Washington, see e.g.[2]. Already in 1988 Arizona was reported[3] as having several highly specialized clusters such as helicopters, semiconductors, electronic testing labs and optics. This paper (based on[4]) summarizes the development of the database and the data visualization, discusses key findings of selected sections of the survey. Strengths, weaknesses and opportunities are identified for a new strategy framework for SMEs relating to supply chain management, global engagement, innovation, product-, and process improvement, and the resulting competitiveness of a company. The study was divided into three phases. In the first phase a database, and an online interactive data visualization, of aerospace and defense companies were built. In the second phase the companies were surveyed to gain understanding of their Next Generation Manufacturing (NGM) competencies, including their role and relations in the supply chain, management of the supply chain, level and extent of global engagement (export, import, partnerships, joint ventures), strategic consideration and adoption of concepts of “sustainability” and “green”, implementation of concepts of process improvement, and strategic role of innovation in the company. In the third phase and based on the survey results, a list of strategic strengths, weaknesses and opportunities for the industry cluster are identified. The NGM within the above context, as stated in[5], includes that the manufacturing company of the 21st century will have to be able to “respond quickly to customer needs by rapidly producing customized, inexpensive, and high-quality products”. This will require agility, ability quickly to adapt to changing conditions, as well as strategic leadership and “highly-motivated and skilled knowledge workers”. The NSF report further states that, the next generation companies will have to function as “participants in extended enterprises”, and in order to add value, “will only undertake that part of the manufacturing process that they can do better than others”.Currently, the database consists of 1,311 aerospace and defense companies, including original equipment manufacturers (OEMs) and suppliers. In addition, the database includes 71 airports-, airfields, and US Air Force bases located in Arizona.
2. The Database
2.1. Data Categories, Sources, Database Visualization
- The first phase of the study consisted of building the database of aerospace and defense companies with operations in Arizona, as well as identifying major research organizations, airports and US Air Force bases. The data sources included the following: Department of Commerce of the State of Arizona, (ACA), Arizona Manufacturing Extension Partnership (Arizona MEP), Dunn & Bradstreet Million Dollar Database (D&B), Mint Global (Bureau Van Dijk) (BvD), ReferenceUSA, Arizona Corporation Commission (ACC), Central Contractor Registration System (CCR), Arizona State University libraries, public libraries, and company websites. Seven information and data categories were considered. These included: company/organization identification numbers, location and contact information, organization size metrics, business demographics, industry category, key executives and parent company information. Each main category was further divided into subcategories as shown in Figure 1. Figure 2 shows an example of the interactive data visualization of the Arizona aerospace and defense company database. Currently, data relating to 120 variables is included. Information about the suppliers can be searched using pre-defined pull-down menus as well as using key words. The database and visualization (Figure 2) can be accessed at http://129.219.40.44/adsr/Supplychain/SCDefault.aspx.
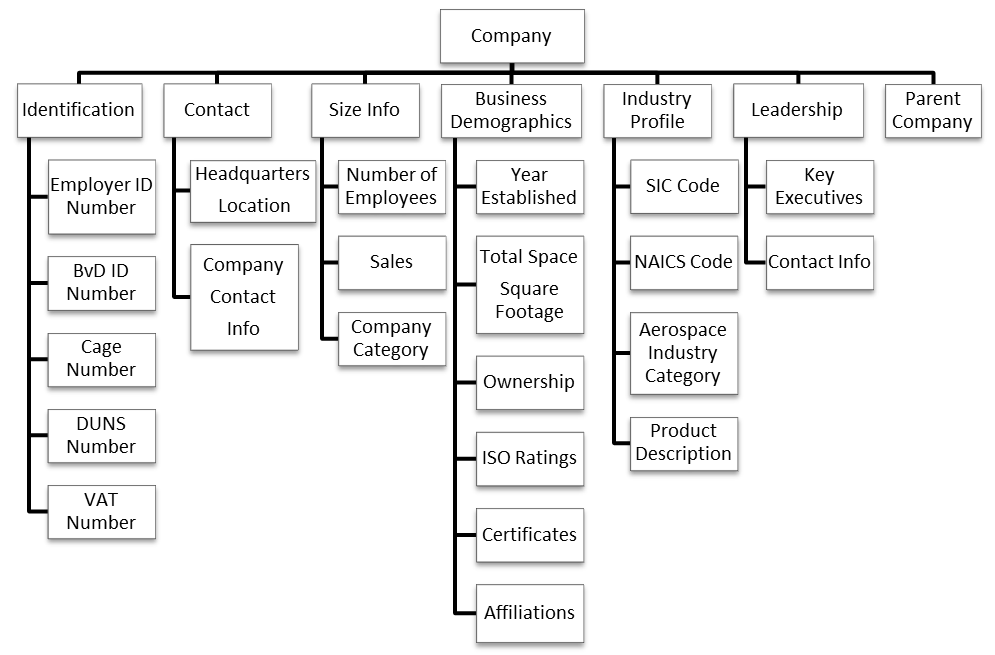 | Figure 1. Database Information Categories |
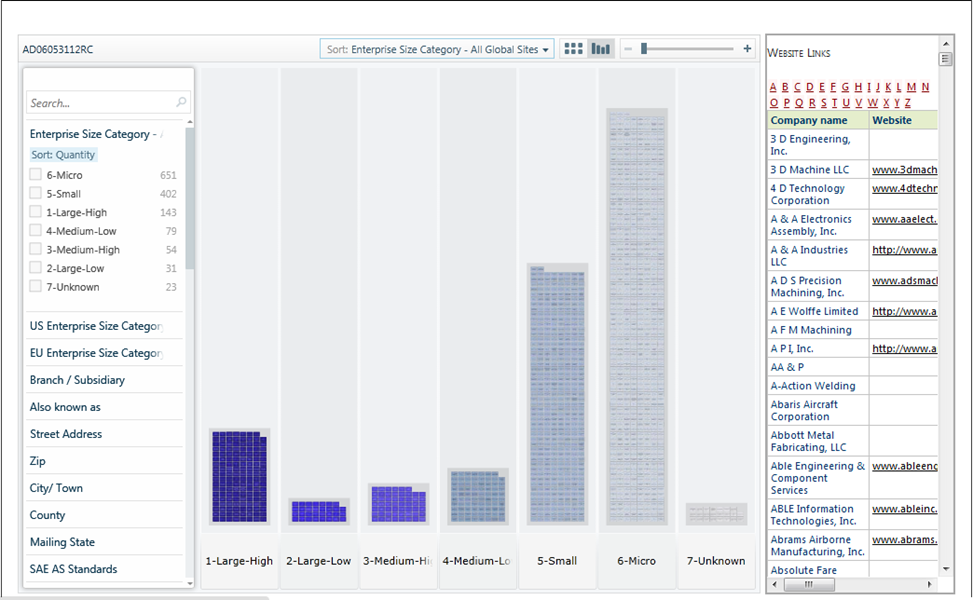 | Figure 2. Example – Interactive Online Data Visualization of the Arizona A&D Supplier Database |
3. Company Size Classification
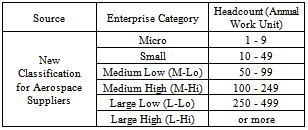
- As most of the companies of this study were small- to medium enterprises (SMEs) with fewer than 500 employees it was considered that the U.S. enterprise classification with two size categories and the European Union enterprise classification with four size categories did not provide for sufficient level of detail. Therefore, a new size classification consisting of six size categories was developed. Table 1 shows the redefined company size classification.
|
4. Literature Review
- This study is directed toward attempting to find ways to help small and medium sized suppliers to strategically improve their competitiveness. It is believed that if the SMEs understand their role in the supply chain, identify their own strategic strengths and weaknesses, identify strategic areas of importance, allocate their resources better, they will be better able to take advantage of their role in the supply chain, and thereby will improve their competitiveness.
4.1. On Supply Chain Management
- The authors in[6] define supply chain management as encompassing “every effort involved in producing and delivering a final product from the supplier’s supplier to the customer’s customer”. Consequently, in particular for manufacturing companies, these efforts, through better utilization of information and information technology, include integration of “demand management, inventory management, production scheduling, and production resources”[6]. In[7] it is stated that supply chain management (SCM), or “linking various programs together into a single integrated concept, is the key for long term competitive advantage”. The authors further emphasize the importance of including suppliers into the long-range strategic planning efforts of the company for the purpose of increased information sharing and increased value-added collaboration.
4.2. On Competitiveness
- Thestudy[8] proposes a theory of strategy for the relationship between the competitive success of a firm, firm behavior, environmental circumstances and market outcomes. The study suggests that a firm’s success is a function of both external- and internal influence. Within such a framework, “sustainability” and “green”, can be seen both as external- and internal. On one hand companies face stricter regulations (environmental impact: pollution, emissions, waste, use of raw materials), and on the other hand, companies are expected to be more environmentally responsible. Several studies, among other[9] and[10], report that companies are either expected or required to be more environmentally responsible with their production and processes, because of regulatory requirements, product stewardship, public image, potential to expand customer base as well as for achieving and sustaining a competitive advantage. Among the issues of intense discussion, trade-off analyses, and debate are: pollution prevention to reduce emissions; product design, material selection, and production process design and implementation to minimize the environmental impact; as well as pollution control to adopt and implement methods “to trap, store, treat and dispose emissions and waste”. In addition, and in order for a company to be able to innovate certain competencies must be present. The author in[11] discusses new product development and related strategic competencies. The author divides the new product development strategic competency into two sub-competencies of operational competence and relational competence. Here “operational competencies” consist of process-, design-, manufacture- and delivery competencies, while “relational competencies” include “communication, interaction, problem solving and relationship management”.One of the approaches for achieving competitive advantage is to resort to creativity of employees of the company. In[12] it is emphasized that “when employees perform creatively, they suggest novel and useful products, ideas, or procedures that provide an organization with important raw material for subsequent development and possible implementation”[12].In[13] and[14] it is stated that strategic priorities of companies include “fast and dependable delivery”, “high and consistent product-, and product design, quality”, as well as “product variety”. According to[14] the size of the company can be a source for competitive advantage, and can “increase the probability of a firm achieving and sustaining strong performance”.The Just-in-time (JIT) concept, as a supply chain management strategy, focuses on safety stock- and buffer inventory reduction, and thereby, on total inventory (holding) cost reduction. In[15] it is reported that when the company size increases, the importance of management of Just-in-Time (JIT) deliveries increases. The article[16] emphasizes the importance of “lead time reduction” as one of the metrics to help improve the “demand performance” of a company. A related earlier article[17]concludes, among other, that “effective inventory management” significantly improves the internal agility of a company.
4.3. On Global Engagement
- According to[18] “global engagement involves creating a business advantage through people, partnership and systems that can open doors to global markets, talent and resources”.According to[19] global engagement “positively affects company growth as a performance dimension”, and positively impact their production and processes. In[20] it is reported that global engagement activities have to be considered “important in the company’s long-term strategy and competitiveness”. Summarily, the referenced literature concludes that globally engaged companies gain more from a global network of information and operations when compared to companies without global activities.
4.4. On Innovation, Product and Process Development
- Among the aligned definitions for innovation and within the context of aerospace and defense industry we consider innovation to consist of the creation of better or more effective processes, technologies or products. In manufacturing industry innovation is defined in[20] as the “application of new or different approaches, methods or technologies resulting in improved quality or reduced cost relative to competition”.The case study[22] concluded that companies are under “pressure to maintain high production standards and efficient production processes”.
4.5. On Automation
- As reported, for example in[23], increasing the level of automation reduces manufacturing, assembly, packaging, inventory and storage, as well as inspection and testing costs, and, thereby, improves the effectiveness of an organization.Summarily, it can be concluded from the literature review, that there appear to be relationships between how well and how strategically a company manages their supply chain relationships, whether a company is globally engaged, involved in innovation, product-, and process improvement in a strategic and systematic way, and the resulting competitiveness of the company.
5. The Survey
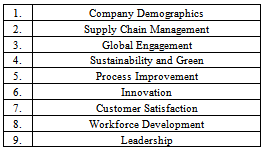
- The pilot survey was modelled after survey as reported in[24],[25]. However, the survey of this study, even though the question categories are similar, is uniquely different from the referenced Wisconsin NGM study. Table 2 summarizes the areas of interest. This paper reports on the first six topic areas: company demographics; supply chain management; global engagement; sustainability and green; process improvement; and innovation. The last three areas of the survey (customer satisfaction; workforce development; and leadership) are not further discussed in this paper.
|
6. Summary of Findings
6.1. Company Demographics
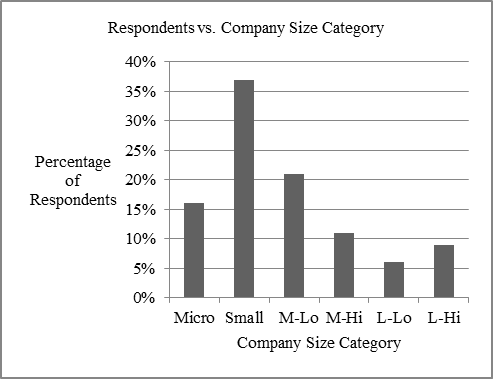
- Arizona Aerospace and Defense Company Profile – The average respondent firm is an Arizona based aerospace and defense supplier. The company has fewer than 100 employees with a total revenue ranging between $500k and $25 million. The primary activity of the company is in aerospace- and defense systems and components, most commonly in one or more of the following: electrical/electronics, airframes, avionics, instruments, control systems, engines, and various related components. The company is located in either the Phoenix metropolitan area (Maricopa County) or the Tucson Metropolitan area (Pima County). These two metro areas include 92 percent of all survey respondents.Company Size – As shown in Figure 3, the largest group (37 percent) of respondent companies are “Small” companies with 10 to 49 employees. Cumulatively, 85 percent of the respondent companies have fewer than 250 employees. Based on findings from the literature, and as the suppliers are mostly SMEs, “company size” is not likely to provide for a strategic advantage.
 | Figure 3. Percentage of Respondent Companies in a Size Category |
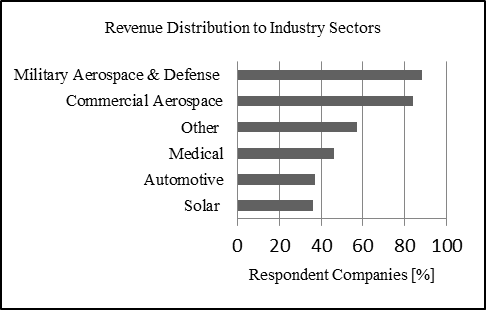 | Figure 4. Distribution of Revenue from Various Industry Sectors |
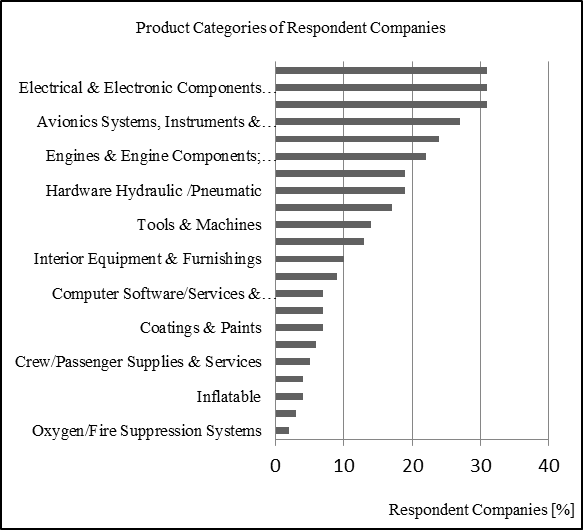 | Figure 5. Product categories of the companies during the past 5 years |
6.2. The Aerospace and Defense Supply Chain
- In this study, and from the NGM perspective, we were interested in the following basic supply chain related questions: total number of suppliers for “direct materials”; number of “key suppliers for direct materials”; types of customers; importance of Just-in-Time (JIT)- and inventory management; on-time delivery to customers; involvement of suppliers and customers in the company’s product development process; and suppliers involvement in the company’s strategic planning effort.
6.2.1. The Number of Suppliers and the Number of Key Suppliers
- A significant 38 percent of respondents indicated having at least 50 suppliers, while at the same time 35 percent of respondents indicate having from five to nine key suppliers.
6.2.2. Types of Customers
- Majority, 58 percent, of respondents reported having mixed government and private customers, while 38 percent reported private customers only, and four percent government customers only. The data show that when the company size increases the company customers become more diversified between the private- and government sectors. The split between “private sector” only clients and “mixed government and private sector” is about even for all company size categories except for the two largest company size categories.
6.2.3. Just-in-Time (JIT)- and Inventory Management
- The rating of importance of JIT by respondent companies was surprising, a somewhat uniform distribution across all response categories from “not important” to “highly important”. Only 26 percent of all respondents considered JIT “highly important”. Nearly half of the largest companies considered JIT “highly important”. These results support the findings reported by[15], 2001. However, when considering a broader concept of “inventory management” the majority of respondents rated this as “highly important”.
6.2.4. On-time Delivery to Customers
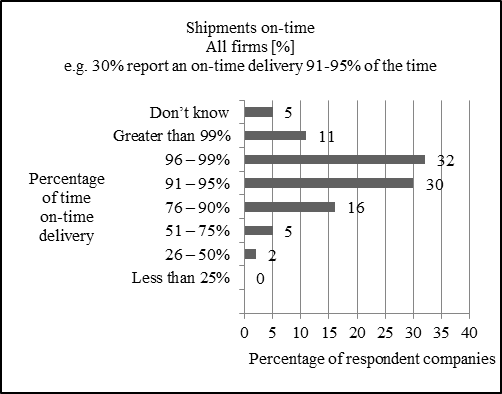
- As any shipment delay will affect each subsequent phase of the supply chain, and thereby affect final product or project completion, competitiveness of a company will depend on its ability to manage its own production and shipment schedule. On a question, about what percentage of time shipments to customers are actually on-time, cumulatively 73 percent of respondents exceed 90 percent on-time delivery percentage, and 11 percent of companies exceed 99 percent. These results are summarized in Figure 6. As the lower end of the distribution suggests, there appears to be room for significant improvement of on-time delivery performance in the supply chain. “On-time delivery to customers” appears to be a strategic weakness for a significant number of the cluster companies.
 | Figure 6. Percentage of time shipments to customers are on-time |
6.2.5. Customer or Supplier Involvement in the Product Development Process and Strategic Planning
- With respect to product development, a majority of respondent companies (59 percent) indicated involving their suppliers, or customers, or both, in their product development process. A significant percentage (41) reported including both suppliers and customers in their product development efforts. This level of participation appeared to be relatively uniform across all company size categories. In terms of strategic planning, a significant majority (62 percent) of respondents indicated including suppliers into their strategic planning process, while 31 percent do not. Customer and supplier involvement in “product development” and in strategic planning appeared to form an area of strategic weakness in the supply chain.
6.3. Global Engagement
- Our goal was to gain a better understanding of the level of global engagement of Arizona aerospace and defense companies. Such a global engagement could consist of, among other, exports, imports, global strategic partnerships, global facilities, or other formal activities of the company beyond the borders of the United States. The particular focus included the following: global profile of the company; exports or imports; customer- and supplier location; and global strategy and global expansion. The most frequently reported global activities are “export”, “import” and “strategic partnerships”. Relatively, these activities are dominated by the largest companies. In terms of company size, the data show that 70 percent of the largest companies report having global strategic partnerships, 60 percent export, while 10 percent report having no global activities. A similar global engagement distribution with respect to exports and strategic partnerships, as with the largest companies, was also reported by the medium-sized companies. This somewhat supports the findings, for example, by MacPherson (2000) and Kalafsky and MacPherson (2002), who found that there is a positive correlation between export and company size,[26],[27]. However, the findings of this study are not strong with respect to correlation between exports and company size. When analyzing the export activity distribution across company sizes we found that nearly 40 percent of firms did not report any revenue from exports. For only two percent of the suppliers export revenue exceeded 75 percent. It should also be noted that, in terms of company size and level of revenue from exports, the distribution was somewhat even across company size categories with the “Small” companies slightly leading both “no export” and “some export revenue”- categories.
6.3.1. Supplier and Customer Location
- The data show that the inter-Arizona supply chain appears to be quite strong as a clear majority of 62 percent of the survey respondents reported having their customers in Arizona. The distribution appears nearly uniform across company sizes except for the largest companies reporting only 30 percent of their customers in the State. In addition, 33 percent of the companies disclosed having customers in Europe and 28 percent reported customers in Asia. These customer location regions are led by the medium- sized companies. From this single perspective one could hypothesize that these companies appear to have a broader customer portfolio, be more export oriented, and therefore appear to be relatively more sustainable. In terms of supplier location, only 20 percent of respondents report suppliers in Europe, and 17 percent report suppliers in Asia. For the largest companies these percentages are significantly higher (30 percent each respectively) suggesting a relatively higher level of global engagement than the overall sample.
6.3.2. Global Expansion
- It was somewhat surprising that nearly half of the respondents reported having “no global strategy”. When considering company size, an overwhelming majority of “Micro”- (82 percent) and “Small” companies (64 percent) do not have global expansion plans, while only 30 percent of the largest companies report having “no global expansion plans”. On-going global expansion was reported by 30 percent of the “Large-High”- and “Medium-High”-sized companies.
6.4. Sustainability and Green
- Our interest was to investigate only the basic sustainability and green related topics, as follows: whether a company had a green enterprise strategy in place; what the leading, most frequently used, green initiatives were; as well as whether companies experienced financial benefits from those initiatives.
6.4.1. Green Enterprise Strategy
- A significant majority 61 percent of respondent companies reported having no “green strategy”, while 17 percent reported that a strategy was under development. It is somewhat surprising that up to 50 percent of the largest companies do not have a green enterprise strategy. The green enterprise concepts are covered within the environmental management certification (ISO 14001), and a significant majority of companies did not report having ISO 14001 certifications.
6.4.2. Green Initiatives
- The leading green initiative, reported by 55 percent of respondents, was “waste recycling”, followed by “energy conservation“, and “water conservation”. However, most companies possessing a green strategy do not have metrics to measure the benefits of those initiatives. The most commonly used metric was “dollars saved”. Emissions or “carbon footprint”, and efficiency ranked low on the perceived benefits. Most commonly “lack of resources” and “lack of knowledge” were considered as barriers for adoption and implementation of green strategies. Figure 7 summarizes the use of leading green initiatives by respondent companies.The data also show that 37 percent of respondents reported “financial benefit from the green initiatives”, while 39 percent believed that there was no such benefit. This result appears to support an earlier finding presented in[9], where limited and inconclusive relationship between “green” practices and financial outcomes were reported.The data also show that 37 percent of respondents reported “financial benefit from the green initiatives”, while 39 percent believed that there was no such benefit. This result also appears to support an earlier finding of[9] reporting limited and inconclusive relationship between “green” practices and financial outcomes.
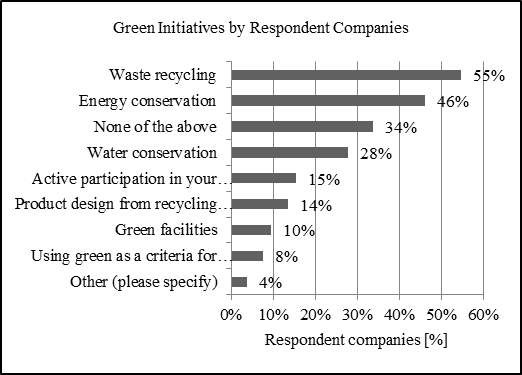 | Figure 7. Green initiatives of your company |
6.5. Production and Process Improvement
- Competitive pressures force companies to develop and implement continuous process- and product innovation programs, as well as engage in entrepreneurial risk-taking within and for the company to stay in business or to gain a competitive advantage. On one hand, new and innovative products and processes may help create a competitive advantage for a company. On the other hand, new product development, new process development and adoption, may require large up-front investments into new technology and therefore include risk. The question then becomes trade-off between risk and reward. Within production- and process improvement our interests included the following areas: production processes and changes; reasons for change; process improvement programs and their impact; process improvement systems; level of automation; and certifications.
6.5.1. Production Processes and Major Changes
- Of the respondents 81 percent disclosed having carried out major changes in their operations during the past five years. Most frequently changes related to improvements in information technology (by 84 percent of respondents), equipment acquisitions (81 percent), machinery upgrades (71 percent), as well as improved implementations of quality- and other types of monitoring systems (52 percent). It should be noted that significant changes were reported in all company size categories.
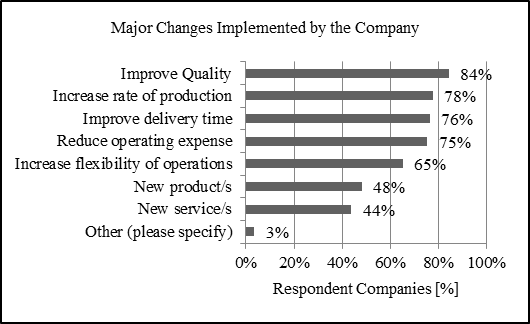
6.5.2. Reasons for Process Changes and Their Perceived Impact
- As reasons for making changes 84 percent of respondents reported wanting to “improve quality”. This was followedclosely by goals to “increase production rate” (reported by 78 percent), “improve delivery time” (76 percent), and to “reduce operating expenses” (75 percent). “New products” and “new services” were reported as reasons for making changes by 48 percent and 44 percent of the respondents respectively. These results are summarized in Figure 8.
 | Figure 8. Reasons for major changes during the past five years |
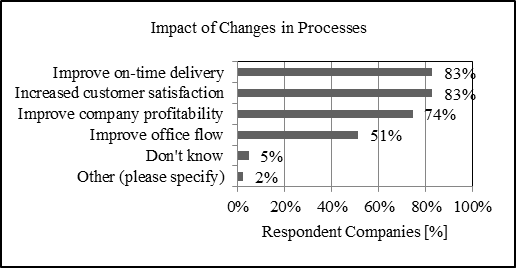 | Figure 9. Impact of process changes |
6.5.3. Process Improvement Programs and Types of Programs
- While it is not surprising that a significant percentage (35 percent) of the “Micro” companies have no process improvement programs, it is surprising that significant percentage of larger companies do not have such programs. The data show this area as a strategic weakness.
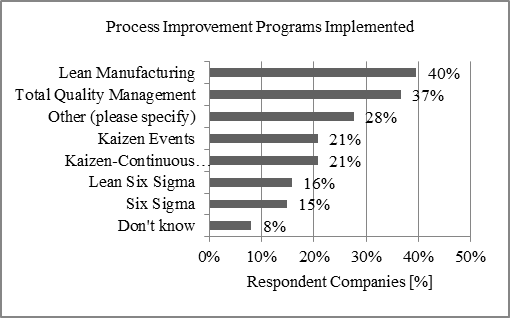 | Figure 10. Types of Process Improvement Programs Implemented by the Respondent |
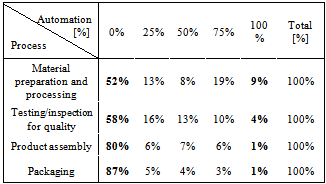
6.5.4. Automation
- However and in particular, with respect to the aerospace and defense SMEs one might hypothesize that automation may not bring significant savings, because, for example, the production runs are small, and the overall scope and scale of activities are still below either a “perceived” or real automation threshold. This means that a company may not be ready, or is unable, to invest into production- and process automation.We investigated two facets of automation: use of CAD or CAM, or CAD/CAM; as well as whether a company had broader, more extensive, automation implementations in their production, materials handling, packaging, and testing. It was founds that CAD, CAM or CAD/CAM (Computer Aided Design and/or Computer Aided Manufacturing) are utilized by 81 percent of the respondent companies. With respect to broader automation implementations, the following four areas were considered: material preparation and processing; testing/ inspection; product assembly; and packaging. Each of these areas was divided into five “levels of automation” as follows: zero percent indicating no automation (all work done manually); 25 percent (50 percent, 75 percent) indicating the percentage of work having been automated in a category respectively, and 100 percent indicating full automation.
|
6.5.5. Certifications
- Another area of interest, a measure of quality and in some cases a requirement, was to determine formal certifications of a company. Generally, a certification may either be required, or if not required, can serve as an effective quality management tool for the company. There are many standards for the aerospace industry, such as ISO 9100 for quality management, ISO 14000 for environmental management, etc.. In the survey we offered the most common certifications, ISO 9001, ISO 14001, AS 9100 as choices, and asked the respondent to list other certification of their company. It was somewhat surprising, when considering the highly competitive aerospace and defense industry, that 20 percent of the respondents indicated having no certifications. It was, however, expected and confirmed by the results, that as the company size increased the percentage of companies with certifications increased.
6.6. Innovation
- Within the scope of this study, a further goal was to determine whether, and to what extent, a company, of the Arizona aerospace and defense cluster, embraces innovation; how innovation is communicated within the company; whether and how innovative ideas are captured; and whether there is a strategic focus on innovation within the company as demonstrated, for example, by a dedicated budget allocation.
6.6.1. Communication
- The data show that 48 percent of respondents reported “frequently communicating about the importance of innovation”, and 32 percent reported expecting “innovation of every employee”. Innovation was not considered a strategic priority by 24 percent of the respondents.
6.6.2. Investment in Innovation
- The data also show that as the company size increases the company is more likely to invest in innovation. Companies investing in innovation do so in a modest way. A slight majority of respondent companies invested up to five percent of their sales revenue into new product development, while only 11 percent allocate more than 15 percent.
6.6.3. Capturing Ideas
- The data show that a significant percentage of companies appear to operate in a reactive- rather than proactive mode with respect to innovation. As ways to capture ideas from the employees the survey respondents reported that ideas are captured on an “as-needed” basis (46 percent) or as a result of investigations after “system breakdowns or failures“ (34 percent). On a positive note, however, 38 percent of respondents reported that “ideas were reviewed on a regular basis”.
7. SWOT
- Based on the survey, the key strengths, weaknesses, opportunities and threats (SWOT) faced by Arizona aerospace- and defense SMEs are the following:Strengths ■ Product portfolio and product diversity; ■ Frequency and scale of process and system improvements; ■ Balance of revenue sources between private- and public; ■ Balance of customers between military and commercial.Weaknesses■ Strategic planning and strategic plan implementation (especially at smaller companies); ■ Level of utilization of lean manufacturing techniques; ■ Underperformance in on-time delivery of products and services; ■ Level of automation; ■ Certifications (especially at smaller companies); ■ Level of global engagement (in particular export) by all companies; ■ Interest toward- , knowledge of-, and strategy for ○global, and global opportunities; ○sustainability and green; ○innovation (currently reactive- rather than proactive innovation);■ Market presence of, and use technology and social media by, especially smaller companies (in the database 545 organizations out 1382 (or 40%) have no known web-address). Threats ■ Defense budget cuts;■ Foreign competition, and outsourcing to foreign companies; ■ Business relocation out of the State or out of the country; ■ Competitiveness-, skills and level of education of the workforce.
8. Summary and Conclusions
- The survey results presented in this paper give a partial snapshot of the 2011 status of a sample of Arizona aerospace and defense companies with respect to their Next Generation Manufacturing Competencies (NGM) in the following areas: company demographics; supply chain management; global engagement; sustainability and green; process improvement; and innovation. Overall, it can be stated, that while Arizona aerospace and defense companies have significant competitive strengths, they, because of lack of strategy, knowledge, experience and interest toward the global dimension of aerospace- and defense manufacturing, and similarly lack of strategy for innovation, sustainability and “green”, appear highly vulnerable if and when the US defense budgets shrink, while at the same time the global aerospace and defense business continues to change. The questions remain --- can such companies adapt to the changing conditions; and how can these companies, universities and the public sector work together to strengthen the aerospace and defense cluster.Research questions under current investigation include: strength of the relationships between the NGM data and information components, and how knowledge of those relationships could be used to develop a forward looking standardized strategic assessment framework (SSAF) (of models). We anticipate that the SSAFwill place in-between the Porter[8] macro-level (industry level) strategy framework and the resource-based models (RBM). The SSAF will be implemented as a set of software tools to allow small- and medium sized A&D companies to improve their respective strategies and thereby their global competitiveness.
ACKNOWLEDGEMENTS
- This study was supported by the Science Foundation Arizona (SFA), the Arizona Manufacturing Extension Partnership (AZMEP), the Aerospace and Defense Research Collaboratory (ADRC) at Arizona State University, and the State of Arizona, Office of the Governor for Economic Development. We would like to thank RehmanChughtai, graduate student at Arizona State University, for developing the database visualization. We also appreciate the feedback and constructive comments of the anonymous reviewers.