-
Paper Information
- Paper Submission
-
Journal Information
- About This Journal
- Editorial Board
- Current Issue
- Archive
- Author Guidelines
- Contact Us
American Journal of Linguistics
p-ISSN: 2326-0750 e-ISSN: 2326-0769
2014; 3(2): 27-40
doi:10.5923/j.linguistics.20140302.01
A Brazilian Contribution for Automated Linguistic Cartography
 Abstract
 Reference
 Full-Text PDF
 Full-text HTML
Rodrigo Duarte Seabra1, Valter Pereira Romano2, Nathan Oliveira1
1Institute of Mathematics and Computing, Federal University of Itajubá (UNIFEI), Itajubá, Brazil
2Department of Classical and Vernacular Letters, Londrina State University (UEL), Londrina, Brazil
Correspondence to: Rodrigo Duarte Seabra, Institute of Mathematics and Computing, Federal University of Itajubá (UNIFEI), Itajubá, Brazil.
| Email: |  |
Copyright © 2014 Scientific & Academic Publishing. All Rights Reserved.
In Brazil, geolinguistic studies have achieved many advances since 1963, the year in which Nelson Rossi published the first Brazilian linguistic atlas, Atlas Prévio dos Falares Baianos. The fruitful development of Brazilian geolinguistics has required investments in technological advances in order to streamline and to optimize the work of researchers in the task of preparing the atlas, either in audiovisual tools for data collection or the creation of databases to organize the linguistic material collected. Thus, our aim is to present to the scientific community a new computational tool adaptable to the diverse researchers’ needs. Through a simple and intuitive interface, the tool proposed allows the elaboration of various linguistic maps and reports so that the linguists perform their work independently of the intervention of professionals with training in information technology and other areas.
Keywords: Geolinguistics, Linguistic Cartography, Language Studies, Computational Tool
Cite this paper: Rodrigo Duarte Seabra, Valter Pereira Romano, Nathan Oliveira, A Brazilian Contribution for Automated Linguistic Cartography, American Journal of Linguistics, Vol. 3 No. 2, 2014, pp. 27-40. doi: 10.5923/j.linguistics.20140302.01.
Article Outline
1. Introduction
- In the late nineteenth and early twentieth century, within the language studies, a new field of study emerged, linguistic Geography or Geolinguistics that, as opposed to the neogrammarian school, brought a new way of studying the language. Thus, originated under the auspices of diachrony, geolinguistics came to constitute an area of interest, initially in countries such as Germany and France [1], and henceforth expanded to other territories such as Italy, Switzerland, Spain and also to other continents; in the Americas, it reflected in the work by Hans Kurath [2] in preparation of the Linguistic Atlas of New England (LANE), Tomás Navarro [3], with the study of Puerto Rican Spanish and later by other scholars in Colombia, Mexico, Chile and Brazil.According to [1], in the first dialectal studies, scholars were observed to select a particular locality and to gather data from local speakers, prioritizing sounds, grammar and, to a lesser extent, the syntax, not sticking to vocabulary. The material collected was compared with those of other dialects by consulting the glossaries and could be explained with the aid of traditional grammars. A more convenient and fast mode to perform this comparative study was thus made necessary. Almost spontaneously, a new way of performing this comparison emerged, representing “in special maps” a relatively high number of linguistic forms (phonic, lexical or grammatical) proven by direct and unitary research in a given area of network points [4]. All these linguistic maps will constitute what is commonly called the linguistic atlas.Currently, in the Brazilian scenario, there are five reference works on geolinguistic research, [5-7] and two books organized by [8, 9] that present theoretical and methodological aspects of this field of study, considering mainly the specifics of Brazilian Portuguese. These works have referrals that can guide researchers as regards the definition of the point network, the profile of the respondents, the data collection instruments, as well as brief notes on the linguistic cartography.However, in Brazil, the current literature lacks a work that presents methodological approaches more targeted to cartography that can be generated from a computerized geolinguistic database, methodological referrals given that the first attempts by [10] to manage these data were not successful or deserved diffusion among researchers in the area. Thus, each researcher who proposes to develop a linguistic atlas presents the maps differently, whether on account of the methodological aspects of research, either for the lack of a guiding directive about what to cartographically represent and how to do this representation.In contrast to the Brazilian reality, in the international scenario, there is the existence of developed computational tools for the purpose of storing and mapping geolinguistic data, such as, DiaTech [11], Gabmap [12] and Arvid [13]. Additional details about these tools and other researches can be found in [14-19].In this line, this paper contributes by presenting a tool developed as an alternative to existing programs. Hence, the next sections present some considerations about the linguistic mapping and, therefore, relevant aspects to the computational tool developed.
2. The Process of Data Storage and Linguistic Mapping
- According to [20], the mapping entry has two meanings “(i) set of studies and scientific, technical and artistic operations that guide the drafting of geographical maps; (ii) description or treatise on maps”. Thus, the term can be applied to any science-based operation that aims to represent the results from geographical maps and, by extension, this broad conception of the term can be applied to linguistic studies.As started earlier, language scholars have long represented the diversity of the languages in “special maps” [4]. Thus, according to previously established objectives, after lifting the oral corpus of a given community, duly transcribed and organized, the work of geolinguistic nature proceeds to the mapping process [5].As observed, in the Brazilian scenario, the stage of linguistic cartography, an important step towards the construction of the linguistic atlas, is performed mostly by geography area professionals that have specific knowledge of cartography and GIS (Geographic Information Systems) or by graphic designers, persons qualified to work with image editing software. Rarely do linguists produce their own maps due to two main reasons: (i) the large set of data to be analyzed and studied, which requires extensive investment of time and (ii) the lack of computational knowledge of image editing and generation software.In this line, linguists feel “compelled” to “outsource” the cartography of their atlas, being responsible for doing the exegesis of the corpus and for transferring the necessary information to the professional that will spatially represent the selected linguistic material. Hence, the linguistic map is elaborated without the direct participation of the linguists, who only have access to the end product – the finished map – with responsibility for reviewing and, when necessary, requesting adjustments to the professional hired.The cartographer or designer is the one who performs the tasks, being the mediator between the linguistic material represented in the map and the linguists. This process of intermediation makes the production of linguistic atlas a time-consuming activity, which finishes dragging the atlas project for years until a considerable number of linguistic maps can be published.This has been the immediate solution found by Brazilian geolinguists to produce atlases. However, the drafting of a linguistic map is observed to be a complex task, thus in line with the ideas of [21], “making a map is not merely working on the transposition of the answers provided for a cartogram”. Linguistic cartography has requirements that go beyond technical expertise. Intellectual knowledge belonging to those working in this field of study is required, because, in addition to knowing how to represent, it is necessary to know what to represent, which variants are valid, the extension of the caption, the nature of the map (lexical, phonetic, morphosyntactic, isoglosses), the type of representation, among other factors that the “non-linguist” in general does not understand and sometimes ignores, prioritizing aesthetic or even conceptual aspects of other disciplines.As noted earlier, the process of selection and exegesis of the data lies with the linguists; however, if they are able to generate their own linguistic maps automatically, without the involvement of and dependence on third parties, the work is much more productive. With this, it is possible to map as many items as needed and delete atlas maps that were produced, albeit not significant to the study, without loss of time or financial investment.The linguistic mapping of the first five Brazilian linguistic atlases published, the Atlas Prévio dos Falares Baianos – APFB [22], the Esboço de um Atlas Linguístico de Minas Gerais – EALMG [23], the Atlas Linguístico da Paraíba – ALPB [24], the Atlas Linguístico de Sergipe – ALS [25], and the Atlas Linguístico do Paraná – ALPR [26] was drawn manually, especially the first. As evidenced by [27], without computing resources today, the transcripts of the original APFB were prepared by designers, photographed and pasted at their respective points of each map. In ALS, the process, albeit still handcrafted, was no longer painstaking, counting with the use of electric typewriters with removable type balls, with many of the symbols used by the Lacerda-Hammarstöm system.However, the technological advances of recent decades are observed to have led to the creation of atlas projects that consider the potential of computers, mainly in the structure of geolinguistic databases and computerized cartography, as pointed out by [28].A resurgence in international atlas projects over recent decades has led to a strong (and continuing) interest in cartographic methodology. Above all, the computational handling of maps and atlases needs to be seen as a current focus of attention [28].In Brazil, geolinguists have already taken the first steps into considering the technological advances in the development of linguistic atlases. One example is the so-called third generation atlas, classified according to [7]. Regarding this atlas, the researcher says that this is the introduction of live data, i.e., the possibility of hearing and recording statements referred to and documented by cartography, atlases called parlants. Differentiated programs have allowed the implementation of this type of data presentation. In this line, and to set a Brazilian example, we have the Sound Linguistic Atlas of Pará [29].Although not yet widespread atlases that category, the trend introduced by ALiSPA [29], when considering computational resources in the mapping and data presentation process, undeniably demonstrates a breakthrough in Brazilian Geolinguistics. However, the vast majority of geolinguistic works have not incremented these new technologies for the reasons already mentioned.Regarding the organization of geolinguistic databases, some options are already available, but developed under the marketing perspective, not necessarily scientific. That is, computer professionals develop tools, desktop or online, which allow users to store geolinguistic data for different queries through reports. Examples of software that generate various reports are the Agium Search, developed and used in works such as [30] and [31], and the SGP (Sistema Geral de Pesquisa) used by [32]. These tools prove fruitful, since they optimize researchers’ time. However, they present a drawback regarding maintenance and cost, which, albeit not high, requires the intervention of a third party for updating and maintaining the server.This discussion about the importance of managing geolinguistic databases is not recent. In the late 1990s, [10] discussed the importance of computerization of geolinguistic data pointing to possible solutions that optimized researchers’ time and could speed the publication of linguistic atlases. According to the author, the time spent with the creation of a computerized database is matched with great advantage because it allows the preparation of maps and publication of Linguistic Atlas much faster and, as a result, their data can be accessed by other researchers interested in furthering their studies.From the computer program developed by Vieira and his team – the Sistema de Processamento de Dados Geolinguísticos (SPDGL) – the first fully computerized Brazilian linguistic atlas was published – the Atlas Linguístico-Etnográfico da Região Sul – ALERS [33, 34]. The same program was also used by [35], with adaptations for organizing and mapping data of the Atlas Linguístico do Mato Grosso do Sul – ALMS. Besides these two atlases, there are no reports of other projects that used the SPDGL for data storage and map generation. Another linguistic atlas that used a computerized system in its cartography was the Atlas Linguístico do Amazonas, which deals with a specific computer program – ALAM/MVL – with a database that allowed entering all the concepts, data from informants, the locations and all the responses, both phonetic and lexical [36].However, the solutions for storing and for linguistic cartography, such as ALERS [34-36], or even that proposed by [10], solve specific problems in each project and are not disclosed to the scientific community, given that the database is modelled according to the specificities of each job. In short, each project was verified to employ different methodologies for storing and mapping linguistic data, either with computer programs linked to the database or by using image editing programs.Accordingly, in the next sections, we present the [SGVCLin] – Software for Generation and Visualization of Linguistic Maps, computational tool developed under a PhD project in Language Studies. This program aims to facilitate the consultation process of linguistic material transcribed and stored in a general database that will fit all types of projects. Thus, the results from the tool will be made available through various reports and by generating linguistic maps of productivity and isogloss maps. Isoglosses mean a virtual line which mark the limit, also virtual, linguistic shapes and expressions (...) “an isoglosses can be lexical, i.e., isolexical; may be phonic, isophonic; may be morphological, isomorphic and could be syntactic” [6].The modeling of the database followed basic information on methodological criteria guided by the Linguistic Atlas of Brazil (ALiB), inter-institutional research project in full development in the country, through the direct action of researchers from eight federal states, such as [37].Note that the researchers meaning to develop linguistic atlas in the Brazilian scenario cannot ignore the advances made by ALiB, considering its scope and importance to Brazilian geolinguistic studies. Thus, with this tool, totally free and of easy interaction, given the inductive character attributed to the program features, after storing the information needed for the study, linguists themselves can generate reports and linguistic maps without major difficulties.The main motivation for developing the software was to create an environment in which the linguist can be independent in handling the tool. However, because Geolinguistics is inserted in linguistics and geography interface, it is up to researchers, before starting to use the software, to contact a geographer to prepare their map or cartographic base, which is properly georeferenced, containing the essential elements, such as the graphical scale, the political boundaries of the territory and the location of linguistic points. Once the map is prepared in image format (extension ‘png’, ‘jpg’, ‘bmp’), linguists can load it into the tool and thus represent numerous linguistic facts (phonetic, lexical, morphosyntactic).
3. The Tool [SGVCLin]
- The guiding directive for the development and deployment of the system consisted in designing a graphical user interface that prioritizes intuitiveness and simplicity. These qualities have led the process of system development with the active participation of the user profile from the collection of requirements, in order to facilitate their interaction and thus meet satisfactory usability standards.Different linguistic maps with data representative of real samples with different representations were used to define the requirements of the tool besides the knowledge discussed in meetings subsidized by the ALiB Project - regional Paraná. After the analysis process of linguistic maps of atlas already published and experimental maps developed “ad hoc” for scientific articles with data of ALiB, the requirements were identified and the development of the tool proposed began.In general, the system consists of a computational tool designed to provide a simple interface allowing the storage of geolinguistic data and subsequent generation of linguistic maps by querying the database. In addition, the software allows the creation of groups of questions per user and reporting guided by different variables, as well as the creation of two-dimensional maps: diatopic/diasexual and diatopic/diagenerational [38], and isogloss maps.
3.1. System Design
- The [SGVCLin] consists of a tool to support the mapping process of linguistic data providing flexibility and agility to information storage. Because it is a tool for using within the research and possibly as a complementary resource in the teaching of linguistic data mapping, the system basically uses a conventional interface consisting of windows, icons, menus and pointing device (via mouse). Every user interaction with the system occurs via interface, without requiring any direct manipulation of the database. The software in the desktop version was developed using Java language and MySQL database. The database used by the tool was modeled not only based on the records of the informants, but also on the methodology of the ALiB Project.
3.2. Description of Interface
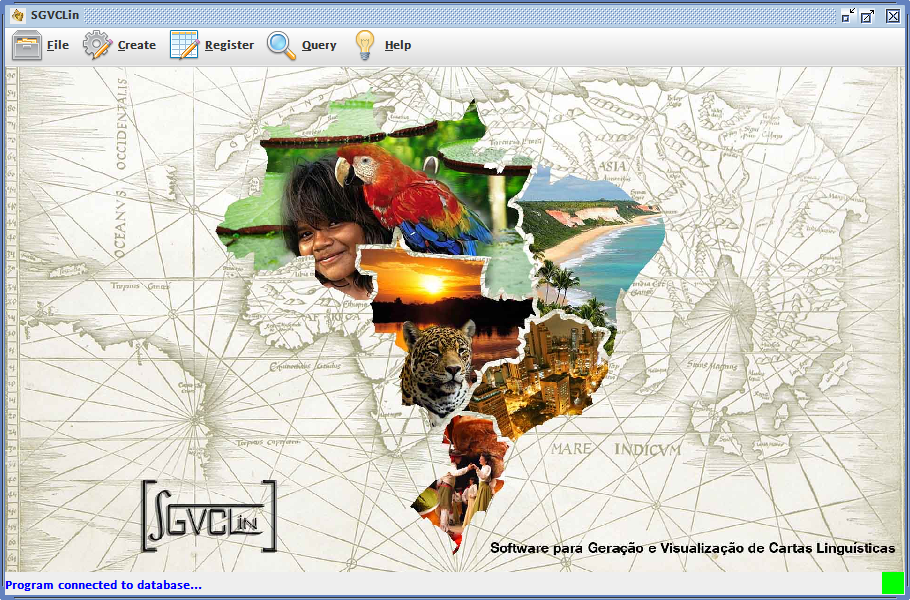
- The interface of the tool displays menus and buttons, components traditionally available in most conventional computer applications. Initially, as illustrated image is displayed on the screen (Figure 1), the main menu bar of the software at the top of the window and a status bar at the bottom, which guides the user through the interaction process. A green icon can also be seen in the lower right corner of Figure 1, represented by a connection connector, which indicates that it was successfully established. The interface of the tool has compatibility with Portuguese and English languages.
 | Figure 1. Main screen of the software |
3.2.1. Manipulation of Files
- The first option of the main menu – File – presents five functionalities, namely: (i) Clear; (ii) Export; (iii) Import; (iv) Print; (v) Exit.Action (i) is responsible for recreating the database, deleting all the information saved in it. In (ii), the software allows you to export the current database to a file, allowing copying to other computers. The data will be saved in user-specified directory and the file will have the extension ‘.sgvclin’. Functionality (iii) loads a file exported by the tool and copies the data read into the database. In this case, the currently existing information will be deleted. Action (iv) allows recording the linguistic map generated for an image file. From the image created, the user can send it for printing. Finally, option (v) terminates the execution of the tool.In order to prioritize the intuitiveness of the users interaction process with the tool, for each feature developed, the software displays hints (tooltips) that guide their actions by placing the mouse pointer over interface components (menu options, buttons etc.).
3.2.2. Creating and Editing
- The actions related to creating and editing include features that allow users to create various categories of questionnaires, questions and possible variants for each question. Moreover, this set of actions also allows working with different maps and their issues, as needed for each project. For the insertion of the informant’s answers to the questions, users also have the flexibility of creating informant data sheet models to be filled. In summary, there are five features available: (i) Questionnaires; (ii) Questions and Variants; (iii) Maps; (iv) Edit Point Grid; (v) Data Sheets.In action (i), users can create categories and subcategories of questionnaires. This relaxes and organizes users’ work who can simultaneously work with different categories of questions grouped into semantic areas in one or more questionnaires. Action (ii) enables users to create custom questions groups to their study and identified individually by the number and its formulation (title). To indicate the category of the questionnaire in which the issue will be allocated, the software waits for users to enter a list of likely variants to the question (Figure 2).
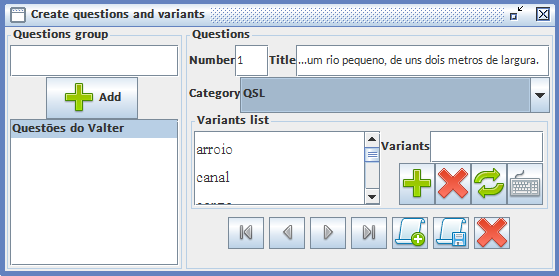 | Figure 2. Creating a sample question with its variants |
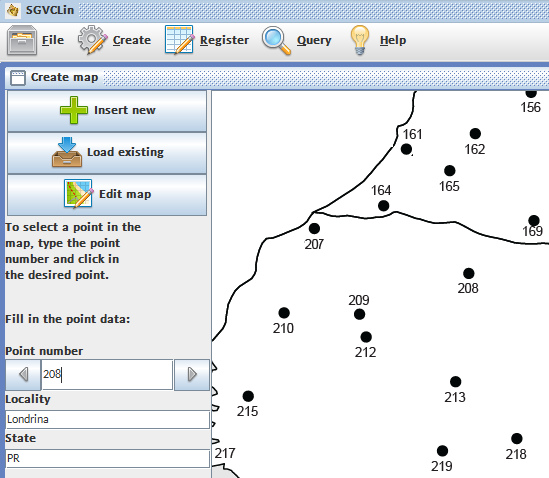 | Figure 3. Registering a network of points on the map |
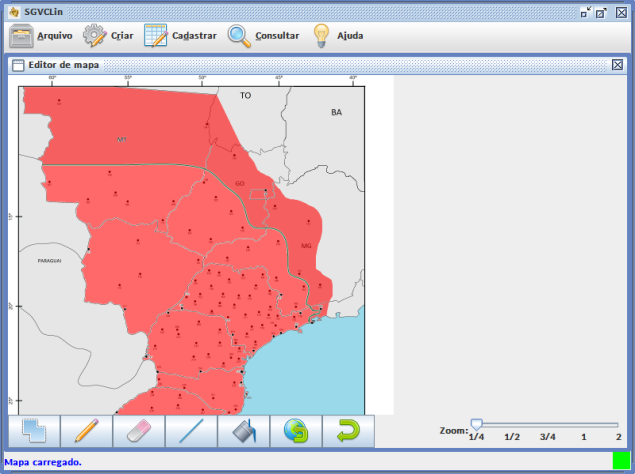 | Figure 4. Delimiting area of map for generating isoglosses |
3.2.3. Registration
- The software provides two functionalities for registering information. The first concerns the inclusion of personal information of informants in the informant sheet model previously created. The second allows the inclusion of informants’ responses to each of the issues discussed. Information concerning the sheet can be inserted through the option Data Sheets [29], which makes custom models available (if more than one) stored in the software database. Importantly, at this point, the user can register the information of the amount of informants desired per location.The registration of the informants’ responses is executed based on the selection of the sheet model elaborated and question group worked on. Through the Answers option the user can register the responses of informants individually in each location because the software automatically displays on the screen the point network defined in previous steps. Thus, in the Insert Data window (Figure 5), one can select for which question (among those available in the group of questions) the answers are to be included. During the answers insertion by clicking on the table, the user can quickly select one of the variants already registered in the creation of issues and variants stage.
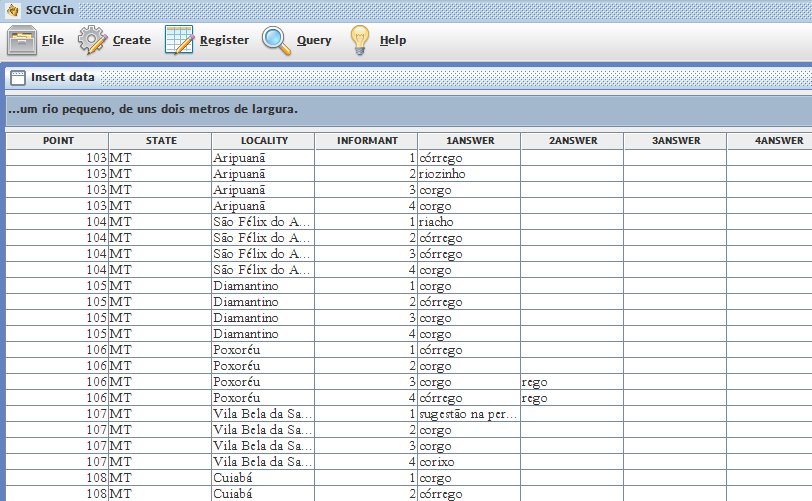 | Figure 5. Registration the responses of informants per question |
- Aiming to increase the simplicity of the registration information, the [SGVCLin] provides a table organized per point, state, locality and informant. However, by default, the software initially provides six columns for registering the first to sixth answer to the question, if they exist. If the user needs to add more answers, just click on the corresponding button and the tool instantly provides more columns to fill. In addition to the responses represented by the variants, it is possible for the user to enter written comments for each informant and any occurrences of informants who could not know the answer (NK) or when some kind of technical problem has occurred (TP).
3.2.4. Queries
- They three main categories of features, namely: Export, Reports and Maps. The actions in the first category are responsible for, from the set of user-supplied data represented by questionnaires, questions, variants, maps and point network, generating files in spreadsheet format with the information tabulated and organized. This functionality was identified as a need, because these files serve as input for more detailed statistical treatments that go beyond the basic calculations of descriptive statistics. With the generation of tabulated files, these can be loaded into specific statistical software, for example, SPSS (Statistical Package for Social Sciences).The second category of Query menu involves the generation of Reports, grouped into three sets and distributed into thirteen different formats. The set of reports Overall Productivity has four options as follows: (i) Overall productivity; (ii) Overall productivity per gender; (iii) Overall productivity per age group; and (iv) Overall productivity per point. The second set of reports – Per State – covers four options: (i) Overall productivity per state; (ii) Overall productivity per state according to gender; (iii) Overall productivity per state according to age group; and (iv) Overall productivity per state according to gender and age group. The third and final set of reports regarding some personal information of informants: (i) Overall productivity per civil state; (ii) Overall productivity per education level; (iii) Overall productivity per profession; (iv) Overall productivity per religion; and (v) Overall productivity per social category.At this point, it is important that each report category generates a PDF file with information tabulated per question, and recorded as a function of decreasing productivity of answers. The numerical information contained in the reports is the absolute and relative frequencies of each variant and the total occurrences. Moreover, the observations concerning the occurrence of NK (not known) and TP (technical problem) are printed in the report footer, with the indication of their total, as well as the point number and informant. Figure 6 shows a sample report with overall productivity per gender.
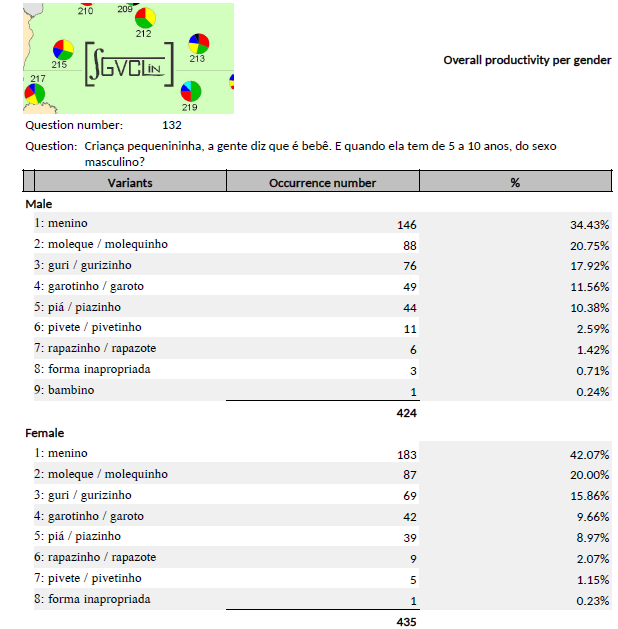 | Figure 6. Example of general report per gender |
- The third category – Maps – concerns the generation of four alternatives of maps, as follows: (i) diatopical; (ii) diatopical/diasexual; (iii) diatopical/diagenerational; and (iv) isogloss. In addition, the software also provides the option Equivalences, in which the user can establish possible pairs of equivalence that possibly indicate the same response. From the pairs established, the tool displays the information grouped in the caption, represented by the same color. Finally, the software also offers the option of the user indicating how many variants will appear in each map, which further facilitates the researcher’s work.The maps generated by the tool show the distribution of responses from informants displayed graphically (in pie shape) on one of the maps entered into the software. In addition to the map with the graphs, the window also displays the caption of the map with reference to the decreasing productivity of each variant and a histogram with the overall productivity (Figure 7).
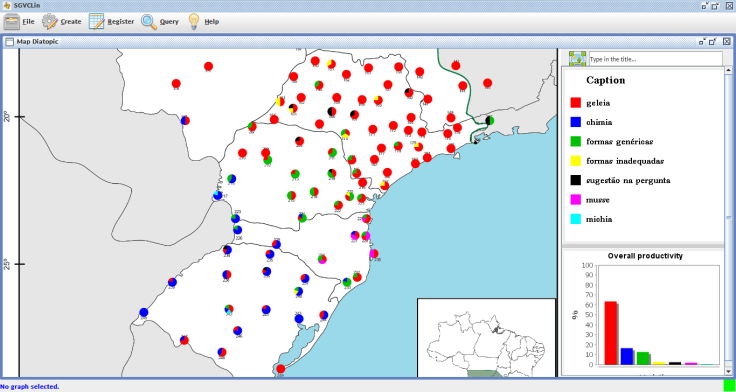 | Figure 7. Example of diatopical map |
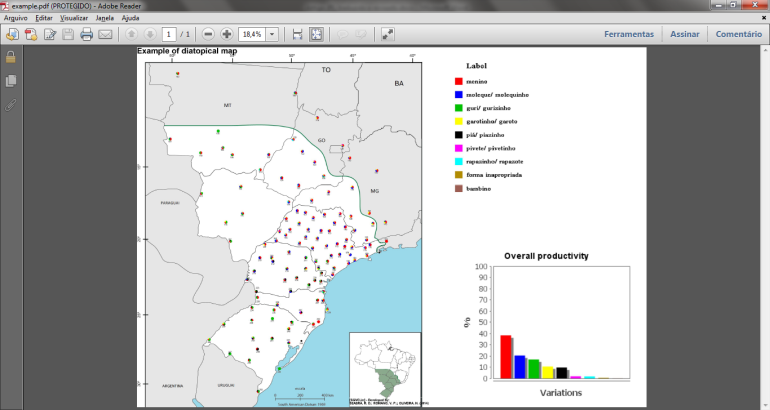 | Figure 8. Example of diatopical map generated for printing |
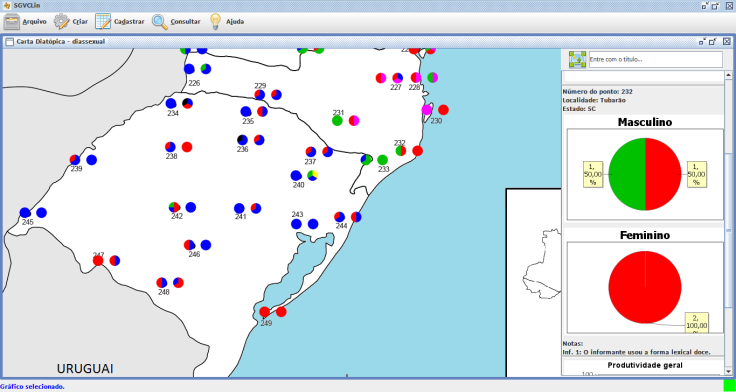 | Figure 9. Example of diatopical/diasexual map |
 | Figure 10. Example of diatopical/diasexual map |
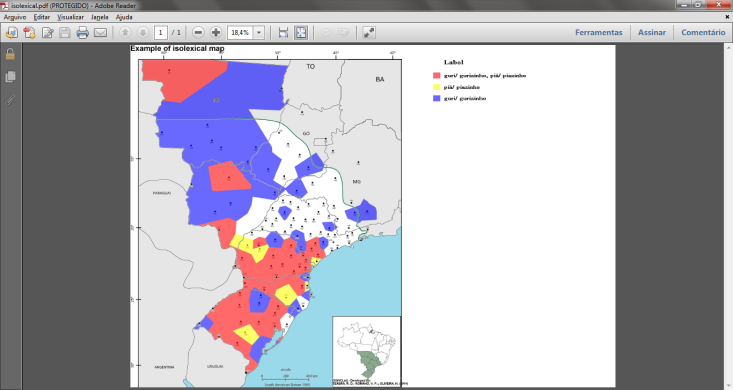
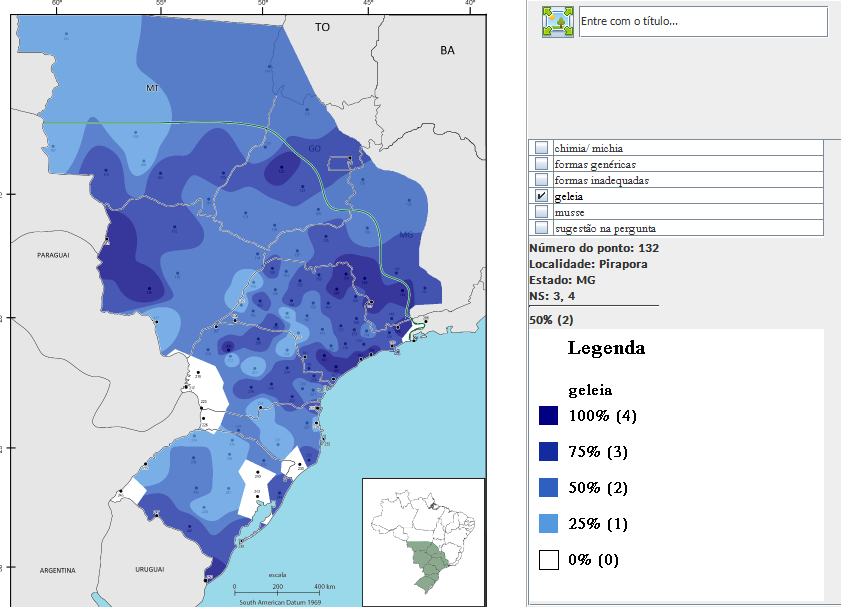 | Figure 11. Example of isogloss map using gradient |
3.2.5. Visualization Details in the Manipulation of Maps
- In order to facilitate the manipulation of maps, the software even provides some additional features. In this line, the user has to interact with three different alternatives of linguistic maps, aiming to apply effects of zoom in or out: (i) using the mouse; (ii) using the keyboard; (iii) using the graphical menu (represented by arrows and two magnifying glasses in the upper left corner of Figure 9).In maps with charts, if the user selects one of them, he can move it using the arrow keys on the keyboard. Moreover, the user can also change the diameter of graphs using the keys ‘+’ and ‘-’. In order to maintain standardization in the presentation of maps, one cannot merely change the diameter of a chart, i.e., the modifications applied to a chart are reflected on the others.
3.2.6. Suggested Use Tool
- Broadly, to start using [SGVCLin] for the first time, the user is suggested to go through the steps in Figure 12. The steps shown in the illustration are noticed to feature a simplified systematization of the main activities to be performed. Each step is triggered according to the user interaction process via pressing the menus and buttons in the interface, namely: (1) opening of application/connect to database; (2) creating questionnaires; (3) creating questions and variants; (4) registration of point network; (5) preparing map in the editor; (6) creating sheet model; (7) registration data in the sheet; (8) registration answers; (9) generating report; (10) generating linguistic map; (11) exporting data; (12) printing; (13) handling charts; (14) handling map; and (15) applying zoom effect.
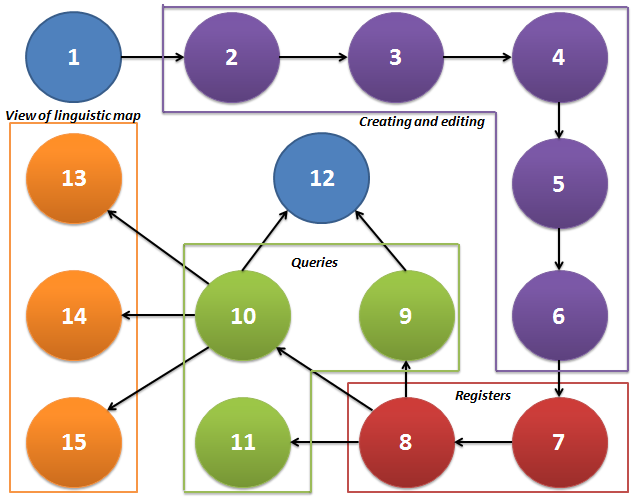 | Figure 12. Systematization of the main actions performed in [SGVCLin] |
4. Proposed Use of the Tool in Dialectology Lessons
- To use the [SGVCLin] in Dialectology lessons, the teacher may propose to the students an end of course assignment in which they must perform a geolinguistic research. Thus, the methodological steps for performing dialectologic research should be given in advance, enabling students to develop tools for collecting and selecting informants, to apply the questionnaires and to transcribe the linguistic material. Once these methodological steps have been taught and students have undertaken fieldwork and transcription of language material, one can start using of the tool for storing such data. Students can install the software on their personal computer and, along with the teacher, they can produce the learning material themselves.The teacher’s approach may, according to Figure 11, be guided through the steps of creating and editing (purple), registering (orange) and consulting (green). Thus, topics such as: (i) creating a geolinguistic database; (ii) data collection instruments; (iii) concepts of cartographic base or basis map properly georeferenced; (iv) the demarcation and registration of linguistic point network from the basemap; (v) informant sheet models, previously listed, can be addressed in the database creating process.The teacher, at this point, can emphasize aspects about the proper storage of linguistic material collected by the survey spot, duly transcribed according to pre-established norms. The importance of a database is justified by the need to store the material securely for future reference, either by reports and/or linguistic maps.In a geolinguistic research, there are three essential criteria: (i) selection of a talk community of a given territory; (ii) selection of location natural informants according to the profile previously established; and (iii) application of questionnaires directly and/or indirectly to these informants. In the early stages (creation of questionnaires and creation of questions and variants) the types of questionnaires used in the collection (phonetic-phonological, lexical-semantic or morphosyntactic) and their subdivisions are reported in the tool; for example, the semantic areas, phonetic and morphosyntactic phenomena studied etc. In a research, there is the possibility to insert just one of those different instruments or even three.A collection instrument will consist of questions; therefore, in the second stage, the questions with which we intend to work as well as possible variants obtained for them are inserted. These possible variants could be edited at later times as well as including other forms that have occurred. Thus, topics about the structuring of collection instruments can be addressed in detail in these two functionalities as well as the validity of the responses, be it grouping forms, be it creating labels for categories of variants, ‘unproductive forms’, ‘inadequate forms’ etc.Concepts of cartographic base or base map can be addressed in the third stage of the creating and editing process. The teacher can present different types of maps that will really serve ‘as a base’ on which the linguistic data will be represented. The interface of Linguistics with Geography and the need to contact a geographer for preparing this map in image format should be added here. Aspects such as georeferencing localities, geographic coordinates, graphic scale and political boundaries are made necessary for elaborating scientific work.The cartographic base will contain the linguistic points at which the interviews were conducted. In the registration of these points, it is necessary to discuss aspects of localities symmetrical distribution with students, covering all the regions of the map selected (north, south, center, west and east) without having the overhead of linguistic points in one region or another. Therefore, after registering the points, user must prepare the map in the “map editor” tool indicating to the software which the areas related to the study, since the image prepared by the geographer usually has other areas that are not properly investigated in a research; for example, international boundaries, state boundaries, presence of rivers, mountains etc. This step enables the generation of further isogloss maps because without this, the tool will not distinguish, for example, between a line that may represent geographic boundaries or a river, roads etc.The last step of the creating and editing phase refers to the informant sheet model. At this point, it is worth noting the importance of controlling all the extralinguistic variables established by the research. The informant sheet is important in this regard. Prerequisites that must be met in data collection are therefore established, such as gender, age, education level, social class, profession, among others that can interfere with the informant linguistic usage. As an index card model, users intend to use the software in their research must be based on the informant’s sheet of the ALiB Project, and they can also make adjustments according to the objectives of their work.After the step of creating and editing, the teacher may discuss topics concerning (vi) registration of data in informant sheets; and (vii) registration of responses in the database. The register data in the sheet will follow the information placed in the model sheet created in the previous step. Thus, the user will fill the data from each of the informants of their research constituting a key point for the entry of data in the database, since the linguistic information of the subsequent phase will be intrinsically linked to the data of each informant.The second stage of the register is the insertion of responses in database. Hence, the software allows users to select the variants registered in the previous step and to bind them to the informant sheet. If some not previously registered form occurs, there is the possibility of registering new forms. This interaction stage with the tool is more time-consuming; however, this occurs only once. The registration of the informant sheet and of the responses are two functionalities that are related and consist in the database core that will reflect in subsequent queries.The consultation step presents research results. At this time, the teacher may ask the student to interpret the reports results, a topic (viii) mentioned earlier. This interpretation will guide the student in developing differentiated linguistic maps, depending on the results. That is, at this point, what form is more productive, which variants are noteworthy in cartography and which forms can be pooled are revealed. Once what is relevant for the representation of maps is selected, this can be generated automatically, without major time investment and mathematical-statistical knowledge because the software makes the necessary calculations.Finally, the map visualization step allows users to manipulate the material produced, graphs or maps, applying approach or distancing effects, i.e., it consists in a visual step which allows interacting with the interface dynamically. Thus, at the end of the interactive process, it is possible to print the material, or to save the files to the computer for later printing. Hence, after the production of their own learning content, teachers can select a class for students to socialize the material produced in the form of seminars.
5. Final Considerations
- The pressing need for time optimization and direct participation of the linguist in the development of linguistic maps makes [SGVCLin] an innovative tool in Brazilian scenario because, currently, there is not a computer program designed to be widely used in many geolinguistic works. This flexibility attributed to software is due to the fact that it was developed considering many of the methodological aspects employed in the ALiB Project, a reference with regard to Brazilian geolinguistics. In addition, the tool was developed to perform as a complementary alternative to existing programs primarily in the international scenario. The users of the [SGVCLin], linguists, are able to interact naturally with the functionality of the system, since they can count on an explanatory tutorial. Moreover, the buttons and icons, as well as the tooltips that indicate the steps performed at each stage, provide an intuitive and didactic interaction. It is of paramount importance to disseminate works using available technological advances to solve methodological problems in other areas. In this line, considering the support of computer technology, the tool not only speeds up the mapping process, but also provides reports that cross linguistic and extralinguistic information, advancing to the “sociolinguistic veins” [7] of contemporary dialectology.Moreover, in the Dialectology discipline, the teaching of linguistic mapping guided by a tool that allows storing data and generating maps in an optimized time becomes interesting once the student gets motivated to conduct a fieldwork, more productively assimilating the topics treated in the lessons. Thus, to produce their own study material, students puts into practice the challenge of performing a linguistic atlas, comprising the particularities of their interest area.Until then, the lack of a tool that facilitates the linguistic cartography process represented a need that had not been met. It was necessary, therefore, to use technological resources to solve methodological problems in areas such as Dialectology. This reveals the interdisciplinary nature of computing, present in the various field of human knowledge, showing once again the importance of a fruitful dialogue between Linguistics and Computation. Both research and teaching topics of linguistic mapping have significant gains.In a future release, the software is intended to make available the option of the user interacting with linguistic maps by means of advanced features that go beyond the conventional two-dimensional visualization. In this context, new features will be implemented to allow the application of a promising technology – Augmented Reality – in which the user can interact in real time [39] and manipulate the linguistic maps in a three-dimensional environment, which will certainly further facilitate the visualization of the information presented in charts and productivity histograms. It is also worth mentioning that the tool is undergoing copyright registration and will later be made freely available to the scientific community.